MERIS Overview
Applications
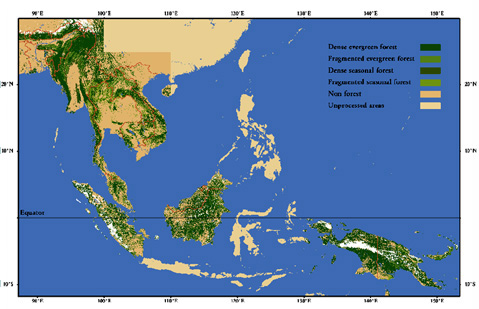
MERIS was used for the observation of the oceans, atmosphere and land. Specifically, Ocean Biophysical Properties, Coastal Waters, Atmospheric Constituents, The greenhouse effect, Aerosols, Earth Radiation Budget, Global Land Cover, Agriculture, Hydrology and Forestry.
The global mission of MERIS had a major contribution to scientific projects which seeked to understand the role of the oceans and ocean productivity in the climate system through observations of water colour and it furthered our ability to forecast change through models.
Secondary objectives of the MERIS mission were directed to the understanding of atmospheric parameters associated with clouds, water vapour and aerosols in addition to land surface parameters, in particular vegetation processes. MERIS also contributed to climate studies and global change observations by addressing environmental features in a multi-disciplinary way.
Read full details of the MERIS applications
Design
MERIS was a programmable, medium-spectral resolution, imaging spectrometer operating in the solar reflective spectral range. Fifteen spectral bands could be selected by ground command, each of which had a programmable width and a programmable location in the 390 nm to 1040 nm spectral range. The instrument scanned the Earth's surface by the 'push broom' method. CCDs arrays provided spatial sampling in the across track direction, while the satellite's motion provided scanning in the along-track direction.
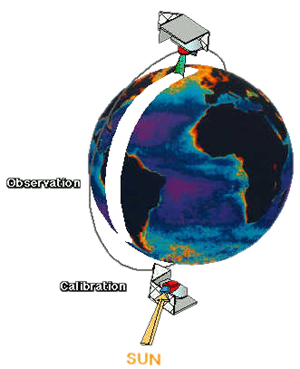
MERIS was designed so that it could acquire data over Earth whenever illumination conditions were suitable. The instrument's 68.5° field of view around nadir covered a swath width of 1150 km. This wide field of view was shared between five identical optical modules arranged in a fan shape configuration. In the calibration mode, correction parameters such as offset and gain were generated, which were then used to correct the recorded spectra. This correction could be carried out either on board or on the ground.
Earth was imaged with a spatial resolution of 300 m (at nadir). This resolution was reduced to 1200 m by the on board combination of four adjacent samples across track over four successive lines. The scene was imaged simultaneously across the entire spectral range, through a dispersing system, onto the CCD array. Signals read out from the CCD passed through several processing steps in order to achieve the required image quality. These CCD processing tasks included dumping of spectral information from unwanted bands, and spectral integration to obtain the required bandwidth. On-board analogue electronics performed pre-amplification of the signal and correlated double sampling and gain adjustment before digitisation.
The on-board digital electronics had three major functions: it completed the spectral integration, performed offset and gain corrections in full processed mode, and created the reduced-resolution data when required.
The calibration of MERIS was performed at the orbital south pole, where the calibration diffuser was illuminated by the sun by rotating a calibration mechanism.
MERIS Engineering Requirements
The engineering requirements on the instrument, which were derived from the Envisat mission requirements, are as follows:
- Spectral range: 390 nm to 1040 nm
- Spectral resolution: 1.8 nm
- Band transmission capability: Up to 15 spectral bands, programmable in position and width
- Band-to-band registration: Less than 0.1 pixel
- Band-centre knowledge accuracy: Less than 1 nm
- Polarisation sensitivity: Less than 0.3%
- Accuracy: Ocean colour bands typical S:N = 1700
- Swath Width: 1150 km, global coverage every three days
- Waveband: VIS-NIR: 15 bands selectable across range: 390 nm to 1040 nm(bandwidth programmable between 2.5 and 30 nm)
- Radiometric accuracy: Less than 2% of detected signal, relative to sun
- Band-to-band accuracy: Less than 0.1%
- Dynamic range: Up to albedo 1.0
- Field of view: 68.5°
- Spatial resolution: 300 m at nadir. Ocean: 1040m x 1200 m, Land & coast: 260 m x 300 m
Design Concept
The principal contributions of MERIS data to the study of the upper layers of the ocean were:
- The measurement of photosynthetic potential by detection of phytoplankton (algae)
- The detection of yellow substance (dissolved organic material)
- The detection of suspended matter (re-suspended or river borne sediments)
Apart from the above three major observable features, it was also possible to detect special plankton blooms, for example red tides through their absorption feature near 520 nm. In addition, investigations on water quality, the monitoring of extended pollution areas and topographic observations (such as coastal erosion), were possible.
Atmospheric Mission
The radiation balance of the Earth/atmosphere system is dominated by water vapour, CO2 and clouds, as well as being very dependent on the presence of aerosol. However, the global monitoring of cloud properties and their processes, is not yet sufficiently accurate. MERIS was intended to help redress this balance by providing data on cloud top height and optical thickness, water vapour column content, as well as aerosol properties.
Land Mission
Questions related to global change include the role of terrestrial surfaces in climate dynamics and biogeochemical cycles. Spatial and temporal models of the biosphere are currently being developed to study the mechanics of such complex systems in order to predict their behaviour under changing environmental conditions. These models are based on physical and biophysical relationships, which need to be validated on a regular basis using data from space borne sensors. Repetitive accurate physical measurements are necessary in order to quantify surface processes and to improve the understanding of vegetation seasonal dynamics and responses to environmental stress.
In order to achieve these mission goals, the different radiometric and geometric requirements imposed by the various objectives had to be satisfied. With the help of the ESA Science Advisory Group for MERIS, these requirements were refined, taking into consideration the constraints imposed by a polar orbiting platform and the technical possibilities of an imaging spectrometer.
In advance of the launch of MERIS, the Ground Segment was designed and algorithms were developed for the interpretation of MERIS observations and dedicated studies were performed to establish the means of validating MERIS data products. This was achieved in close co-operation with the European Expert Support Laboratories (ESL's) whose scientists are the main authors for all retrieval algorithms. Wherever possible the underlying physical models were validated using experience acquired before Envisat launch using data provided by airborne or ship-borne campaigns and in-situ measurements on especially equipped campaign sites.
Measurement Principle
MERIS was a push broom imaging spectrometer which measured the solar reflected radiation from Earth's in the visible and near infrared part of the spectrum during daytime.
The 1150-km-wide swath was divided into five segments covered by five identical cameras having corresponding fields of view with a slight overlap between adjacent cameras. Each camera imaged an across-track stripe of Earth's surface onto the entrance slit of an imaging optical grating spectrometer. This entrance slit was imaged through the spectrometer onto a two-dimensional CCD array, thus providing spatial and spectral information simultaneously.
The spatial information along-track was determined by the push broom principle via successive read-outs of the CCD-array. Full spatial resolution data, i.e., 300 m at nadir, were transmitted over coastal zones and land surfaces. Reduced spatial resolution data, achieved by on board combination of 4 × 4 adjacent pixels across-track and along-track resulting in a resolution of approximately 1200 m at nadir, were generated continuously.
The calibration was performed at the orbital south pole, were where a reference diffuser is illuminated by the su. During calibration, the Earth viewport is closed and the sun-view port opened to provide, in the case of radiometric calibration, a uniform radiance source, and in the case of spectrometric calibration, a radiance source with a spectral signature.
Mission Requirements
In order to achieve the application objectives outlined above, the different radiometric and geometric requirements imposed by the various applications had to be satisfied. Together with the ESA Science Advisory Group for MERIS, which was created in 1988, these requirements were refined, taking into consideration the mission constraints of a polar orbiting platform and the technical possibilities of an imaging spectrometer.
Geometric Requirements
The MERIS output represented both a significant global product and data for detailed examination for regional applications. Following this requirement an operation in two spatial resolutions had been established. Full Resolution (FR) data at 300 m on-ground resolution at sub-satellite point was mainly required in coastal zones and over land. Reduced Resolution (RR) data at 1200 m on-ground resolution at sub-satellite point, was intended for large scale studies. Oceanographic and atmospheric investigations required a global Earth coverage within three days.
Spectral Requirements
MERIS was designed to acquire 15 spectral bands in the 390 - 1040 NM range of the electromagnetic spectrum. The instrument had the capability to change its band position, width and gain throughout its lifetime. In accordance with the mission goals and priorities of this instrument, the following table of 15 spectral bands has been derived for oceanographic and interdisciplinary applications.
| MDS Nr. | Band centre (NM) | Bandwidth (NM) | Potential Applications |
|---|---|---|---|
| 1 | 412.5 | 10 | Yellow substance and detrital pigments |
| 2 | 442.5 | 10 | Chlorophyll absorption maximum |
| 3 | 490 | 10 | Chlorophyll and other pigments |
| 4 | 510 | 10 | Suspended sediment, red tides |
| 5 | 560 | 10 | Chlorophyll absorption minimum |
| 6 | 620 | 10 | Suspended sediment |
| 7 | 665 | 10 | Chlorophyll absorption and fluo. reference |
| 8 | 681.25 | 7.5 | Chlorophyll fluorescence peak |
| 9 | 708.75 | 10 | Fluo. Reference, atmospheric corrections |
| 10 | 753.75 | 7.5 | Vegetation, cloud |
| 11 | 760.625 | 3.75 | Oxygen absorption R-branch |
| 12 | 778.75 | 15 | Atmosphere corrections |
| 13 | 865 | 20 | Vegetation, water vapour reference |
| 14 | 885 | 10 | Atmosphere corrections |
| 15 | 900 | 10 | Water vapour, land |
The exact position of the MERIS spectral bands was determined following a detailed spectral characterisation of the instrument.
The spectral range was restricted to the visible near-infrared part of the spectrum between 390 and 1040 NM The spectral bandwidth was variable between 1.25 and 30 NM depending on the width of a spectral feature to be observed and the amount of energy needed in a band to perform an adequate observation. Over open ocean an average bandwidth of 10 NM was required for the bands located in the visible part of the spectrum. Driven by the need to resolve spectral features of the oxygen absorption band occurring at 760 NM a minimum spectral bandwidth of 2.5 NM was required.
The spatial, spectral and radiometric programmability of MERIS was justified by the different scales of the various targets to be observed and the diversity of their spectral and radiometric properties respectively. The advantage of the programmability was not only to select width and position of a respective spectral band, but also to be able to tune the dynamic range thus make it adaptable to different target observation which may have become of a (higher) priority during the MERIS mission.
Radiometric Requirements
The radiometric performance was one of the most crucial requirements for MERIS because the signals coming from the ocean are weak and thus most difficult to detect and quantify. Even though the radiometrically most challenging target to be observed was the open ocean, MERIS also had to encompass a large dynamic range to cover these low level signals as well as signals emanating from bright targets such as clouds and land surfaces, throughout its spectral range. This imposed a rather demanding requirement on the MERIS radiometric performance.
Open Ocean
In the upper layer of the open ocean, the chlorophyll concentration varies from less than 0.03 mg m-3, in the oligotrophic waters, up to about 30 mg m-3 in eutrophic situations. To this variation, which spans over three orders of magnitude, the ocean colour responds in a non-linear way. The goal of MERIS was to discriminate 30 classes of pigment concentrations within the three orders of magnitude. The classes were to be of equal logarithmic width. This requirement was translated into a radiometric sensitivity of 2 x 10⁻⁴ for NE_R (noise equivalent spectral reflectance at the sea level) set for MERIS.
Coastal Waters
For a detection of several water substances, commonly used techniques like simple colour ratios, although successfully applied for open oceans, are not sufficient. The similarity of the spectral scattering and absorption coefficients for all optically active water substances poses problems for finding an adequate procedure for their detection. Here the sun-stimulated chlorophyll fluorescence at a wavelength of 681.25 nm can improve the detection of pigment concentration. The fluorescence signal is small, but detectable from satellite. The desired spectral resolution is about 5 nm and the radiometric resolution has to be better than 0.03 Wm-2sr-1mm-1 for a discrimination of 1mg/m3 pigment concentration.
An outstanding radiometric accuracy is imperative for the atmospheric correction, which is of critical importance since typically 90% of the signal reaching the sensor originates from the atmosphere. For marine constituent detection at shorter wavelengths the atmospheric contribution of about 90 - 95% to the total signal has to be assumed for standard atmospheric conditions over the ocean (marine type aerosol and 23 km visibility), with chlorophyll concentrations of _1mg/m3. Generally a total signal of about 50 Wm-2sr-1mm-1 (including the atmosphere) has to be expected at the sensor at a solar zenith angle of 40 degrees from the sub-satellite point around 450 nm assuming low chlorophyll concentrations. These radiance levels change drastically as a function of solar elevation angles, the location of the pixel in the swath, and the wavelength position.
A knowledge of the atmospheric attenuation was required to the accuracy of about 1% or better which, for satellite (non-in situ) observations, was hardly achievable at that time. In addition MERIS was required to have sensitivity to the polarisation of the incoming light scattered from the atmosphere lower than 1%.
Atmospheric influence
The large influence of the atmosphere on the diversity of target reflectances observed by MERIS necessitated a rather complex radiometric correction scheme.
1. Before a correction proper could take place the MERIS image elements, or pixels, needed to be associated with the proper target algorithm processing branch, i.e. open or coastal ocean, land, atmosphere (cloud). For this the pixels were identified based on tests on spectral dependencies of the MERIS signal at specific wavelengths or an apparent barometric pressure derived from the O2 absorption.
2. The actual atmospheric correction addressed first gaseous transmittance at the same time removing the coupling between absorption and scattering, secondly the correction for the Rayleigh component and multiple scattering effects and thirdly the correction for Aerosol absorption and scattering.
3. In order to verify the corrections of the data sets, various validation procedures were developed using not only different radiative transfer procedures, but also different atmospheric components as input to complex simulation taking advantage of a MERIS system and data simulator. The above procedures are described in detail in contributions by Santer et al., Aiken et al., Morel et al. and Fischer et al. in IJRS MERIS Special issue Vol 20 # 9 15 June 1999.
However, atmospheric constituents were not only being treated as noise and removed by the MERIS atmospheric correction scheme, but also there was a considerable range of "by-products" leading to valuable geophysical variables from the MERIS data such as:
- Cloud top height
- Cloud albedo
- Water vapour column abundance
MERIS Instrument Concept
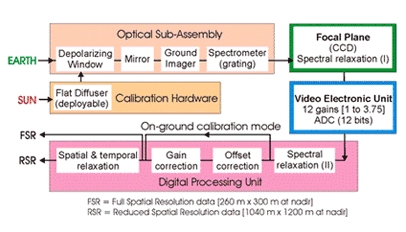
The instrument acquisition and processing chain can be separated into four sub systems:
- The Instrument Optics
- The Detection Focal Plane
- The Video Electronic Unit
- The Digital Processing Unit
MERIS Instrument Optics
The instrument had a field of view of 68.5° divided between five identical cameras, each having a field of view of 14°. The cameras were arranged in a fan shape configuration in which the fields of view overlap slightly. The modular design was specifically selected for MERIS to ensure high optical image quality over a large field of view. The output of each camera was processed separately in an analogue and digital processing unit.
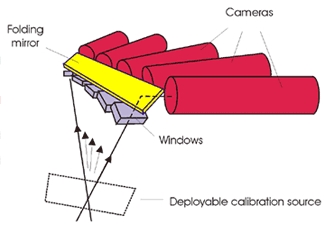
The MERIS optics consisted of an external window, a folding mirror, an off axis catadioptric ground imager and a spectrometer. A window scrambled the incident polarised light coming from Earth, making the instrument less sensitive to changes in light polarisation. The window also played the role of protecting the rest of the optical elements.
The ground imager consisted of a three lenses aperture group, a concave primary mirror, a convex secondary mirror cemented on the third aperture lens, and a field lens cemented on the spectrometer. The dispersive element of the spectrometer was a low grooves density concave reflecting holographic grating. A blocking filter was inserted in the corrector block to suppress the second order of the grating.
MERIS Detection Focal Plane
The camera's detectors were CCD arrays specifically developed for MERIS. Thinned back side illuminated CCDs were selected which offered the required responsivity in the blue part of the spectral range. The camera swath was imaged along the CCD line while the light dispersion took place along the CCD column. Each pixel was 22.5 micron square. The CCD covered the spectral range with a nominal 1.25 nm spectral sampling interval. The CCDs operated in a frame transfer mode. The frame period was 44 ms. After integration, the charges were rapidly transferred from the imaging zone to the storage zone. A frame transfer was followed by a new integration period in the imaging zone, while the store zone was read out.
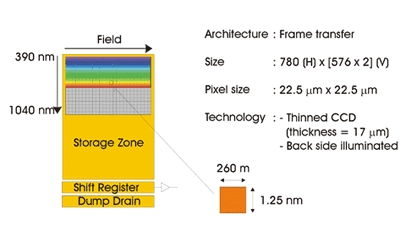
The programmed spectral width was obtained by summing the necessary number of CCD lines in the shift register. This process was termed spectral relaxation. The CCD lines which fall outside the 15 selected spectral bands were dumped at shift register level.
The width and position of the MERIS spectral bands were able to be modified in-flight by programming the CCD. Apart from allowing the selection of different sets of spectral bands during the mission, the CCD programming also served the purpose compensating for any spectral drift occurring during launch or in flight.
MERIS Video Electronic Unit
Each camera had a dedicated image processing chain. The analogue processing was undertaken by the Video Electronic Unit, which had the functions:
- To extract the useful signal in 15 selected bands
- To compensate the offset variation by using the dark reference pixels
- To amplify the signal
- To digitise the video signal on 12 bits
The signal amplification was done by selecting one of the 12 fixed gains defined in the range 1 to 3.75. The selection of the amplification gain was done separately for each spectral bands. Thus the saturation level of any band could be optimised for the purpose of the band. For instance a spectral band used only for ocean applications could saturate over clouds, leaving the full 12 bit digitisation for the useful dynamic range.
MERIS Digital Processing Unit
The digital output of the Video Electronic Unit was subsequently processed by the Digital Processing Unit in three major steps:
- Complete the spectral relaxation up to the required bandwidth
- Subtract the offset components and correct the gains in full processed mode
- Reduce the spatial resolution of the data to 1200 m for the global mission
Offset and gain correction were based on coefficients computed during the calibration sequences. These coefficients were stored on board as well as sent to the ground. The instrument design offered the flexibility to have these corrections applied either on board or on ground. In the latter case offset, smear and gain correction are bypassed in the on board processing flow.
Instrument model philosophy
The MERIS instrument development philosophy was based on a three-model approach:
- The structural model (StM)
- The engineering model (EM)
- The flight model (FM)
The objectives of the StM were mainly the qualification of the instrument structure and the verification of dynamic behaviour.
The EM was used for a pre-qualification of the instrument design. The model would, among others:
- Verified the instrument performances (limited to one camera)
- Verified the internal and external interfaces
- Verified EMC compatibility
- Qualified the functional operation aspects including the software and hardware/software compatibility
- Qualified the instrument thermal control
- Validated all GSE
The FM underwent a full acceptance test programme.
All three models were deliverables for integration on the Polar Platform.
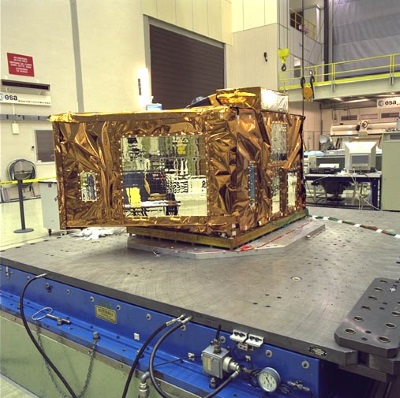
MERIS Hardware
After delivery, the structural model was successfully tested at both instrument level and platform level.
The engineering model then successfully passed the environmental and performance tests. More specifically, the thermal balance test demonstrated that the cooling of the CCD detectors could be achieved with a high stability (better than 0.1°), therefore ensuring reliability of the data through the orbital phases. MERIS EM then underwent complete electromagnetic tests.
The engineering model was then mounted on the payload equipment bay of the Polar Platform engineering model at Matra Marconi Space, Bristol.
Thereafter, the MERIS Flight Model was mounted and tested.
Sensor Modes
For MERIS, the Instrument Modes were divided into two categories: Operation modes and Support modes. Operation modes were those used by the instrument during nominal operations. Support modes were used in order to maintain the instrument in full operational condition.
Operation Modes were: Auxiliary, Calibration and Measurement
Support Modes were: Launch, Off, Reset/Wait, Standby, Standby/Refuse, Heater and Heater/Refuse
Measurement Modes
Of the Operation Modes, the two Measurement Modes (Averaging or Direct & Averaging) outlined above were used for routine acquisition:
- DIRECT & AVERAGING (D and A) Mode, was regarded as the nominal mode for MERIS, whereby data was acquired at 300M Full Resolution (FR) and created 1200 m resolution data (RR) by internal averaging, although not all the resulting FR data could be transmitted to ground due to lack of bandpass.
- AVERAGING (A) mode, intended to generate Reduced Resolution (RR) data only, consequently FR data was lost, neither transmitted directly nor recorded on-board on the instrument. Therefore A could be considered as a degraded data and should be used ONLY for the convergence of the OCL. Likewise, such data should not be processed.
Calibration Modes
During operations, MERIS underwent Radiometric (RAC) and Wavelength (WV) Calibrations. The radiometric calibration of MERIS was performed at the orbital South Pole, and used one or both Spectralon Diffuser plates that were mounted on a selection disk:
- Radiometric Calibration (RAC) measurements occurred every two weeks (using Diffuser 1)
- Diffuser Ageing Calibration (DAC) monitoring occurred every three months (using Diffuser 1 and Diffuser 2 on successive orbits)
For the majority of its operational lifetime time MERIS remained in operational mode. However, there were occasions were MERIS was required to be in the other support roles;
- Orbit Control Manoeuvres (OCM) where MERIS should‘ve been commanded to HEATER/OFF mode, however MERIS was left acquiring during most OCMs. As a result such data was then discarded from the catalogue because of non-nominal pointing indicated the data to be of bad quality and should be made unavailable for users.
- Wavelength calibrations (WV1, WV2) where MERIS was commanded to STABILISATION mode.
Note: Due to the nature of the calibration, products acquired from these orbits were not made available to the User community. - Spectral Campaigns (requiring non-nominal programming of MERIS)
Mission Operations
MERIS was the first imaging spectrometer mission with a primary objective for ocean and coastal water colour remote sensing. It was very successful and highlights of it's data and images were presented at events such as the ESA Living Planet Symposium held in Edinburgh, UK, in 2013. View symposium programme.
MERIS operations were very stable with very few unavailability periods provided data with great consistency during it's lifetime. The data was made available in Near Real-Time (NRT) from a rolling archive and through the MERCI online catalogue system. Four major reprocessing campaigns took place.
Major events in MERIS operations included:
- First data availability May 2002
- Envisat Calibration Workshop on 9 September 2002
- Re-Programming of band 11 (761nm, oxygen absorption band) in December 2002 in order to optimise the cloud top pressure retrieval
- Turning-off the offset control loop (OCL) on 13 December 2004, leading to an unexpected increase of low level noise. The OCL was turned on again on 9 October 2006. A correction of the data acquired during the OCL-off period was introduced in the 3rd reprocessing which was released in July 2011.
Reprocessing campaigns:
- 2004: First reprocessing; applied to the Reduced Resolution data of the year 2003
- 2005: Second reprocessing: reprocessing of the Reduced Resolution mission archive from 2002 - present (2005)
- 2011: Third reprocessing: reprocessing of the Reduced Resolution mission archive from 2002 - present (2011)
- 2014: First bulk reprocessing of the complete Full Resolution Full Mission archive. Same processor configuration as 3rd RR reprocessing.
- 2020: Fourth reprocessing: reprocessing of the Reduced Resolution full mission archive from 2002 – last data take (2012)
- 2020: Second reprocessing of the complete Full Resolution Full Mission archive. Same processor configuration as 4th RR reprocessing
Download the tables of major events of the instruments operations
Unavailabilities due to spectral campaigns requiring temporal reprogramming of MERIS
During the mission lifetime, MERIS was reprogrammed to replicate some existing instruments or planned ones for calibration/validation or investigation purposes.in order to provide the Ground Segment with an understanding of the potential capabilities of a future instrument – such as CHRIS/PROBA or Sentinel-3 - MERIS was reprogrammed to replicate the wavelengths and bandwidths of these instruments. This resulted in the instrument being sometimes unavailable for routine acquisition, and thus no data being acquired.