MERIS Applications
The MERIS instrument on board Envisat mainly supported ocean, atmosphere and land applications.
Oceans
The ocean exerts a major influence on the Earth's meteorology and climate through its interaction with the atmosphere. Understanding the transfer of moisture and energy between ocean and atmosphere is therefore a scientific priority. Better observations are needed, to improve the accuracy of weather forecasts of marine conditions and the assessment of climatic change.
Earth observation satellites have revolutionised the study of the ocean. They now provide detailed repetitive measurements over remote areas of the world, where previously there were only a limited number of (isolated) observations from ships and buoys. Microwave instruments, including SARs and radar altimeters, have a remarkable sensitivity to the roughness and height of the ocean surface, enabling the detection of ocean currents, fronts and internal waves, oil slicks and ships, as well as accurate measurement of sea level changes, wave height and wind speed. Optical instruments provide measurements of ocean colour and temperature, which are important indicators of phytoplankton, yellow substance and suspended sediments.
Envisat, by including advanced SAR, radar altimeter, ocean colour and ocean temperature instruments together on the same platform, offered opportunities for synergetic measurements over the oceans. It provided an improvement in measurement capability compared with ERS, and together the missions offered many new geophysical measurements. The simultaneous recording of MERIS ocean colour measurements with both AATSR sea surface temperature, and ASAR sea surface roughness particularly offered a new opportunity in this field.
Ocean Biophysical Properties
There remain major uncertainties about the amount of carbon stored in the ocean and the biosphere, and about the fluxes between these reservoirs and the atmosphere. In particular, there is an important need for better information on the spatial distribution of biological activity in the upper ocean and its temporal variability, especially in the case of oceanic phytoplankton biomass, which has an important role in fixing CO2 through photosynthesis. In the upper layers of the open ocean, chlorophyll concentration is the most convenient index for phytoplankton abundance and this can be measured using the visible part of the spectrum.
"The remote measurement which has caused the greatest interest within the JGOFS (Joint Global Ocean Flux Study) is the estimation of basin and global-scale variability in the concentration of chlorophyll in the upper ocean. The images of the global distribution of these pigments, derived from data taken by the Coastal Zone Colour Scanner (CZCS) onboard the United States' Nimbus-7 spacecraft, have revolutionised the way biological oceanographers view the oceans. For the first time, the blooming of the ocean basins in spring was observed, as was the extent of the enriched areas associated with the coastal ocean." (International Geosphere-Biosphere Programme [IGBP] A study of Global Change, Report No. 12, 1990).
Although CZCS, launched in 1978, was intended as a one-year proof-of-concept mission, the sensor continued to transmit data over selected oceanic test sites until early 1986. The figures in this section show examples of CZCS chlorophyll maps of the Earth and the Mediterranean Sea.
Remotely sensed information about global ocean colour is also available from the OCTS and POLDER instrument on the Japanese ADEOS mission, from the NASA SeaWIFS satellite launched in August 1997, and from the MOS instrument on IRS-3. MERIS provided data continuity with improved spectral and spatial performance. This resulted from the use of several near-infrared channels to perform atmospheric corrections, and several narrow visible channels to compute radiance values.
Phytoplankton abundance varies from less than 0.03 mg m-3 in oligotrophic waters (i.e., waters poor in nutrients and therefore in phytoplankton), up to about 30 mg m-3 in eutrophic waters (i.e., in nutrient rich waters, supporting high biomass). Ocean colour responds in a nonlinear way to these large changes in chlorophyll content. It is conveniently depicted by the ratio of blue-to-green radiation backscattered by the ocean, with the ratio that is most sensitive based on wavelengths of 445 and 565 nm. It varies within a range of 1 to 20 for the types of pigments considered, and decreases, almost linearly, with the logarithm of the concentration.
Coastal Waters
The coastal regions are the most populated areas in the world and coastal waters are highly affected by human activities. These marine ecosystems are subject to bio-geochemical forcing, due to the influx of large amounts of agricultural and industrial pollutants and sewage from rivers which inhibit or stimulate marine productivity.
Continuous long-term observations of coastal waters, which cover more than three million square kilometres, is most important for regional climate impact studies and for environmental monitoring. Remote sensing measurements from satellite are the only available means of monitoring such large areas of water.
The major water constituents, which determine the marine and estuarine ecology and the bio-geochemical budget and whose concentration and distribution can be determined by optical remote sensing, are suspended matter, phytoplankton and Gelbstoff.
Suspended matter is defined as a combination of:
- inorganic particles and detritus, present due to re-sedimentation and advection processes
- atmospheric inputs
- dead material of plankton
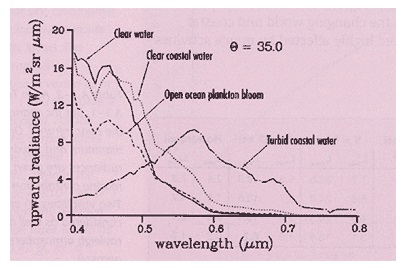
Gelbstoff consists of various polymerised dissolved organic molecules which are formed by the degradation products of organisms. These originate in brackish and underground water as well as in extraordinary plankton blooms. All these constituents have different optical properties, but there are similarities in their spectral scattering and absorption coefficients.
The upward radiance at any visible wavelength is composed of contributions from all these substances. The graph shows simulated multispectral radiances for a spectral resolution of 5 nm just above the water surface for different ocean waters. Suspended matter usually enhances the upward radiances through reflection within the visible spectrum, while Gelbstoff reduces these radiances mainly in the blue.
To convert from the optical properties of the water constituents, used in the radiative transfer model, to pigment or suspended matter concentration units, robust algorithms have been developed with global applicability. The accuracy of derived oceanic properties depends strongly on the precision of the atmospheric correction procedure.
The development of inverse modelling techniques for the interpretation of MERIS measurements is an ongoing process. For monitoring coastal regions world wide, precise multispectral radiances, with contemporary optical and concentration measurements of the water constituents, are needed. As well as the chlorophyll concentration and several atmospheric parameters, planned geophysical products include total suspended matter and yellow substance concentration.
Atmosphere
Satellite remote sensing provides a unique way of monitoring the complex and dynamic processes that occur in the atmosphere. Since the future of the human race is critically dependent on the long term variability of the atmosphere, great efforts are being made to understand the many processes involved. In response to this, researchers develop models of the atmosphere as a mechanism whereby chemical reactions and physical changes in the atmosphere can be placed in context within the overall Earth system.
Such models require large amounts of data describing the spatial and temporal variability of the Earth's atmosphere at different locations and altitudes around the globe, taking account of diurnal, seasonal and longer-term cycles. Sources, reservoirs and sinks of critical trace gases all need to be described. Satellite remote sensing provides a powerful set of techniques for acquiring these data to sustain models of the atmosphere, especially where information is required on a global scale and within a short time span.
Atmosphere Constituents
Many of the factors affecting the global environment are related to changes in the chemical composition of the atmosphere. The results of these changes include: the enhanced greenhouse effect, increase in the levels of ultraviolet-B radiation reaching the Earth's surface, acidification and reduced transparency. The atmosphere is very dynamic, both in terms of chemical composition and associated radiative properties, and also in the way it transports materials around the globe, providing a link between land and ocean. The key role of the atmosphere in the maintenance of the Earth's environment emphasises the need to conduct research, to understand properly the processes involved and to monitor long-term changes.
As a result of man's activities, which have become progressively more significant over the last century, large quantities of carbon, chlorine, nitrogen and sulphur compounds have been injected into the atmosphere and are disrupting the natural equilibrium which had become established. Whilst long-term change has always been a feature of the atmosphere, it has become apparent that it is the increased rate of change, brought about by man's activities, which is having such a potentially detrimental effect on the Earth's system.
The reduction in stratospheric ozone concentrations over Europe since 1960 is the direct result of the use of ozone depleting chemicals such as refrigerants, industrial cleaners, foaming agents and those in fire extinguishers. Conversely, pollution at the Earth's surface has led to increased levels of tropospheric ozone, particularly over industrial areas, with consequent threats to human health. No other chemical in the troposphere has a concentration which is so close to being toxic.
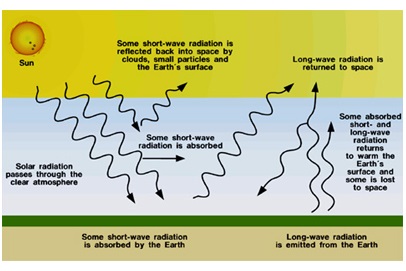
The greenhouse effect, shown in this image, involves the warming of the troposphere by increasing concentrations of the so-called greenhouse gases (carbon dioxide, methane, nitrous oxide, ozone and others). This warming occurs because the greenhouse gases are transparent to incoming solar radiation, but absorb infrared radiation from the Earth that would otherwise escape from the atmosphere into space. The greenhouse gases then re-radiate some of this heat back towards the surface of the Earth. The rise in carbon dioxide as a result of industrialisation is primarily responsible for the enhanced greenhouse gas effect. Current carbon dioxide levels are more than double pre-industrial levels and are the focus of international efforts to reduce emissions and offset the consequences of changed climate patterns, sea level rise, effects on hydrology, threats to ecosystems and land degradation.
Many studies of the effect of greenhouse gases on the climate have and are being carried out. An effective doubling of carbon dioxide concentrations is now predicted for 2030, which is expected to produce an estimated temperature rise of between 1.5° and 4.5°C, but with considerable variations in the rate of warming in different regions. The situation is highly complex due to mechanisms whereby, for example, an increase of sulphur dioxide in the atmosphere, through industrialisation, reduces the greenhouse effect because of an increase in the atmosphere's reflectivity.
While predictions continue to be refined, the overall objective remains as that set out in Article 2 of the United Nations Framework Convention on Climate Change (UNFCCC), which calls for the stabilisation of greenhouse gas concentrations at a level that prevents dangerous anthropogenic interference with the climate system, and in a time frame that allows ecosystems to adapt naturally.
The amount of water vapour in the atmosphere is an important component of the Earth's climate system. It varies considerably in response to variations in temperature and relative humidity and acts as an energy carrier, redistributing energy around the planet. Water vapour has a large radiative effect and is the most important greenhouse gas. Water, in the form of clouds, liquid or ice, modifies the radiation reaching the surface and thereby strongly influences the surface energy flux. The role of clouds in the climate system is poorly understood and this undermines the overall validity of modelling and prediction activities. Research into the influence of water vapour and clouds is needed in order that anthropogenic effects can be isolated from long-term natural climate variations. MERIS contributed to this field by providing the column water vapour content over land, oceans, and clouds.
Aerosols
There is evidence to suggest that in recent decades there have been long-term changes in aerosol loading in the stratosphere. For example, amounts of sulphate aerosol in the stratosphere increased significantly in 1991 and 1992 as a result of the 1991 eruption of Mount Pinatubo. GOME data from ERS was analysed to produce estimates of SO2 loading of the atmosphere; for example, from the eruption of the Nyamuragira volcano in Zaire. Whilst there is a good relationship between the degree of aerosol loading and volcanic events, an upward trend has been detected in background levels.
The impact of aerosols on the Earth's radiation budget is both direct, through scattering and absorption, and indirect, through the modification of cloud properties. In both cases, aerosols in the stratosphere seem to have a cooling effect with regard to the Earth's radiation budget. Sulphate aerosol loading in the mid-latitudes has also been correlated with ozone trends in mid-latitude and polar regions, through a modification of the concentration of gases involved in ozone depletion. However, the extent to which aerosols influence the Earth's climate has been difficult to assess since aerosols vary a great deal in terms of size, shape and chemical composition. Satellite-borne sensors have the potential to improve knowledge of the origin, dynamics and fate of aerosols, through their ability to monitor the whole globe within very short data capture repeat cycles. Critical to the determination of aerosol types is the wavelength dependence of extinction coefficients in the visible and near infrared parts of the spectrum.
The use of spaceborne instruments to measure aerosols in the stratosphere is well established. The SAGE (Stratospheric Aerosol and Gas Experiment) series of instruments demonstrated the concept and shared features with the atmosphere sensors onboard Envisat; with GOMOS in particular. Several of the instruments onboard Envisat were capable of making aerosol measurements with sufficient spectral coverage to determine size distribution and composition. GOMOS and MIPAS observed the distribution and structure of the stratospheric aerosol layers. Moreover, the ability of MIPAS to acquire data perpendicularly to its flight direction strengthened its ability to record aerosol injections into the stratosphere from volcanic eruptions. SCIAMACHY provided further information about aerosols through its ability to make polarisation measurements, and its large spectral coverage. MERIS evaluated tropospheric aerosol properties including optical thickness and type.
Earth Radiation Budget
Processes in the atmosphere which alter the Earth's radiation budget need to be better understood. To achieve this, it is necessary to monitor certain trace gases and other constituents such as aerosols, whose temporal changes affect the Earth's climate by modifying radiative transfer. Long-term global measurements will improve current assessments of changes in the abundance of ClOX, HOX, and NOX which are associated with decreases in stratospheric temperatures through their impact on radiative transfer in the atmosphere. Observations on the extent of radiative cooling of the atmosphere can be obtained from measurements of CO2 and NO in the middle atmosphere.
Of particular interest, in the context of the "greenhouse effect", is the transportation of water vapour from the surface of the Earth into the free troposphere. While climate models have suggested that this is a phenomenon associated with global warming, there is no firm evidence suggesting that the free troposphere is becoming more moist and therefore providing the positive feedback necessary to stimulate global warming to the levels being suggested. In terms of radiation budget, water vapour is the most important atmospheric gas in the context of cloud amount, precipitation and evaporation rates. Even small changes in global measurements of cloud albedo will have a significant effect on the Earth's radiation budget.
MERIS contributed to this work by providing information on cloud amount, cloud top height, cloud optical thickness, water vapour and cloud albedo, as well as the aerosol information discussed above. Cloud coverage and other parameters, including water/ice discrimination and particle size distribution, are also available from the visible channels on AATSR. The MWR also produced total column measurements of water vapour and liquid water.
Land
The Earth's land surface is a critical component of the Earth system as it carries over 99% of the biosphere. It is the location of most human activity and it is therefore on land that the human impact on the Earth is most visible. Within the biosphere, vegetation is critical as it supports the bulk of human and animal life and largely controls the exchanges of water and carbon between the land and the atmosphere.
Observations of the land surface by Envisat enabled the characterisation and measurement of vegetation parameters, surface water and soil moisture, surface temperature, elevation and topography. Global scale measurements (1 km resolution) provided critical data sets for improved climate models, in particular estimates of albedo, vegetation productivity and land surface fluxes.
Envisat also provided managers of local natural resources with a capability to monitor their land with detailed (selective) observations on a monthly basis. In particular, ASAR provided 30 m spatial resolution multi-look images for monitoring economically important land units, such as agricultural fields and forest compartments. Natural resources were also monitored at global and regional scales every few days using the low-resolution imaging of MERIS, AATSR and the ASAR Global Mode.
The relatively high frequency of global coverage provided by Envisat was also of great value for hazard monitoring, in which locally infrequent events such as earthquakes, volcanic eruptions, floods and fires, require intensive observation over short periods. The beam steering mode of ASAR (in conjunction with its independence from cloud and illumination conditions) also permitted (at least) 3-day repeat observation of certain localised events at high spatial resolution. Although locally rare, certain natural hazards are frequent events on a global scale, thus they can have substantial effects on climate, especially large vegetation fires and volcanic dust clouds. Hazard monitoring was therefore an important component of the Envisat mission.
Global Land Cover
A major scientific uncertainty in global change research is the cycling of carbon in the Earth system. It is well known that CO2 contributes to the greenhouse effect and that over the last few centuries increased human activity, especially the burning of fossil fuels and deforestation, have resulted in an increase in the release of CO2 into the upper atmosphere. Much of the estimated anthropogenic CO2 emission cannot currently be accounted for, indeed there is an order of magnitude uncertainty in the global carbon budget.
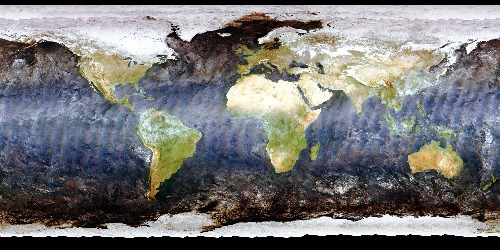
Critical to this carbon accounting activity is global vegetation monitoring. The figures below show a global land cover product, and a forest map of Southeast Asia, both derived from 1 km AVHRR data, The narrow bands of MERIS made it possible to derive more accurate global maps and more effective vegetation indices than were previously available. From physically based vegetation indices, it is then possible to retrieve key variables in modelling plant productivity (and thus carbon sequestration), surface-atmosphere gas exchanges and energy transfers at the land surface.
For practical reasons (e.g., obtaining sufficient cloud-free coverage on a seasonal basis), global vegetation monitoring is based on low resolution (1 km) data. However, vegetation products (such as land cover, leaf-area index and biomass) at this resolution cannot be validated directly and this is usually done by scaling up data collected at higher resolution on a sample site basis. The availability of contemporary data sets at resolutions of 1000 m from AATSR, 300 m from MERIS and 30 m from ASAR, was thus of key importance in producing and validating global vegetation products.
Agriculture
The control of subsidies at the field level using satellite remote sensing has become an operational activity in Europe. Inventory and estimation of agricultural yields at a national and international level has not been so widely used, but is becoming more operational, particularly in developing countries. ASAR provided important data for this, with supporting products also coming from MERIS and AATSR.
The ERS programme demonstrated the ability of satellite radars, independent of weather conditions, to identify crops and monitor seasonal land cover changes. Multi-temporal techniques are used, which involve the collection and analysis of SAR data on a series of different dates over the period of interest.
The image below shows a sequence of 9 ERS-1 SAR images (each 3.75 km x 3.75 km) taken over the crop growing season (January to November 1993) in Flevoland, The Netherlands. The chart shows the corresponding backscatter temporal profiles for the three winter wheat fields highlighted (Credit: M. Borgeaud, ESTEC). Research carried out with ERS data showed that many crop types have distinctive temporal profiles which can be used successfully for crop classification purposes. ERS data were used operationally within major European programmes concerned with agricultural statistics (MARS STAT) and the control of agricultural subsidies (MARS CAP). Within MARS STAT the use of ERS data improved the estimation of crop area early in the crop growing season. ERS data were used as a substitute for optical data in the MARS CAP control activity when cloudy conditions are encountered at key times during the crop growing season.
Mapping the area of crops, for the policing of subsidies and crop area inventories, continued as a primary application supported by Envisat. However, yield estimation techniques also improved through the availability of Envisat data. Regional yield estimation was previously accomplished by exploiting the temporal curve of vegetation response obtained from satellite borne instruments such as AVHRR which have low spatial resolution but frequent revisit capability. This information is compared with previous years and combined with meteorological data and crop growth modelling to predict year-on-year yield variations.
MERIS improved the quality of the spectral information compared to AVHRR, as its spectral bands were narrower and less sensitive to atmospheric effects. MERIS calibration and atmospheric correction was also more accurate than AVHRR, and the spatial resolution was improved while still providing regional revisit every three days. Although the VIS/NIR bands on AATSR are broad, the superior atmospheric correction capability and multi-angle view assisted in improving estimates of bidirectional reflectance distribution functions for crop growth modelling.
Hydrology
Hydrology in particular benefited from Envisat, as detailed spatial and temporal information on a wide range of land surface parameters is required in order to run physically based models and management scenarios. Major variables derived from Envisat observations included land surface temperature, vegetation state, soil moisture, surface roughness, and terrain. Much hydrological modelling is based on gridded data at around 1 km. Because of its narrower bands and improved radiometry, MERIS had the potential to provide better vegetation parameters for hydrology than other instruments such as AVHRR. Some hydrological applications require information on snow cover distribution and snow-water equivalent.
Forestry
Forestry information is important as an aid to formulating land use, forest and environment policy, for long-term regional, national and local planning, and for the assessment and monitoring of natural resources, ecosystems and the environment. The qualitative information requirements include vegetation and forest type, species composition, vigour and health, as well as site conditions. The quantitative requirements include area, volume, age and density of forest stands as well as growth forecasts for sustained production. For large parts of the world, and specifically in developing countries, forest maps and statistics are outdated, unreliable, or sometimes nonexistent. For regional inventories, available national maps and statistics are difficult to compare.
Global and regional forest inventory for change detection, particularly of tropical forests is an important aspect of global vegetation mapping to which ASAR, AATSR and MERIS provided improved capabilities.