- All Categories (41)
- Data (12)
- News (10)
- Missions (3)
- Events (11)
- Tools (2)
- Campaigns (1)
- Documents (2)
Mission - Heritage Missions
MOS-1/1B
MOS-1 and 1B, Japan’s first marine observation satellites, were designed to monitor ocean currents, sea surface temperature, atmospheric water vapour, ocean chlorophyll levels, precipitation, and land vegetation.
Data - Data Description
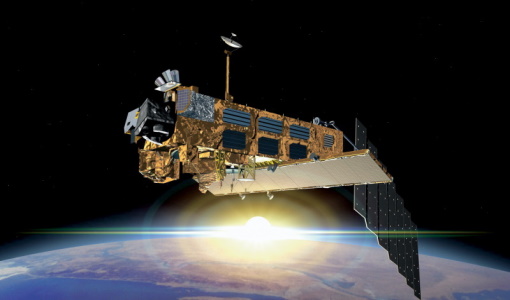
Envisat AATSR L1B Brightness Temperature/Radiance [ENV_AT_1_RBT]
- AATSR Full Resolution land and ocean cover image of the Iberian Peninsula from 28 October 2006 AATSR Full Resolution land cover image of the Iberian Peninsula from 28 October 2006. The Envisat AATSR Level 1B Brightness Temperature/Radiance product (RBT) contains top of atmosphere (TOA) brightness temperature (BT) values for the infra-red channels and radiance values for the visible channels, on a 1-km pixel grid. Values for each channel and for the nadir and oblique views occupy separate NetCDF files within the Sentinel-SAFE format, along with associated uncertainty estimates. Additional files contain cloud flags, land and water masks, and confidence flags for each image pixel, as well as instrument and ancillary meteorological information. This AATSR product [ENV_AT_1_RBT] in NetCDF format stemming from the 4th AATSR reprocessing, is a continuation of ERS ATSR data and a precursor of Sentinel-3 SLSTR data. It has replaced the former L1B product [ATS_TOA_1P] in Envisat format from the 3rd reprocessing. Users with Envisat-format products are recommended to move to the new Sentinel-SAFE like/NetCDF format products. The 4th reprocessing of Envisat AATSR data was completed in 2022; the processing updates that have been put in place and the expected scientific improvements have been outlined in full in the User Documentation for (A)ATSR 4th Reprocessing Products.
News - Success Stories
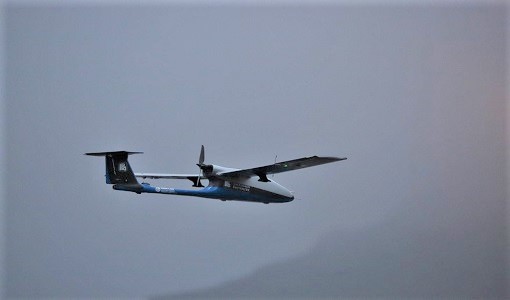
Drones join the campaign to validate Aeolus data
In June and September 2022, the Askos component of the Joint Aeolus Tropical Atlantic Campaign (JATAC), organised by ESA and its international partners, was expanded with new ground-based, drone and radiosonde measurements. The main objective of this campaign was to calibrate and validate Aeolus satellite observations.
News - Success Stories
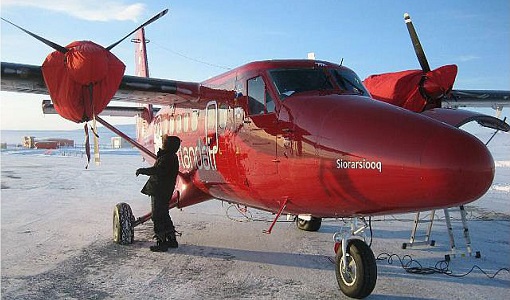
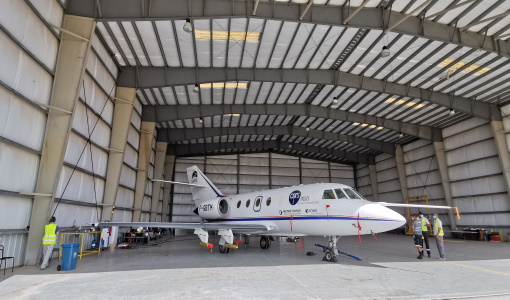
Robust airborne radar instrument aids CryoSat ice data
During the 12 years that ESA’s ice mission – CryoSat – has been monitoring Earth’s ice masses from space, simultaneous airborne measurements were made by ASIRAS.
Event - Training

EO Summer School 6
ESA's series of summer schools, on Monitoring of the Earth System, aims to promote the exploitation of Earth observation data.
Event - Training
EO Summer School 5
ESA's series of summer schools, on Monitoring of the Earth System, aims to promote the exploitation of Earth observation data.
Event - Training
EO Summer School 3
ESA's series of summer schools, on Monitoring of the Earth System, aims to promote the exploitation of Earth observation data.
News - Thematic area articles
Space data help to unravel the complexities of Earth’s atmosphere
As the impacts of the climate crisis intensify, scientists are using ESA’s Earth observation archives to investigate atmospheric processes and their influences on the planet’s changing environment.
News - Events and Proceedings
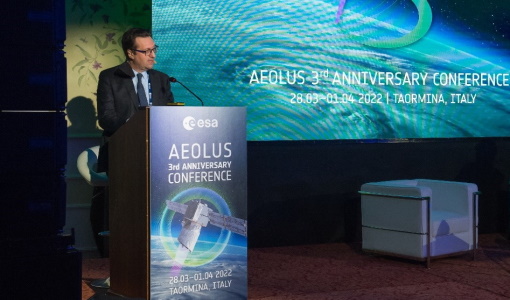
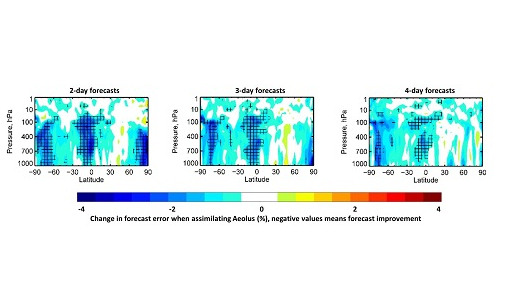
Exploring the prevailing achievements and future directions of Aeolus
A tight-knit community of European remote sensing experts converged on the Italian island of Sicily last month to discuss how the strong success of ESA’s Aeolus mission is shaping scientists’ understanding of the winds that sweep across the planet.
News - Thematic area articles
Satellite data central to ocean monitoring
Over 95% of Earth’s water is found in our oceans, and yet sadly, oceans are under stress from climate change and pollution. Monitoring our oceans is vital for Earth’s survival and satellites are the primary means of long-term and independent observation of our vast ocean bodies and their associated coastal zones.
Tools - Processing
Aeolus VRE
The Aeolus Virtual Research Environment (VRE) is the latest extension to the VirES for Aeolus service, which offers more direct and in-depth data exploitation of the Aeolus mission. The VRE is a cloud service that provides a web-based development environment in the form of a JupyterLab workspace.
News - General News
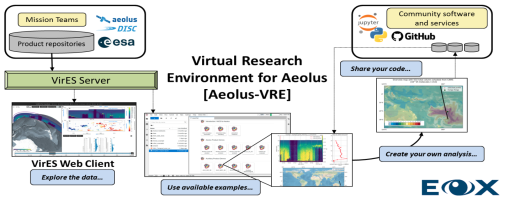
Launch of Aeolus VRE
The Aeolus Virtual Research Environment (VRE) is a cloud service, which provides users with a web-based development environment in the form of a JupyterLab workspace.
News - Success Stories
10 years of Envisat data help to illuminate ocean processes
A decade after Envisat beamed its final image to the planet, the pioneering ESA mission is continuing to foster improved understanding of Earth’s systems.
News - Success Stories
How Envisat helped to shape global understanding of Earth’s systems
Twenty years have passed since a ground-breaking European spacecraft designed to deliver unprecedented insight into the planet’s changing environment was lofted into orbit.
News - Success Stories
Dust aerosol campaign validates Aeolus data
Prepared, implemented and executed by a consortium of French universities and research institutions, under the umbrella of the French Space Agency (CNES) and the French National Centre for Scientific Research (CNRS), the Clouds-Atmospheric Dynamics–Dust Interactions in West Africa (CADDIWA) campaign took place on Sal Island in Cape Verde, from 6 to 25 September 2021.
Event - Workshop

SEASAR 2008
The "Advances in SAR Oceanography from Envisat and ERS missions" was a thematic workshop on SAR remote sensing techniques for oceanography.
Event - Workshop
Space and the Arctic 2009 Workshop
Temperatures in the Arctic are rising at an unprecedented rate. This workshop looked at the needs and challenges of working and living in the rapidly changing Arctic and explore how space-based services might help to meet those needs.
Event - Training
2nd Advanced Training Course on Ocean Remote Sensing 2009
This advanced training course focused on ocean remote sensing theory and applications.
Tools - Processing

SMOS Artificial Scene Library (ASL)
The ASL function allows users to directly use the L1B product version 7 by mimicking the Gibbs-2 image reconstruction correction algorithm as it is implemented in the level 1 operational processor.
Data - Fast Registration with immediate access (Open)
GOSAT-2 TANSO FTS-2 and CAI-2 full archive and new products
The TANSO-FTS-2 (Thermal And Near infrared Sensor for carbon Observation - Fourier Transform Spectrometer-2) instrument is an high-resolution 5-bands (NIR and TIR) spectrometer which allows the observation of reflective and emissive radiative energy from Earth's surface and the atmosphere for the measurement of atmospheric chemistry and greenhouse gases. The TANSO-CAI-2 (Thermal And Near infrared Sensor for carbon Observation - Cloud and Aerosol Imager-2) instrument is a push-broom radiometer in the spectral ranges of ultraviolet (UV), visible (VIS), Near Infrared (NIR) and SWIR (5 bands observe in the forward direction and 5 in backwards direction, with LOS tilted of 20 degrees) for the observation of aerosols and clouds optical properties and for monitoring of air pollution. The GOSAT-2 available products are: FTS-2 Level 1A products contain interferogram data observed by FTS-2, together with geometric information of observation points and various telemetry. In addition, data from an optical camera (CAM) near the observation time are also stored. Two different products for day and night observations. Common data contain common information for SWIR/TIR including CAM data; SWIR data contain information from SWIR band; TIR data contain information from TIR band FTS-2 level 1B products contain spectrum data, which are generated by Fourier transformation and other corrections to raw interferogram data in L1A. The sampled CAM data near the observation time are also stored. Two different products for day and night observations. Common data contain common information for SWIR/TIR including CAM data; SWIR products for SWIR spectrum data before and after sensitivity correction; TIR products for TIR spectrum data after sensitivity correction using blackbody and deep space calibration data and after correction of finite field of view FTS-2 NearRealTime products: FTS-2 data are first processed with predicted orbit file and made immediately available: NRT product does not include monitor camera image, best-estimate pointing-location, and target point classification but is available on the ESA server 5 hours after sensing. After a few days (usually 3 days), data is reprocessed with definitive orbit file and sent as consolidated product FTS-2 Level 2 products: Column-averaged Dry-air Mole Fraction" products store column-averaged dry-air mole fraction of atmospheric gases retrieved by using Band 1-3 spectral radiance data in TANSO-FTS-2 L1B; "Chlorophyll Fluorescence and Proxy Method (FTS-2_02_SWPR)" products store solar induced chlorophyll fluorescence data retrieved from Band 1 spectral radiance data in L1B Product as well as column-averaged dry-air mole fraction of atmospheric gases retrieved from Band 2 and 3 spectral radiance data in L1B Product. Both products are obtained by using the fill-physic maximum a posteriori (MAP) method and under the assumption of of clear-sky condition CAI-2 Level 1A products contain uncorrected image data of TANSO-CAI-2, which is stored as digital number together with telemetry of geometric information at observation point, orbit and attitude data, temperature, etc. One scene is defined as a satellite revolution data starting from ascending node to the next ascending node. Common data contain common information for both Forward looking and Backward looking; FWD products contain information for Forward looking bands, from 1 to 5; BWD products contain information for Backward looking bands, from 6 to 10 CAI-2 Level 1B products contain spectral radiance data per pixel converted from TANSO-CAI-2 L1A Products. Band-to-band registration of each forward- and backward- viewing band is applied; ortho-correction is performed to observation location data based on an earth ellipsoid model using digital elevation model data CAI-2 Level 2 products: Cloud Discrimination Products stores clear-sky confidence levels per pixel, which are calculated by combining the results of threshold tests for multiple features such as reflectance ratio and Normalized Difference Vegetation Index (NDVI), obtained from spectral radiance data in GOSAT-2 TANSO-CAI-2 L1B Product. This product also stores cloud status bit data, in which results of individual threshold tests and quality flags are summarized. The full ESA archive and newly acquired/systematically processed GOSAT2 FTS-2 and CAI-2 products are (ESA collection name versus JAXA product name): FTS-2 L1A Common day (FTS-2_1A_COMMON_DAY) FTS-2 L1A Common night (FTS-2_1A_COMMON_NIGHT) FTS-2 L1A SWIR day (FTS-2_1A_SWIR_DAY) FTS-2 L1A TIR day (FTS-2_1A_TIR_DAY) FTS-2 L1A TIR night (FTS-2_1A_TIR_NIGHT) FTS-2 L1B Common day (FTS-2_1B_COMMON_DAY) FTS-2 L1B Common night (FTS-2_1B_COMMON_NIGHT) FTS-2 L1B SWIR day (FTS-2_1B_SWIR_DAY) FTS-2 L1B TIR day (FTS-2_1B_TIR_DAY) FTS-2 L1B TIR night (FTS-2_1B_TIR_NIGHT) FTS-2 L2 Column-averaged Dry-air Mole Fraction (FTS-2_0) FTS-2 L2 Chlorophyll Fluorescence and Proxy Method (FTS-2_02_SWPR) CAI-2 L1A Common (CAI-2_1A_COMMON) CAI-2 L1A Forward viewing (CAI-2_1A_FWD) CAI-2 L1A Backward viewing (CAI-2_1A_BWD) CAI-2 L1B (CAI-2_1B).