- All Categories (94)
- Data (21)
- News (42)
- Missions (8)
- Events (11)
- Tools (3)
- Activities (3)
- Campaigns (2)
- Documents (4)
DATA
Discover and download the Earth observation data you need from the broad catalogue of missions the European Space Agency operate and support.
Data - Fast Registration with immediate access (Open)
TanSat AGCS and CAPI products
The Atmospheric Carbon-dioxide Grating Spectrometer (ACGS) instrument is pushbroom spectrometer operating in NIR and SWIR bands which allows the measuring of CO2 mole fraction. The available ACGS products have a temporal coverage between March 2017 and January 2020 (not all days included in the time frame): L1A DS: Sample Dark Calibration sample product L1A GL: Sample Glint Sample products L1A LS: Sample Lamp Calibration sample product L1A ND: Principal-Plane Nadir Sample product L1A ZS: Sample Z-Axis Solar Calibration Sample L1B CAL DS: Sample Dark Calibration product L1B CAL LS: Sample Lamp Calibration product L1B CAL ZS: Sample Z-Axis Solar Calibration product L1B SCI GL: Sample Glint Science product L1B SCI ND: Principal-Plane Nadir Science product. The Cloud Aerosol Polarization Imager (CAPI) is a pushbroom radiometer in VIS, NIR and SWIR bands for the observation of aerosols and clouds optical properties. The CAPI products are available in a time range from July 2019 and January 2020 (not all days included in the time frame): L1A ND: Principal-Plane Nadir product L1B ND 1000M: Principal-Plane Nadir products at 1000 m resolution (1375 nm, 1640 nm) L1B ND 250M: Principal-Plane Nadir products at 250 m resolution (380 nm, 670 nm, 870 nm) L1B ND GEOQK: Principal-Plane Nadir georeferenced at 250 m resolution L1B ND GEO1K: Principal-Plane Nadir georeferenced at 1000 m resolution L1B ND OBC: Principal-Plane Nadir on-board calibrator product L2 ND CLM: Principal-Plane Nadir cloud flag product.
Data - Data Description
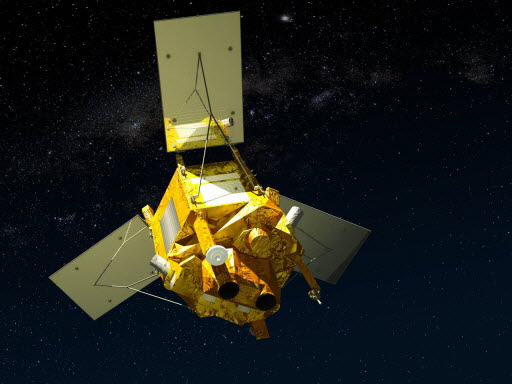
Aeolus Level 2C assisted wind fields resulting from NWP (Numerical Weather Prediction) assimilation processing
The Level 2C wind product of the Aeolus mission provides ECMWF analysis horizontal wind vectors at the geolocations of assimilated L2B HLOS wind components. The L2C can therefore be described as an Aeolus-assisted horizontal wind vector product. The L2C is a distinct product, however the L2C and L2B share a common Earth Explorer file template, with the L2C being a superset of the L2B. The L2C consists of extra datasets appended to the L2B product with information which are relevant to the data assimilation of the L2B winds.
Data - EO Sign In Authentication (Open)
Aeolus L2A Aerosol/Cloud optical product
The Level 2A aerosol/cloud optical products of the Aeolus mission include: Geo-located consolidated backscatter and extinction profiles Backscatter-to-extinction coefficient LIDAR ratio, scene classification Heterogeneity index Attenuated backscatter signals. Resolution: Horizontal resolution of L2A optical properties at observation scale (~87 km); Exceptions are group properties (horizontal accumulation of measurements from ~3 km to ~87 km) and attenuated backscatters (~3 km). Note: The resolution of "groups" in the L2A can only go down to 5 measurements at the moment, i.e. ~15 km horizontal resolution. This could be configured to go to 1 measurement - Vertical resolution 250-2000 m (Defined by Range Bin Settings).
Data - Project Proposal (Restrained)
GHGSat archive and tasking
GHGSat data produce measures of vertical column densities of greenhouse gas emissions ((currently CH4, but eventually CO2), provided on a pre-defined area of 12 km x 12 km, from the full sensor field-of-view. GHGSat Catalogue and New Collect data are available in three different data types: Single Observation: a single observation of a scene. Monthly Monitoring: guaranteed 12 successful observations in a year over a given site (once per month or flexible best effort cadence depending on weather). Weekly Monitoring: guaranteed 52 successful observations in a year over a given site (once a week or flexible best effort cadence based on weather), to accommodate large & persistent monitoring needs. Data are provided as an Emissions package containing the following products: Abundance dataset (Level 2): Set of per-pixel abundances in excess of the local background (ppb) for a single species, and per-pixel measurement error expressed as a standard deviation for a single site on a single satellite pass. Data format is 16-bit GeoTIFF. Concentration Maps (Level 2): High readability pseudocolour map combining surface reflectance, and column density expressed in ppb for a single species in PNG format. The relevant abundance dataset is provided as well. Emission Rates (Level 4): Instantaneous rate for a detected emission from a targeted source estimated using abundance datasets from a single satellite pass and applying dispersion modelling techniques. The delivered product includes the emission rate estimate with uncertainty and key dispersion parameters (in CSV format) as well as the abundance dataset used for the emission estimate. This product is only delivered in the Emissions package if an emission is detected within the abundance dataset. The Level 2 products will be delivered regardless of whether or not an emission is detected. The properties of available products are summarised in the table. Band(s) / Beam Mode(s) and Polarisation SWIR (1635-1675 nm), multiple bands, unpolarised Spatial Resolution <30 m Scene size 12 km x 12 km Species Measured CH4 Geometric Corrections Radial distortion, perspective projection Radiometric Corrections Detector pixel response, ghosting, spectral response, atmospheric correction including trace gas modelling and surface reflectance Details about the data provision, data access conditions and quota assignment procedure are described in the GHGSat Terms of Applicability.
Data - Project Proposal (Restrained)
SPOT-6 to 7 full archive and tasking
The SPOT 6 and 7 satellites ensure data continuity with the no longer operational SPOT 5 satellite and provide an archive of very high resolution optical acquisition as well as the possibility to task the satellites for new acquisitions. Following the completion of the SPOT 7 mission in March 2023, new acquisition tasking is only available for the SPOT 6 satellite. The ortho-products are automatically generated by the SPOT 6 and 7 ground segment, based on SRTM database or Reference3D when available. The projection available for SPOT 6 and 7 ortho-products is UTM, datum WGS84. Bands combinations: Pansharpened: colour image at 1.5 m resolution Bundle: 1.5 m panchromatic image and 6 m multispectral image. Geometric processing levels: Primary: The Primary product is the processing level closest to the natural image acquired by the sensor. This product restores perfect collection conditions: the sensor is placed in rectilinear geometry, and the image is clear of all radiometric distortion. Standard Ortho: The Ortho product is a georeferenced image in Earth geometry, corrected from acquisition and terrain off-nadir effects. Tailored ortho: Aside from the Standard Ortho product, when different specifications are needed, a custom orthorectification, with a more precise 3D model provided by the client or acquired for the purpose, can be provided on demand. As per ESA policy, very high-resolution imagery of conflict areas cannot be provided.
Data - Project Proposal (Restrained)

Spire live and historical data
The data collected by Spire from it's 110 satellites launched into Low Earth Orbit (LEO) has a diverse range of applications, from analysis of global trade patterns and commodity flows to aircraft routing to weather forecasting. The data also provides interesting research opportunities on topics as varied as ocean currents and GNSS-based planetary boundary layer height. The following products can be requested: ADS-B Data Stream Global ADS-B satellite data observed by Spire satellites and processed through the ground stations network. Historical ADS-B data older than 6 months can be delivered as data cuts containing CSV file(s) accessible through a Web Service or Cloud storage solutions. Live ADS-B data is available through a streaming API, and recent historical data can be accessed through a REST API. Data is distributed as a monthly subscription: historical data can be requested starting from 3 December 2018, the time period for live data starts from a user-defined date and continues for 30 days AIS AIS messages include satellite AIS (S-AIS) as observed by Spire satellites and terrestrial AIS (T-AIS) from third party sensor stations (up to 40 million messages per day). Historical AIS data are delivered as a cvs file with availability back to June 2016 or via Historical API from December 2018; live AIS data are pushed to end users via TCP or through Messages API. Data is distributed as a monthly subscription, from a user-defined date and continues for a 30 day period. GNSS-Radio Occultation GNSS Radio Occultation (GNSS-RO) measurements are collected globally on a continuous basis, generating profiles of the Earth’s atmosphere. Derived Level 1 and Level 2 products include both atmospheric and ionospheric products. Historical data for most of the GNSS-RO products are available from December 2018 to the present. Near real-time (within 90 minutes or less latency from collection to delivery) GNSS-RO profiles are also available upon request. GNSS Reflectometry GNSS Reflectometry (GNSS-R) is a technique to measure Earth’s surface properties using reflections of GNSS signals in the form of a bistatic radar. Spire collects two types of GNSS-R data: conventional, near-nadir incidence LHCP reflections collected by the Spire GNSS-R satellites (e.g., Spire GNSS-R “Batch-1” satellites) and grazing angle (i.e., low elevation angle) RHCP reflections collected by the Spire GNSS-RO satellites. Derived Level 1 and Level 2 products are available, as well as some special Level 0 raw intermediate frequency (IF) data. Historical grazing angle GNSS-R data are available from May 2019 to the present, while conventional GNSS-R data are available from December 2020 to the present. In addition, also Polarimetric Radio Occultation (PRO) measurements are available Name Description Data format and content Application Automatic Identification System (AIS) The automatic identification system (AIS) is an automatic tracking system that uses transponders on ships and is used by vessel traffic services. Spire data includes satellite AIS (S-AIS) as observed by Spire satellites and terrestrial AIS (T-AIS) from third party sensor stations. .parquet.gz files The AIS files contain time-series data on received AIS messages, both the raw NMEA message and added post-processing data for each message. Supply chain analysis, commodity trading, identification of illegal fishing or dark targets, ship route and fuel use optimization, analysis of global trade patterns, anti-piracy, autonomous vessel software, ocean currents Automatic Dependent Surveillance-Broadcast (ADS-B) Spire AirSafe ADS-B products give access to satellite and terrestrial ADS-B data from captured aircrafts. .csv.gz files The decompressed csv file contains a list of hexadecimal representations of ADS-B messages associated with the timestamp they were received on the satellite. Fleet management, ICAO regulatory compliance, route optimization, predictive maintenance, global airspace, domain awareness Global Navigation Satellite System Radio Occultation (GNSS-RO) GNSS atmospheric radio occultation (GNSS-RO) relies on the detection of a change in a radio signal as it passes through a planet's atmosphere, i.e. as it is refracted by the atmosphere. This data set contains precise orbit determination (POD) solutions, satellite attitude information, high-rate occultation observations, excess phase, and derived atmospheric dry temperature profiles. podObs*.rnx This file contains raw pseudorange, carrier phase, Doppler frequency, and signal-to-noise measurements for each observed GPS signal from a single Spire satellite which allow to estimate the positions and velocities of each Spire satellite and also used to derive ionospheric total electron content data. leoOrb*.sp3 This file contains the estimated position, velocity and receiver clock error of a given Spire satellite after processing of the POD observation file leoAtt*.log It contains 1 Hz rate quaternion information measured from a single Spire satellite describing the satellite orientation. opnGns*ro.bin, opnGns*rst.bin these files contain raw measurements from the occulting GNSS satellite (one for each signal frequency) and raw phase data from one or more reference GNSS satellites. atmPhs* The file contains occultation excess phase delay. Also contains SNR values, ransmitter and receiver positions and open loop model information atmPrf*.nc The file contains profiles of atmospheric dry pressure, dry temperature and neutral refractivity as a function of altitude produced from full processing of one occultation event. bfrPrf*.bufr The file contains derived profiles of dry pressure, dry temperature, refractivity and bending angle for each occultation. Atmospheric profiles of pressure, dry temperature, bending angle, and refractivity used in numerical weather prediction data assimilation and climate change studies. Raw IF samples from GNSS-RO satellites Raw intermediate frequency (IF) sampled data (I/Q) from the GNSS receiver front-end of GNSS-RO satellites. rocRIF*.zip Binary raw IF data and associated ancillary data (e.g., POD data) in a zip archive per collection event. GNSS-RO studies, GNSS RFI and jamming monitoring, research. Raw IF samples from GNSS-R satellites Raw intermediate frequency (IF) sampled data (I/Q) from the GNSS receiver front-end of conventional GNSS-R satellites. gbrRIF*.zip Binary raw IF data and associated ancillary data (e.g., POD data) in a zip archive per collection event. GNSS-R studies, GNSS RFI and jamming monitoring, research, etc. Grazing angle GNSS-R observations During grazing angle GNSS-R events, signal reflection at two frequencies is observed through the limb-facing antenna and is trackedusing an open-loop tracking technique thatrelies on a model topredict the propagationdelay and Doppler of thereflected signal. Simultaneous open-looptracking of the signaldirectly along theline-of-sight from thetransmitter to thereceiver is alsoperformed to provideadditional data that maybenecessary for signalcalibration. The mainoutput of the open-looptracking are in-phase (I)and quadrature (Q)accumulation samples(nominally at 50 Hz),which represent the residual Doppler (phase) from the model. grzObs*.nc L1A filecontains rawopen loopcarrier phasemeasurementsat 50 Hzsampling forgrazingangleGNSS-Rreflectionscaptured in the GNSS-RO RHC Pantennas, (bothdirect andreflectedsignals) on GNSS-RO satellites. Sea surface and sea ice height extent, and classification Georeferenced grazing angle GNSS-R observations The low-levelobservations of the high-rate grazing angle GNSS-R observationsbut withthegeoreferenced bistatic radar parameters of the satellite receiver,specular reflection, and GNSS transmitter included. grzRfl*.nc L1B file contains the georeferenced grazing angle GNSS-R data collected by Spire GNSS-RO satellites, including the low-level observables and bistatic radar geometries (e.g., receiver, specular reflection, and the transmitter locations). Sea surface and sea ice height extent, and classification GNSS-R calibrated bistatic radar reflectivities Higher level product used to derive land-surface reflectivity. gbrRfl*.nc L1A along-track calibrated relative power between reflected and direct signals (e.g., bistatic radar reflectivities) measured by Spire conventional GNSS-R satellites. GNSS-R studies, soil moisture, ocean wind, and sea ice applications GNSS-R calibrated bistatic radar cross-sections Higher level product used to derive ocean surface roughness products. gbrRCS*.nc L1B along-track calibrated and normalized bistatic radar cross-sections measured by Spire conventional GNSS-R satellites. GNSS-R studies, ocean wind and sea ice applications Combined Surface Soil Moisture Combined CYGNSS and SMAP soil moisture data are provided as a combined surface soil moisture (COMB-SSM) product in two data level formats: L2U1 and L3U1. 6 x 6 km grid cell. L-band measurements of surface soil moisture benefit from better vegetation penetration in comparison to traditional C-band measurements. COMB-SSM.nc This file contains the combined data product containing measurements from both CYGNSS and SMAP reported on a 6 km global Equi7Grid grid. Agriculture, crop insurance, farming solutions, climatology, terrain awareness, peatlands and wetlands monitoring etc Ionosphere total electron content Spire routinely collects and processes a large volume of total electron content (TEC) data, representing the line-of-sight integration of electron density between a Spire satellite and a GNSS satellite. Each file contains line-of-sight ionospheric total electron content (TEC) estimates derived for a ‘single viewing arc’ contained in the POD observation file. Viewing arcs are at least 10 minutes in duration. podTec*.nc This file contains the line-of-sight total electron content with associated orbital information. Space weather research, tsunamigenic earthquakes, weather applications, space situational awareness (SSA), autonomous vehicles etc Ionosphere scintillation The scintillation index for each GNSS frequency is computed onboard the spacecraft. This index provides a measure of the fluctuations of the GNSS signal over the course of 10 seconds caused by propagation of the radio signals through electron density irregularities in the ionosphere. After the raw indices are downlinked to the ground, they are packaged along with associated metadata such as orbit position to create the final scintillation data product. scnLv1*.nc This file contains on-board computed scintillation data (S4 only) with associated orbital information Space weather research, solar events, TIDs, weather applications positioning and navigation, communications etc Electron density profile Electron density profiles are retrieved as a function of altitude. Electron density profiles are processed from podTec netcdf files, which span a sufficient elevation angle range. A standard Abel inversion algorithm is applied to retrieve the profiles. ionPrf*.nc This file contains electron density profile retrieved from podTec files spanning appropriate elevation angle range Space weather research, solar events, TIDs, weather applications positioning and navigation, communications Polarimetric Radio Occultation (PRO) measurements PRO measurements observe the properties of GNSS signals as they pass through by Earth's atmosphere; the polarization state of the signals is recorded separately for H and V polarizations to provide information on the anisotropy of hydro-meteors along the propagation path. proObs Level 0 - Raw open loop carrier phase measurements at 50 Hz sampling for both linear polarization components (horizontal and vertical) of the occulted GNSS signal. leoOrb*.sp3 This file contains the estimated position, velocity and receiver clock error of a given Spire satellite after processing of the POD observation file h(v)(c)atmPhs Level 1B - Atmospheric excess phase delay computed for each individual linear polarization component (hatmPhs, vatmPhs) and for the combined (“H” + “V”) signal (catmPhs). Also contains values for signal-to-noise ratio, transmitter and receiver positions and open loop model information. polPhs Level 1C - Combines the information from the hatmPhs and vatmPhs files while removing phase continuities due to phase wrapping and navigation bit modulation. patmPrfLevel 2 - Bending angle, dry refractivity, and dry temperature as a function of mean sea level altitude and impact parameter derived from the “combined” excess phase delay (catmPhs) PRO measurements add a sensitivity to ice and precipitation content alongside the traditional RO measurements of the atmospheric temperature, pressure, and water vapor. The products are available as part of the Spire provision with worldwide coverage. All details about the data provision, data access conditions and quota assignment procedure are described in the Terms of Applicability.
Data - Announcement of Opportunity (Restrained)
Announcement of Opportunity for NoR
ESA invites submissions for the Network of Resources (NoR) call, which aims to support research, development and pre-commercial users to innovate their working practices, moving from a data download paradigm towards a 'bring the user to the data' paradigm.
Data - EO Sign In Authentication (Open)
Aeolus preliminary HLOS (horizontal line-of-sight) wind observations for Rayleigh and Mie receivers
The Level 1B wind product of the Aeolus mission contains the preliminary HLOS (horizontal line-of-sight) wind observations for Rayleigh and Mie receivers, which are generated in Near Real Time. Standard atmospheric correction (Rayleigh channel), receiver response and bias correction is applied. The product is generated within 3 hours after data acquisition.
Data - EO Sign In Authentication (Open)
Aeolus Scientific L2B Rayleigh/Mie wind product
The Level 2B wind product of the Aeolus mission is a geo-located consolidated HLOS (horizontal line-of-sight) wind observation with actual atmospheric correction applied to Rayleigh channel. The product is generated within 3 hours after data acquisition.
Data - Fast Registration with approval (Restrained)

SPOT 6 and 7 ESA archive
The SPOT 6 and 7 ESA archive is a dataset of SPOT 6 and SPOT 7 products that ESA collected over the years. The dataset regularly grows as ESA collects new SPOT 6 and 7 products. SPOT 6 and 7 Primary and Ortho products can be available in the following modes: Panchromatic image at 1.5m resolution Pansharpened colour image at 1.5m resolution Multispectral image in 4 spectral bands at 6m resolution Bundle (1.5m panchromatic image + 6m multispectral image) Spatial coverage: Check the spatial coverage of the collection on a map available on the Third Party Missions Dissemination Service. As per ESA policy, very high-resolution imagery of conflict areas cannot be provided.
Data - Fast Registration with approval (Restrained)
SPOT 1-5 ESA archive
The ESA SPOT 1-5 collection is a dataset of SPOT 1 to 5 Panchromatic and Multispectral products that ESA collected over the years. The HRV(IR) sensor onboard SPOT 1-4 provides data at 10 m spatial resolution Panchromatic mode (-1 band) and 20 m (Multispectral mode -3 or 4 bands). The HRG sensor on board of SPOT-5 provides spatial resolution of the imagery to < 3 m in the panchromatic band and to 10 m in the multispectral mode (3 bands). The SWIR band imagery remains at 20 m. The dataset mainly focuses on European and African sites but some American, Asian and Greenland areas are also covered. Spatial coverage: Check the spatial coverage of the collection on a map available on the Third Party Missions Dissemination Service. The SPOT Collection
Data - External Data (Restrained)

SciSat-1: ACE-FTS and MAESTRO
SCISAT-1 data aim at monitoring and analysing the chemical processes that control the distribution of ozone in the upper troposphere and stratosphere. It provides acquisitions from the two instruments MAESTRO and ACE-FTS. MAESTRO: Measurement of Aerosol Extinction in the Stratosphere and Troposphere Retrieved by Occultation. Dual-channel optical spectrometer in the spectral region of 285-1030 nm. The objective is to measure ozone, nitrogen dioxide and aerosol/cloud extinction (solar occultation measurements of atmospheric attenuation during satellite sunrise and sunset with the primary objective of assessing the stratospheric ozone budget). Solar occultation spectra are being used for retrieving vertical profiles of temperature and pressure, aerosols, and trace gases (O3, NO2, H2O, OClO, and BrO) involved in middle atmosphere ozone distribution. The use of two overlapping spectrometers (280 - 550 nm, 500 - 1030 nm) improves the stray-light performance. The spectral resolution is about 1-2 nm. ACE-FTS: Fourier Transform Spectrometer. The objective is to measure the vertical distribution of atmospheric trace gases, in particular of the regional polar O3 budget, as well as pressure and temperature (derived from CO2 lines). The instrument is an adapted version of the classical sweeping Michelson interferometer, using an optimised optical layout. The ACE-FTS measurements are recorded every 2 s. This corresponds to a measurement spacing of 2-6 km which decreases at lower altitudes due to refraction. The typical altitude spacing changes with the orbital beta angle. For historical reasons, the retrieved results are interpolated onto a 1 km "grid" using a piecewise quadratic method. For ACE-FTS version 1.0, the results were reported only on the interpolated grid (every 1 km from 0.5 to 149.5 km). For versions 2.2, both the "retrieval" grid and the "1 km" grid profiles are available. SCISAT-1 collection provides ACE-FTS and MAESTRO Level 2 Data. As of today, ACE-FTS products are available in version 4.1, while MAESTRO products are available in version 3.13.
Data - Fast Registration with immediate access (Open)
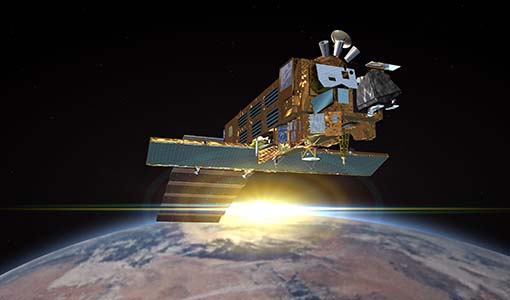
Envisat SCIAMACHY Geo-located atmospheric spectra [SCI_NL__1P]
This data product covers geo-located, radiometrically and spectrally calibrated limb and nadir radiance spectra for Nadir, Limb, and Occultation measurements with additional monitoring and calibration measurements. The Level 1b product is the lowest level of SCIAMACHY data delivered to the users. The instrument Instantaneous Field of View (IFoV) is approximately 0.045 deg (scan direction) x 1.8 deg (flight direction). This corresponds to a ground pixel size of 25 km x 0.6 km at the sub-satellite point (nadir) and of 103 km x 2.6 km at the Earth's horizon (limb). Nadir measurements have a maximum swath width of 960 km (in scan direction) and a typical footprint of 30 km (along track) x 60 km (across track). Limb measurements have a tangent height range spanning from 0 to 100 km with 3 km vertical resolution. Azimuth scans are performed for constant elevation angle, typically 34 elevation steps per limb scan. Maximum azimuth range is +/- 44 deg relative to S/C velocity (Note that the azimuth range is adjusted to observe the same atmospheric volume as for nadir measurements within five minutes). The radiometric resolution is 16 bits, with a spectral resolution of 0.24 nm to 1.5 nm, depending on the spectral range. The Sun normalized radiometric accuracy is 2 to 3% in unpolarized light, and 3 to 4% in polarized light. The relative radiometric accuracy is less than 1% and the spectral accuracy spans form 0.005 nm to 0.035 nm. Individual measurements from dedicated monitoring states include: Sun over diffuser Subsolar calibration Spectral lamp measurements White light source measurements Elevation mirror monitoring (Sun/Moon) ADC calibration Level 1b products are corrected for degradation applying a scan mirror model and m-factors. The latest Level 1b dataset is version 8.0X.
Data - Fast Registration with immediate access (Open)
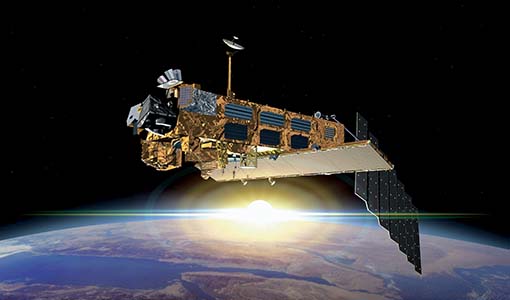
Envisat SCIAMACHY Total column densities and stratospheric profiles [SCI_OL__2P]
The data product provides global column distributions and stratospheric profiles of various trace gases. Total column densities of O3, NO2, OClO, H2O, SO2, BrO, CO, HCHO, CHOCHO and CH4 are retrieved from Nadir measurements. Additional cloud parameters (fractional cloud coverage, cloud-top height, cloud optical thickness) and an aerosol absorption indicator are enclosed. Stratospheric profiles of O3, NO2, and BrO are derived from limb measurements and with flagging information for cloud-types. Tropospheric NO2 columns are retrieved combining limb and nadir measurements. The latest Level 2 dataset is Version 6.01.
Data - Project Proposal (Restrained)
Pléiades full archive and tasking
The Pléiades twins (1A and 1B) deliver very high-resolution optical data (up to 0.5 m resolution Panchromatic and Colour and 2 m Multispectral) and offer a daily revisit capability to any point on the globe. The swath width is approximately 20 km (with a nadir footprint). The ortho-products are automatically generated by the Pléiades ground segment, based on SRTM or Reference3D database. The projection available for Pléiades ortho-products is UTM, datum WGS84. Bands combinations:: Pansharpened: colour image at 0.5 m resolution Bundle: (0.5 m panchromatic image + 2 m multispectral image) Processing levels: Primary: The Primary product is the processing level closest to the natural image acquired by the sensor. This product restores perfect collection conditions: the sensor is placed in rectilinear geometry, and the image is clear of all radiometric distortion. Standard Ortho: The Ortho product is a georeferenced image in Earth geometry, corrected from acquisition and terrain off-nadir effects. Tailored Ortho: Aside from the Standard Ortho product, when different specifications are needed, a custom orthorectification, with a more precise 3D model provided by the client or acquired for the purpose, can be provided on demand. As per ESA policy, very high-resolution imagery of conflict areas cannot be provided.
Data - Fast Registration with immediate access (Open)
Envisat GOMOS Level 2 - Atmospheric constituents profiles [GOM_NL__2P]
This data product describes atmospheric constituents profiles. In particular the vertical and line density profiles of ozone, NO2, NO3, O2, H2O, air, aerosols, temperature, turbulence. Coverage is as follows: Elevation range: +62 deg to +68 deg Azimuth range: +90 deg to +190 deg (with respect to the flight direction). The file size is 1 Mbyte per occultation, depending on the duration of the occultation.
Data - Fast Registration with immediate access (Open)
Envisat GOMOS Level 1b - Limb spectra [GOM_LIM_1P]
This data product describes localised calibrated upper and lower background limb spectra (flat-field corrected, with and without stray light). Coverage is as follows: Elevation range: C25+62 deg to +68 deg Azimuth range: +90 deg to +190 deg (with respect to the flight direction). The file size is Mbytes per occultation, depending on the duration of the occultation.
Data - Fast Registration with immediate access (Open)
Envisat GOMOS Level 2 - Residual extinction [GOM_EXT_2P]
Re-computed transmission spectra corrected for scintillation and dilution effects, before and after inversion. Coverage is as follows: Elevation range: +62 deg to +68 deg Azimuth range: +90 deg to +190 deg (with respect to the flight direction). The file size is 1 Mbyte per occultation, depending on the duration of the occultation.
Data - Fast Registration with immediate access (Open)
Envisat GOMOS Level 2 - Atmospheric constituents profiles - User Friendly Product [GOMOS_UFP]
This data product describes atmospheric constituents profiles: In particular the vertical and line density profiles of ozone, NO2, NO3, O2, H2O, air, aerosols, temperature, turbulence. Coverage is as follows: Elevation range: +62 deg to +68 deg Azimuth range: +90 deg to +190 deg (with respect to the flight direction) The GOMOS data are now also available as user friendly products in the NetCDF4-format. These products are occultation based (dark and bright) and include all GOMOS Level 2 constituent profiles (O3, NO2, NO3, O2, H2O, air and aerosols) and HRTP profiles with all the essential parameters as in the original Envisat data set format.
Data - Fast Registration with immediate access (Open)
Envisat GOMOS Geolocated Calibrated Transmission Spectra and Photometer Fluxes [GOM_TRA_1P]
This data product describes the geolocated and calibrated transmission spectra products, containing the full transmission and the covariance spectra needed for Level 2 processing. Coverage is as follows: Elevation range: +62 deg to +68 deg Azimuth range: +90 deg to +190 deg (with respect to the flight direction). The file size is 1 MB per occultation, depending on the duration of the occultation.