- All Categories (1387)
- Data (31)
- News (107)
- Missions (9)
- Events (40)
- Tools (27)
- Activities (11)
- Campaigns (13)
- Documents (1149)
DATA
Discover and download the Earth observation data you need from the broad catalogue of missions the European Space Agency operate and support.
Data - EO Sign In Authentication (Open)
Landsat RBV
This dataset contains Landsat 3 Return Beam Vidicon (RBV) products, acquired by ESA by the Fucino ground station over its visibility mask. The data (673 scenes) are the result of the digitalization of the original 70 millimetre (mm) black and white film rolls. The RBV instrument was mounted on board the Landsat 1 to 3 satellites between 1972 and 1983, with 80 metre resolution. Three independent co-aligned television cameras, one for each spectral band (band 1: blue-green, band 2: yellow-red, band 3: NIR), constituted this instrument. The RBV system was redesigned for Landsat 3 to use two cameras operating in one broad spectral band (green to near-infrared; 0.505–0.750 µm), mounted side-by-side, with panchromatic spectral response and higher spatial resolution than on Landsat 1 and Landsat 2. Each of the cameras produced a swath of about 90 km (for a total swath of 180 km), with a spatial resolution of 40 m.
Data - Data Description
Landsat 7 ETM+ European and Mediterranean Countries Cloud Free Collection
This dataset contains the cloud-free products from Landsat 7 Enhanced Thematic Mapper collection acquired over Europe, North Africa and the Middle East; for each scene only one product is selected, with the minimal cloud coverage. The Landsat 7 ETM+ scenes typically cover 185 x 170 km. A standard full scene is nominally centred on the intersection between a Path and Row (the actual image centre can vary by up to 100 m). The data are system corrected.
Data - EO Sign In Authentication (Open)
Landsat 5 TM European and Mediterranean Countries Cloud Free Collection
This dataset contains the cloud-free products from Landsat 5 Thematic Mapper collection acquired over Europe, North Africa and the Middle East; for each scene only one product is selected, with the minimal cloud coverage. The acquired Landsat TM scene covers approximately 183 x 172.8 km. A standard full scene is nominally centred on the intersection between a path and row (the actual image centre can vary by up to 100 m). The data are system corrected.
Data - EO Sign In Authentication (Open)
Landsat 8 Collection 2 European Coverage
This dataset contains the European coverage of Landsat-8 Collection 2 data, both Level-1 and Level-2, acquired since the beginning of the mission. Landsat-8 Collection 2 is the result of a reprocessing effort on the archive and on newly acquired products with significant improvement with respect to Collection 1 on data quality, obtained by means of advancements in data processing and algorithm development. Primarily, this involves a relevant improvement in the absolute geolocation accuracy (now re-baselined to the European Space Agency Copernicus Sentinel-2 Global Reference Image (GRI) but also includes updated digital elevation modelling sources, improved Radiometric Calibration (even correction for the TIRS striping effect), enhanced Quality Assessment Bands, updated and consistent metadata files and usage of Cloud Optimised Georeferenced (COG) Tagged Image File Format. Landsat-8 Level-1 products combine data from the two Landsat instruments, OLI and TIRS. The Level-1 products generated can be either L1TP or L1GT: L1TP - Level-1 Precision Terrain (Corrected) (L1T) products: Radiometrically calibrated and orthorectified using ground control points (GCPs) and digital elevation model (DEM) data to correct for relief displacement. The highest quality Level-1 products suitable for pixel-level time series analysis. GCPs used for L1TP correction are derived from the Global Land Survey 2000 (GLS2000) data set. L1GT - Level-1 Systematic Terrain (Corrected) (L1GT) products: L1GT data products consist of Level-0 product data with systematic radiometric, geometric and terrain corrections applied and resampled for registration to a cartographic projection, referenced to the WGS84, G873, or current version. The dissemination server contains three different classes of Level-1 products Real Time (RT): Newly acquired Landsat-8 OLI/TIRS data are processed upon downlink but use an initial TIRS line-of-sight model parameters; the data are made available in less than 12 hours (4-6 hours typically). Once the data have been reprocessed with the refined TIRS parameters, the products are transitioned to either Tier 1 or Tier 2 and removed from the Real-Time tier (in 14-16 days). Tier 1 (T1): Landsat scenes with the highest available data quality are placed into Tier 1 and are considered suitable for time-series analysis. Tier 1 includes Level-1 Precision and Terrain (L1TP) corrected data that have well-characterized radiometry and are inter-calibrated across the different Landsat instruments. The georegistration of Tier 1 scenes is consistent and within prescribed image-to-image tolerances of ≦ 12-metre radial root mean square error (RMSE). Tier 2 (T2): Landsat scenes not meeting Tier 1 criteria during processing are assigned to Tier 2. Tier 2 scenes adhere to the same radiometric standard as Tier 1 scenes, but do not meet the Tier 1 geometry specification due to less accurate orbital information (specific to older Landsat sensors), significant cloud cover, insufficient ground control, or other factors. This includes Systematic Terrain (L1GT) and Systematic (L1GS) processed data. Landsat-8 Level-2 products are generated from L1GT and L1TP Level-1 products that meet the <76 degrees Solar Zenith Angle constraint and include the required auxiliary data inputs to generate a scientifically viable product. The data are available a couple of days after the Level-1 T1/T2. The Level-2 products generated can be L2SP or L2SR: L2SP - Level-2 Science Products (L2SP) products: include Surface Reflectance (SR), Surface Temperature (ST), ST intermediate bands, an angle coefficients file, and Quality Assessment (QA) Bands. L2SR - Level-2 Surface Reflectance (L2SR) products: include Surface Reflectance (SR), an angle coefficients file, and Quality Assessment (QA) Bands; it is generated if ST could not be generated. Two different categories of Level-1 products are offered: LC with Optical, Thermal and Quality Map images, LO with Optical and Quality Map images (Thermal not available). For the Level-2 data, only LC combined products are generated.
Data - EO Sign In Authentication (Open)
Landsat ETM+ ESA archive
This dataset contains all the Landsat-7 Enhanced Thematic Mapper high-quality ortho-rectified L1T products (or L1Gt where not enough GCPs are available) over Kiruna, Maspalomas, Matera and Neustrelitz visibility masks. The Landsat-7 ETM+ scenes typically covers 185 x 170 km. A standard full scene is nominally centred on the intersection between a Path and Row (the actual image centre can vary by up to 100 m). Each band requires 50 MB (uncompressed), and Band 8 requires 200 MB (panchromatic band with resolution of 15 m opposed to 30 m). Kiruna, Maspalomas and Matera Landsat-7 ETM density maps
Data - Data Description
Landsat TM ESA archive
This dataset contains all the Landsat-5 Thematic Mapper high-quality ortho-rectified L1T dataset acquired by ESA over the Fucino, Matera, Kiruna and Maspalomas visibility masks, as well as campaign data over Malindi, Bishkek, Chetumal, and Libreville. The acquired Landsat TM scene covers approximately 183 x 172.8 km. A standard full scene is nominally centred on the intersection between a path and row (the actual image centre can vary by up to 100 m). A full image is composed of 6920 pixels x 5760 lines and each band requires 40 MB of storage space (uncompressed) at 30 m spatial resolution in the VIS, NIR and SWIR as well as 120 m in the TIR spectral range. Kiruna Landsat TM GTC density map Maspalomas Landsat TM GTC density map Matera Landsat TM GTC density map
Data - Data Description
Landsat MSS ESA Archive
This dataset contains all the Landsat 1 to Landsat 5 Multi Spectral Scanner (MSS) high-quality ortho-rectified Level 1 GEO and GTC dataset acquired by ESA over the Fucino, Kiruna (active from April to September only) and Maspalomas (on campaign basis) visibility masks. The acquired Landsat MSS scene covers approximately 183 x 172.8 km. A standard full scene is nominally centred on the intersection between a path and row (the actual image centre can vary by up to 200 m). The altitude changed from 917 km to 705 km and therefore two World Reference Systems (WRS) were used. A full image is composed of 3460 pixels x 2880 lines with a pixel size of 60 m. Two different product levels are available: Geometrically and terrain corrected GTC Products (L1T): The most accurate level of processing as they incorporate Ground Control Points (GCPs) and a Digital Elevation Model (DEM) to provide systematic geometric and topographic accuracy; with geodetic accuracy dependent on the number, spatial distribution and accuracy of the GCPs over the scene extent, and the resolution of the DEM used. Geometrically corrected GEO Product (L1G): Normally generated where there is a lack of GCPs, and are derived purely from data collected by the sensor and spacecraft e.g. ephemeris data. Matera density and coverage map Kiruna density and coverage map Maspalomas density and coverage map
Data - Fast Registration with immediate access (Open)
GOSAT-2 TANSO FTS-2 and CAI-2 full archive and new products
The TANSO-FTS-2 (Thermal And Near infrared Sensor for carbon Observation - Fourier Transform Spectrometer-2) instrument is an high-resolution 5-bands (NIR and TIR) spectrometer which allows the observation of reflective and emissive radiative energy from Earth's surface and the atmosphere for the measurement of atmospheric chemistry and greenhouse gases. The TANSO-CAI-2 (Thermal And Near infrared Sensor for carbon Observation - Cloud and Aerosol Imager-2) instrument is a push-broom radiometer in the spectral ranges of ultraviolet (UV), visible (VIS), Near Infrared (NIR) and SWIR (5 bands observe in the forward direction and 5 in backwards direction, with LOS tilted of 20 degrees) for the observation of aerosols and clouds optical properties and for monitoring of air pollution. The GOSAT-2 available products are: FTS-2 Level 1A products contain interferogram data observed by FTS-2, together with geometric information of observation points and various telemetry. In addition, data from an optical camera (CAM) near the observation time are also stored. Two different products for day and night observations. Common data contain common information for SWIR/TIR including CAM data; SWIR data contain information from SWIR band; TIR data contain information from TIR band FTS-2 level 1B products contain spectrum data, which are generated by Fourier transformation and other corrections to raw interferogram data in L1A. The sampled CAM data near the observation time are also stored. Two different products for day and night observations. Common data contain common information for SWIR/TIR including CAM data; SWIR products for SWIR spectrum data before and after sensitivity correction; TIR products for TIR spectrum data after sensitivity correction using blackbody and deep space calibration data and after correction of finite field of view FTS-2 NearRealTime products: FTS-2 data are first processed with predicted orbit file and made immediately available: NRT product does not include monitor camera image, best-estimate pointing-location, and target point classification but is available on the ESA server 5 hours after sensing. After a few days (usually 3 days), data is reprocessed with definitive orbit file and sent as consolidated product FTS-2 Level 2 products: Column-averaged Dry-air Mole Fraction" products store column-averaged dry-air mole fraction of atmospheric gases retrieved by using Band 1-3 spectral radiance data in TANSO-FTS-2 L1B; "Chlorophyll Fluorescence and Proxy Method (FTS-2_02_SWPR)" products store solar induced chlorophyll fluorescence data retrieved from Band 1 spectral radiance data in L1B Product as well as column-averaged dry-air mole fraction of atmospheric gases retrieved from Band 2 and 3 spectral radiance data in L1B Product. Both products are obtained by using the fill-physic maximum a posteriori (MAP) method and under the assumption of of clear-sky condition CAI-2 Level 1A products contain uncorrected image data of TANSO-CAI-2, which is stored as digital number together with telemetry of geometric information at observation point, orbit and attitude data, temperature, etc. One scene is defined as a satellite revolution data starting from ascending node to the next ascending node. Common data contain common information for both Forward looking and Backward looking; FWD products contain information for Forward looking bands, from 1 to 5; BWD products contain information for Backward looking bands, from 6 to 10 CAI-2 Level 1B products contain spectral radiance data per pixel converted from TANSO-CAI-2 L1A Products. Band-to-band registration of each forward- and backward- viewing band is applied; ortho-correction is performed to observation location data based on an earth ellipsoid model using digital elevation model data CAI-2 Level 2 products: Cloud Discrimination Products stores clear-sky confidence levels per pixel, which are calculated by combining the results of threshold tests for multiple features such as reflectance ratio and Normalized Difference Vegetation Index (NDVI), obtained from spectral radiance data in GOSAT-2 TANSO-CAI-2 L1B Product. This product also stores cloud status bit data, in which results of individual threshold tests and quality flags are summarized. The full ESA archive and newly acquired/systematically processed GOSAT2 FTS-2 and CAI-2 products are (ESA collection name versus JAXA product name): FTS-2 L1A Common day (FTS-2_1A_COMMON_DAY) FTS-2 L1A Common night (FTS-2_1A_COMMON_NIGHT) FTS-2 L1A SWIR day (FTS-2_1A_SWIR_DAY) FTS-2 L1A TIR day (FTS-2_1A_TIR_DAY) FTS-2 L1A TIR night (FTS-2_1A_TIR_NIGHT) FTS-2 L1B Common day (FTS-2_1B_COMMON_DAY) FTS-2 L1B Common night (FTS-2_1B_COMMON_NIGHT) FTS-2 L1B SWIR day (FTS-2_1B_SWIR_DAY) FTS-2 L1B TIR day (FTS-2_1B_TIR_DAY) FTS-2 L1B TIR night (FTS-2_1B_TIR_NIGHT) FTS-2 L2 Column-averaged Dry-air Mole Fraction (FTS-2_0) FTS-2 L2 Chlorophyll Fluorescence and Proxy Method (FTS-2_02_SWPR) CAI-2 L1A Common (CAI-2_1A_COMMON) CAI-2 L1A Forward viewing (CAI-2_1A_FWD) CAI-2 L1A Backward viewing (CAI-2_1A_BWD) CAI-2 L1B (CAI-2_1B).
Data - EO Sign In Authentication (Open)
SMOS Tropical Cyclone Wind Radii Fixes
The SMOS WRF product is available in Near Real Time to support tropical cyclones (TC) forecasts. It is generated within 4 to 6 hours from sensing from the SMOS L2 swath wind speed products, in the so-called "Fix (F-deck)" format compatible with the US Navy's ATCF (Automated Tropical Cyclone Forecasting) System. The SMOS WRF "fixes" to the best-track forecasts contain: the SMOS 10-min maximum-sustained winds (in knots) and wind radii (in nautical miles) for the 34 kt (17 m/s), 50 kt (25 m/s) and 64 kt (33 m/s) winds per geographical storm quadrants, and for each SMOS pass intercepting a TC in all the active ocean basins.
Data - EO Sign In Authentication (Open)
SMOS - CryoSat L4 Sea Ice Thickness
The SMOS-CryoSat merged Sea Ice Thickness Level 4 product, in NetCDF format, is based on estimates from both the MIRAS and the SIRAL instruments with a significant reduction in the relative uncertainty for the thickness of the thin ice. A weekly averaged preliminary product is generated every day by the Alfred Wegener Institut (AWI) by merging the weekly CryoSat Sea Ice Thickness product and the daily SMOS Sea Ice Thickness retrieval. A final product is provided with a latency of about 3-4 weeks using a different global sea ice concentration product and a reprocessed CryoSat product. All grids are projected onto the 25 km EASE2 Grid based on a polar aspect spherical Lambert azimuthal equal-area projection. The grid dimension is 5400 x 5400 km, equal to a 432 x 432 grid centered on the geographic pole. Coverage is limited to the October-April (winter) period for the Northern Hemisphere, due to the melting season, from year 2010 onwards.
Data - EO Sign In Authentication (Open)
SMOS NRT L2 Swath Wind Speed
SMOS retrieved surface wind speed gridded maps (with a spatial sampling of 1/4 x 1/4 degrees) are available in NetCDF format. Each product contains parts of ascending and descending orbits and it is generated by Ifremer, starting from the SMOS L1B data products, in Near Real Time i.e. within 4 to 6 hours from sensing time. Before using this dataset, please check the read-me-first note available in the Resources section below.
Data - EO Sign In Authentication (Open)

SMOS Soil Freeze and Thaw State
The SMOS Level 3 Freeze and Thaw (F/T) product provides daily information on the soil state in the Northern Hemisphere based on SMOS observations and associated ancillary data. Daily products, in NetCDF format, are generated by the Finnish Meteorological Institute (FMI) and are available from 2010 onwards. The processing algorithm makes use of gridded Level 3 brightness temperatures provided by CATDS. The data is provided in the Equal-Area Scalable Earth Grid (EASE2-Grid), at 25 km x 25 km resolution. For an optimal exploitation of this dataset, please refer to the Resources section below to access Product Specifications, read-me-first notes, etc.
Data - EO Sign In Authentication (Open)
SMOS L3 Daily Wind Speed
SMOS L3WS products are daily composite maps of the collected SMOS L2 swath wind products for a specific day, provided with the same grid than the Level 2 wind data (SMOS L2WS NRT) but separated into ascending and descending passes. This product is available the day after sensing from Ifremer, in NetCDF format. Before using this dataset, please check the read-me-first note available in the Resources section below.
Data - Campaigns (Open)
EAGLE
The general purpose of the EAGLE2006 campaign was: Acquisition of simultaneous multi-angular and multi-sensor (from visible to microwave domain) data over a grassland and a forest.
Data - Campaigns (Open)
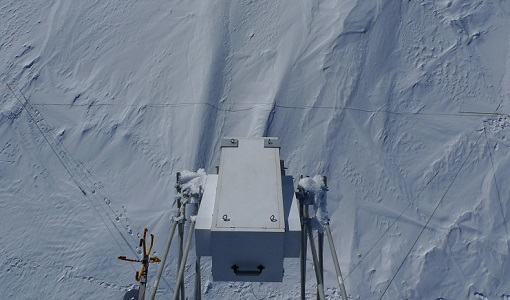
DOMEX-3
The DOMEX-3 experiment is the follow on of two previous experiments called DOMEX-1 and DOMEX-2 which were successfully conducted at Concordia base, Antarctica
Data - Campaigns (Open)
DOMEX-2
The DOMEx-2 campaign is part of the calibration and validation activities of the SMOS mission, which is one of Earth Explorers within ESA's Living Planet programme.
Data - Campaigns (Open)
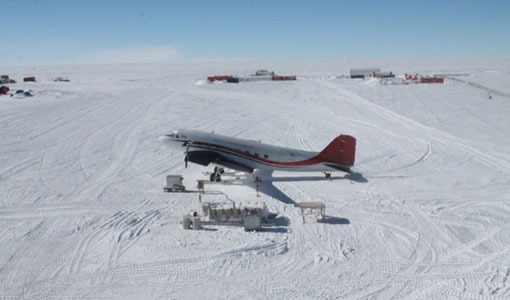
DOMEX-1
The purpose of the DOMEX experiment was to acquire the first combined, in-situ microwave emission measurements using C- and L-band radiometers.
Data - Campaigns (Open)
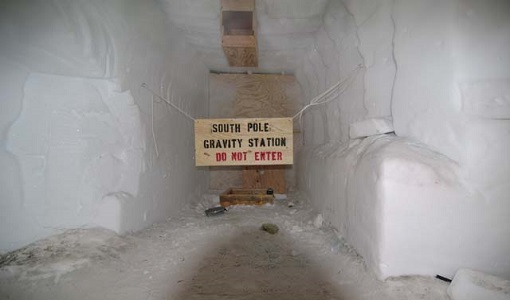
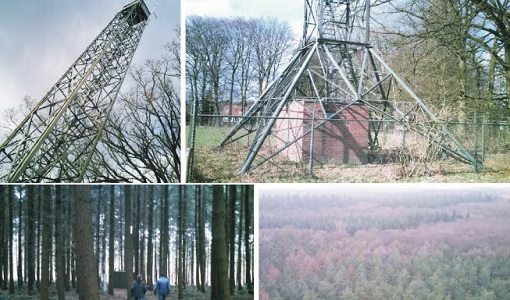
DOMECair (SMOS)
The purpose of this campaign was to assess the merits of the East Antarctic Plateau around Dome C with the Concordia station as a candidate for an Earthly calibration site. It was an airborne campaign in Antarctica supporting SMOS calibration.
Data - Campaigns (Open)
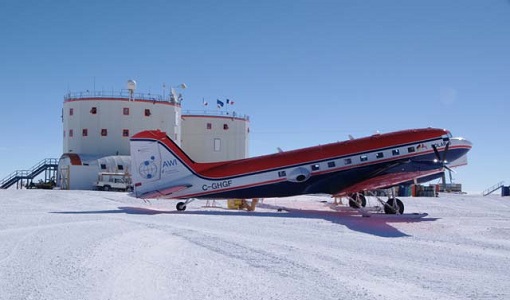
DOMECair (GOCE)
The airborne survey DOMECair 2013 and its instrumentation was designed to obtain calibration and validation data for two different satellite missions of ESA’s Earth Explorer mission, for satellites SMOS and GOCE.
Data - EO Sign In Authentication (Open)
SMOS NRT Data Products
The SMOS Near Real Time products include Level 1 geo-located brightness temperature and Level 2 geo-located soil moisture estimation. The SMOS NRT L1 Light BUFR product contains brightness temperature geo-located on a reduced Gaussian grid (T511/N256), only for "land" pixels but keeping the full angular resolution. The pixels are consolidated in a full orbit dump segment (i.e. around 100 minutes of sensing time) with a maximum size of about 30MB per orbit. Spatial resolution is in the range of 30-50 km. This product is distributed in BUFR format. The SMOS NRT L2 Soil Moisture Neural Network (NN) product provides NRT soil moisture data based on the statistical coefficients estimated by a neural network. It is provided in the SMOS DGG grid and only at the satellite track. It also provides an estimation of the uncertainty of the estimated soil moisture product, and the probability that a soil moisture value is contaminated by Radio Frequency Interference (RFI). This product is distributed in NetCDF format. The L2 data product is also distributed via the EUMETCast Europe Service (DVB), upon registration on the EUMETSAT Earth Observation Portal. The Ku-band DVB reception station must be situated within the service coverage in Europe. SMOS NRT data is also regularly delivered to the UK Met-Office, then made available to operational agencies and research and development institutes via the WMO GTS Network. For an optimal exploitation of the SMOS NRT products please consult the read-me-first notes available in the Resources section below.