- All Categories (38)
- Data (9)
- News (11)
- Missions (3)
- Events (2)
- Tools (2)
- Activities (6)
- Campaigns (3)
- Documents (2)
Document - Newsletter

Earth Online Newsletter - 22 March 2024
This issue of the Earth Online Newsletter covers a selection of the latest news and events from ESA.
News - Data Release news
FDR4ALT - ESA unveils new cutting-edge ERS/Envisat Altimeter and Microwave Radiometer Datasets
The European Space Agency (ESA) has developed a comprehensive suite of innovative Earth system data records as part of the Fundamental Data Records for Altimetry project - FDR4ALT.
Activity - Projects
ESA's multi-level global thermosphere data products consistent with Swarm and GRACE (-FO)
In this project, the possibility of using the space-based along-track Thermospheric Neutral Density (TND) estimates for generating the European Space Agency (ESA)'s Level 3 (L3) global multi-level TND data products is assessed.
Activity - Projects
Swarm Ionospheric Polar Electrodynamics
The goal of the Swarm ionospheric polar electrodynamics (SWIPE) project is to create and disseminate the most advanced models of high-latitude Joule dissipation, ionospheric convection, and ionospheric conductances.
News - Success Stories

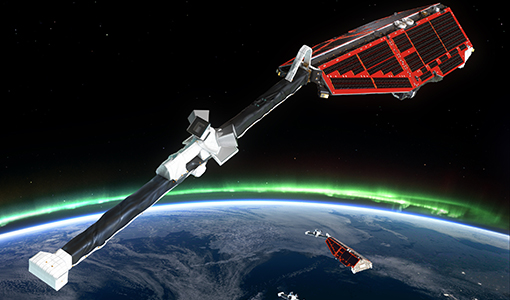
Drones join the campaign to validate Aeolus data
In June and September 2022, the Askos component of the Joint Aeolus Tropical Atlantic Campaign (JATAC), organised by ESA and its international partners, was expanded with new ground-based, drone and radiosonde measurements. The main objective of this campaign was to calibrate and validate Aeolus satellite observations.
News - Data Release news
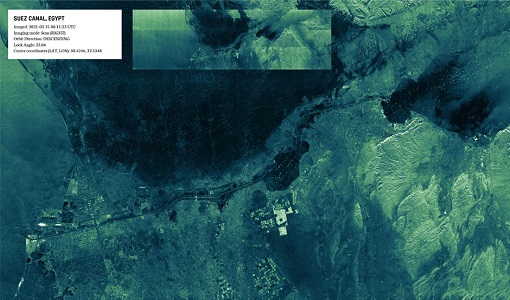
ICEYE ESA archive collection now available to users
ICEYE ESA archive collection is now available worldwide through ESA’s Third Party Missions programme. The ESA archive collections consist of products requested by ESA-supported projects worldwide, and, therefore, the products are scattered and dispersed over the territory in different time windows. The datasets regularly grow as ESA collects new products over the years.
Data - EO Sign In Authentication (Open)
ICEYE ESA archive
The ICEYE ESA archive collection consists of ICEYE Level 1 products requested by ESA supported projects over their areas of interest around the world. The dataset regularly grows as ESA collects new products over the years. Three different modes are available: Spot: With a slant resolution of 50 cm in range by 25 cm in azimuth that translated into the ground generates a ground resolution of 1 m over an area of 5 km x 5 km. Due to multi-looking, speckle noise is significantly reduced Strip: The ground swath is 30 x 50 km2 and the ground range resolution is 3 m Scan: A large area (100 km x 100 km is acquired with ground resolution of 15 m). Two different processing levels: Single Look Complex (SLC): Level 1A geo-referenced product and stored in the satellite's native image acquisition geometry (the slant imaging plane) Ground Range Detected (GRD): Level 1B product; detected, multi-looked and projected to ground range using an Earth ellipsoid model; the image coordinates are oriented along the flight direction and along the ground range; no image rotation to a map coordinate system is performed, interpolation artefacts not introduced. The following table defines the offered product types: EO-SIP Product Type Mode Processing level XN_SM__SLC Strip Single Look Complex (SLC) - Level 1A XN_SM__GRD Strip Ground Range Detected (GRD) - Level 1B XN_SL__SLC Spot Single Look Complex (SLC) - Level 1A XN_SL__GRD Spot Ground Range Detected (GRD) - Level 1B XN_SR__GRD Scan Ground Range Detected (GRD) - Level 1B As per ESA policy, very high-resolution data over conflict areas cannot be provided.
News - Events and Proceedings
Very High Resolution data to take centre stage
In the last few years, European New Space providers have helped strengthen the offering of very high resolution remote sensing data products—a designated workshop this November aims to focus on the latest developments in this arena.
Activity - Projects
Swarm Ion Temperature Estimation
The main objective of Swarm Ion Temperature Estimation (SITE) project is to estimate ion temperatures along the orbits of Swarm satellites using available LP electron density and temperature measurements, and numerical models.
Activity - Projects
Plasmapause Related boundaries in the topside Ionosphere as derived from Swarm Measurements
In the project, Plasmapause Related boundaries in the topside Ionosphere as determined from Swarm Measurements (PRISM), the team develop products that characterise position of the plasmapause related phenomena in the topside ionosphere.
News - Thematic area articles
Space data help to unravel the complexities of Earth’s atmosphere
As the impacts of the climate crisis intensify, scientists are using ESA’s Earth observation archives to investigate atmospheric processes and their influences on the planet’s changing environment.
News - Events and Proceedings
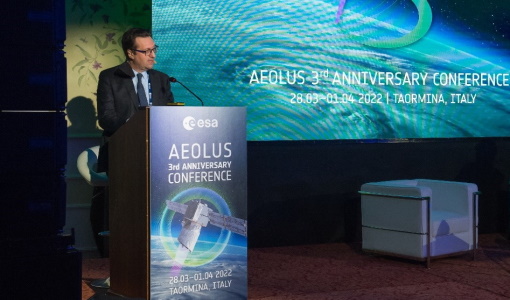
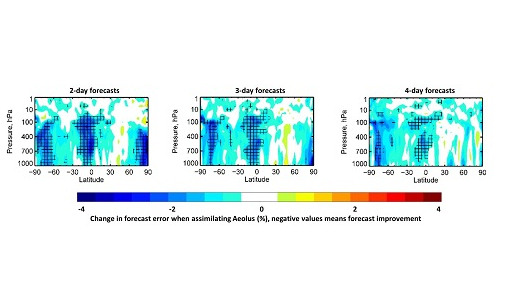
Exploring the prevailing achievements and future directions of Aeolus
A tight-knit community of European remote sensing experts converged on the Italian island of Sicily last month to discuss how the strong success of ESA’s Aeolus mission is shaping scientists’ understanding of the winds that sweep across the planet.
Tools - Processing
Aeolus VRE
The Aeolus Virtual Research Environment (VRE) is the latest extension to the VirES for Aeolus service, which offers more direct and in-depth data exploitation of the Aeolus mission. The VRE is a cloud service that provides a web-based development environment in the form of a JupyterLab workspace.
News - General News
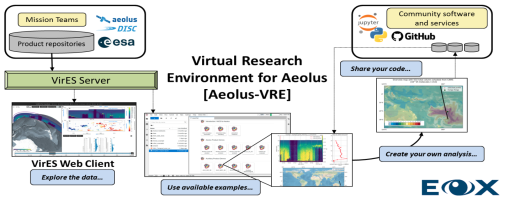
Launch of Aeolus VRE
The Aeolus Virtual Research Environment (VRE) is a cloud service, which provides users with a web-based development environment in the form of a JupyterLab workspace.
News - Success Stories
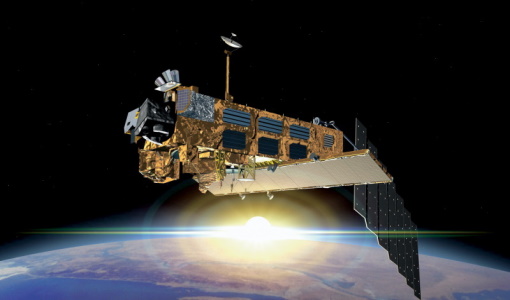
How Envisat helped to shape global understanding of Earth’s systems
Twenty years have passed since a ground-breaking European spacecraft designed to deliver unprecedented insight into the planet’s changing environment was lofted into orbit.
News - Success Stories

Dust aerosol campaign validates Aeolus data
Prepared, implemented and executed by a consortium of French universities and research institutions, under the umbrella of the French Space Agency (CNES) and the French National Centre for Scientific Research (CNRS), the Clouds-Atmospheric Dynamics–Dust Interactions in West Africa (CADDIWA) campaign took place on Sal Island in Cape Verde, from 6 to 25 September 2021.
News - Success Stories

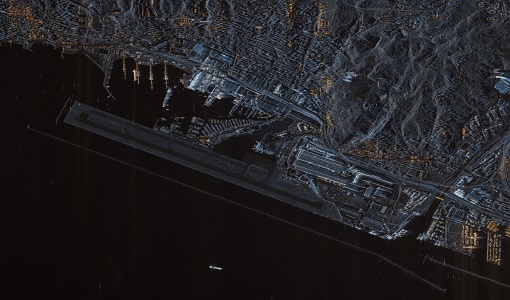
ICEYE, the World’s First SAR New Space Constellation
ICEYE is a revolutionary Finnish company that developed and launched the world’s first under-100 kilogram synthetic-aperture radar (SAR) satellites into orbit.
Event - Workshop

Aquaculture User Consultation
The main goal of the workshop was to define a detailed set of user requirements for the future ESA Aquaculture project.
Data - External Data (Restrained)
Odin OSIRIS data products
The Odin OSIRIS (Optical Spectrograph and Infra-Red Imaging System) data provides vertical profiles measures of spectrally dispersed, limb scattered sunlight from the upper troposphere into the lower mesosphere. The data products are regularly processed and provide Ozone density vertical profiles (both Level 2 and Level 3), vertical profiles of stratospheric Aerosol (both Level 2 and Level 3), slant column densities of nitrogen dioxide NO2 profiles (Level 2), stratospheric BrO profiles (Level 2).
Data - Project Proposal (Restrained)
GHGSat archive and tasking
GHGSat data produce measures of vertical column densities of greenhouse gas emissions ((currently CH4, but eventually CO2), provided on a pre-defined area of 12 km x 12 km, from the full sensor field-of-view. GHGSat Catalogue and New Collect data are available in three different data types: Single Observation: a single observation of a scene. Monthly Monitoring: guaranteed 12 successful observations in a year over a given site (once per month or flexible best effort cadence depending on weather). Weekly Monitoring: guaranteed 52 successful observations in a year over a given site (once a week or flexible best effort cadence based on weather), to accommodate large & persistent monitoring needs. Data are provided as an Emissions package containing the following products: Abundance dataset (Level 2): Set of per-pixel abundances in excess of the local background (ppb) for a single species, and per-pixel measurement error expressed as a standard deviation for a single site on a single satellite pass. Data format is 16-bit GeoTIFF. Concentration Maps (Level 2): High readability pseudocolour map combining surface reflectance, and column density expressed in ppb for a single species in PNG format. The relevant abundance dataset is provided as well. Emission Rates (Level 4): Instantaneous rate for a detected emission from a targeted source estimated using abundance datasets from a single satellite pass and applying dispersion modelling techniques. The delivered product includes the emission rate estimate with uncertainty and key dispersion parameters (in CSV format) as well as the abundance dataset used for the emission estimate. This product is only delivered in the Emissions package if an emission is detected within the abundance dataset. The Level 2 products will be delivered regardless of whether or not an emission is detected. The properties of available products are summarised in the table. Band(s) / Beam Mode(s) and Polarisation SWIR (1635-1675 nm), multiple bands, unpolarised Spatial Resolution <30 m Scene size 12 km x 12 km Species Measured CH4 Geometric Corrections Radial distortion, perspective projection Radiometric Corrections Detector pixel response, ghosting, spectral response, atmospheric correction including trace gas modelling and surface reflectance Details about the data provision, data access conditions and quota assignment procedure are described in the GHGSat Terms of Applicability.