- All Categories (26)
- Data (5)
- News (10)
- Missions (4)
- Events (4)
- Tools (2)
- Campaigns (1)
News - Data Release news
New FLEX-related campaign datasets released
New datasets have been released for three campaigns, covering activities supporting the upcoming FLEX mission.
News - Success Stories
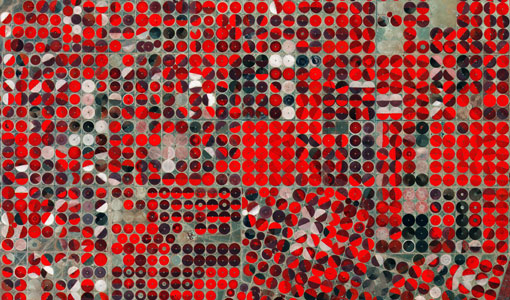
PROBA-V data improve surface albedo products in Africa
As ESA’s PROBA-V satellite marks its 10-year launch milestone, data tasked during the mission’s lifetime are still being used to assess changes in land cover.
News - Data Release news
PROBA-V ‘Collection 2’ - Reprocessed Dataset available
The improved PROBA-V data (Collection 2) has been released. Data is available via the PROBA-V MEP and Terrascope platforms so users can freely exploit the data using Virtual machines, Jupyter Notebooks, and the new viewing application.
News - Success Stories
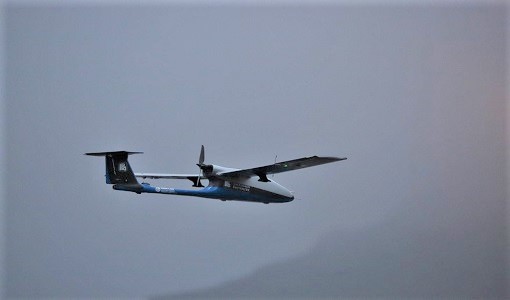
Drones join the campaign to validate Aeolus data
In June and September 2022, the Askos component of the Joint Aeolus Tropical Atlantic Campaign (JATAC), organised by ESA and its international partners, was expanded with new ground-based, drone and radiosonde measurements. The main objective of this campaign was to calibrate and validate Aeolus satellite observations.
News - Thematic area articles
Space data help to unravel the complexities of Earth’s atmosphere
As the impacts of the climate crisis intensify, scientists are using ESA’s Earth observation archives to investigate atmospheric processes and their influences on the planet’s changing environment.
News - Events and Proceedings
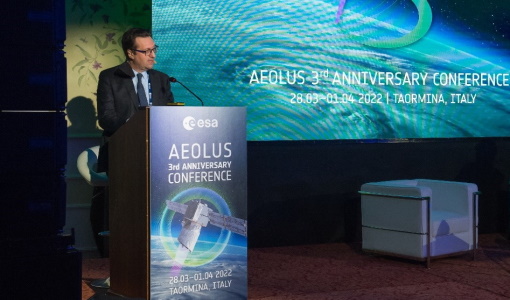
Exploring the prevailing achievements and future directions of Aeolus
A tight-knit community of European remote sensing experts converged on the Italian island of Sicily last month to discuss how the strong success of ESA’s Aeolus mission is shaping scientists’ understanding of the winds that sweep across the planet.
Tools - Processing
Aeolus VRE
The Aeolus Virtual Research Environment (VRE) is the latest extension to the VirES for Aeolus service, which offers more direct and in-depth data exploitation of the Aeolus mission. The VRE is a cloud service that provides a web-based development environment in the form of a JupyterLab workspace.
News - General News
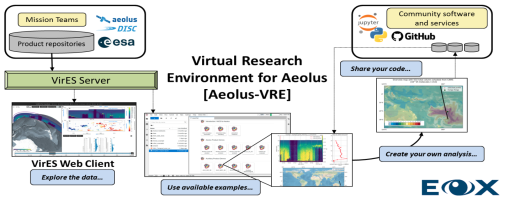
Launch of Aeolus VRE
The Aeolus Virtual Research Environment (VRE) is a cloud service, which provides users with a web-based development environment in the form of a JupyterLab workspace.
News - Success Stories
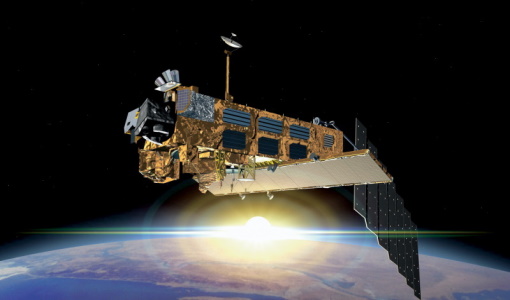
How Envisat helped to shape global understanding of Earth’s systems
Twenty years have passed since a ground-breaking European spacecraft designed to deliver unprecedented insight into the planet’s changing environment was lofted into orbit.
News - Success Stories
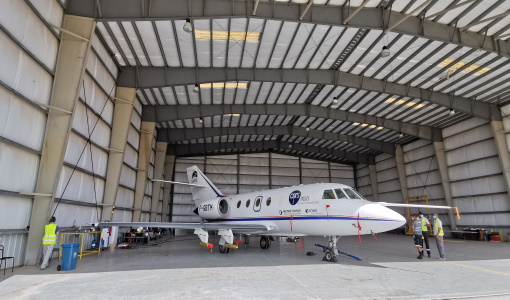
Dust aerosol campaign validates Aeolus data
Prepared, implemented and executed by a consortium of French universities and research institutions, under the umbrella of the French Space Agency (CNES) and the French National Centre for Scientific Research (CNRS), the Clouds-Atmospheric Dynamics–Dust Interactions in West Africa (CADDIWA) campaign took place on Sal Island in Cape Verde, from 6 to 25 September 2021.
Event - Workshop

Aquaculture User Consultation
The main goal of the workshop was to define a detailed set of user requirements for the future ESA Aquaculture project.
News - Events and Proceedings

Φ-Week Triumphs
In its fourth edition, Φ-Week presented the scientific community with amazing opportunities and projects—thus running alongside innovation at 360 degrees.
Mission - Third Party Missions
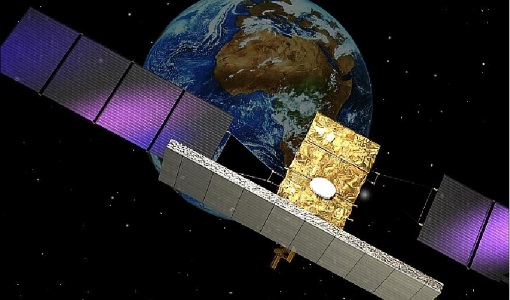
COSMO-SkyMed Second Generation
COSMO-SkyMed Second Generation is at the forefront of radar technology, will ensure improvements and guarantee continuity with the First Generation CSK satellites, preserving the high quality and the highest precision features, both required for the interferometric activities.
Tools - Other
Food Security TEP
The Food Security Thematic Exploitation Platform (TEP) enables access, processing, uploading, visualisation, manipulation and comparison of data related to food security.
Event - Meeting

Proba-V Cloud Detection Round Robin Meeting
A Round Robin exercise aimed at the inter-comparison of different cloud detection algorithms for Proba-V has been organised by the European Space Agency (ESA) and the Belgian Science Policy Office (BELSPO).
Data - Fast Registration with immediate access (Open)
GOSAT-2 TANSO FTS-2 and CAI-2 full archive and new products
The TANSO-FTS-2 (Thermal And Near infrared Sensor for carbon Observation - Fourier Transform Spectrometer-2) instrument is an high-resolution 5-bands (NIR and TIR) spectrometer which allows the observation of reflective and emissive radiative energy from Earth's surface and the atmosphere for the measurement of atmospheric chemistry and greenhouse gases. The TANSO-CAI-2 (Thermal And Near infrared Sensor for carbon Observation - Cloud and Aerosol Imager-2) instrument is a push-broom radiometer in the spectral ranges of ultraviolet (UV), visible (VIS), Near Infrared (NIR) and SWIR (5 bands observe in the forward direction and 5 in backwards direction, with LOS tilted of 20 degrees) for the observation of aerosols and clouds optical properties and for monitoring of air pollution. The GOSAT-2 available products are: FTS-2 Level 1A products contain interferogram data observed by FTS-2, together with geometric information of observation points and various telemetry. In addition, data from an optical camera (CAM) near the observation time are also stored. Two different products for day and night observations. Common data contain common information for SWIR/TIR including CAM data; SWIR data contain information from SWIR band; TIR data contain information from TIR band FTS-2 level 1B products contain spectrum data, which are generated by Fourier transformation and other corrections to raw interferogram data in L1A. The sampled CAM data near the observation time are also stored. Two different products for day and night observations. Common data contain common information for SWIR/TIR including CAM data; SWIR products for SWIR spectrum data before and after sensitivity correction; TIR products for TIR spectrum data after sensitivity correction using blackbody and deep space calibration data and after correction of finite field of view FTS-2 NearRealTime products: FTS-2 data are first processed with predicted orbit file and made immediately available: NRT product does not include monitor camera image, best-estimate pointing-location, and target point classification but is available on the ESA server 5 hours after sensing. After a few days (usually 3 days), data is reprocessed with definitive orbit file and sent as consolidated product FTS-2 Level 2 products: Column-averaged Dry-air Mole Fraction" products store column-averaged dry-air mole fraction of atmospheric gases retrieved by using Band 1-3 spectral radiance data in TANSO-FTS-2 L1B; "Chlorophyll Fluorescence and Proxy Method (FTS-2_02_SWPR)" products store solar induced chlorophyll fluorescence data retrieved from Band 1 spectral radiance data in L1B Product as well as column-averaged dry-air mole fraction of atmospheric gases retrieved from Band 2 and 3 spectral radiance data in L1B Product. Both products are obtained by using the fill-physic maximum a posteriori (MAP) method and under the assumption of of clear-sky condition CAI-2 Level 1A products contain uncorrected image data of TANSO-CAI-2, which is stored as digital number together with telemetry of geometric information at observation point, orbit and attitude data, temperature, etc. One scene is defined as a satellite revolution data starting from ascending node to the next ascending node. Common data contain common information for both Forward looking and Backward looking; FWD products contain information for Forward looking bands, from 1 to 5; BWD products contain information for Backward looking bands, from 6 to 10 CAI-2 Level 1B products contain spectral radiance data per pixel converted from TANSO-CAI-2 L1A Products. Band-to-band registration of each forward- and backward- viewing band is applied; ortho-correction is performed to observation location data based on an earth ellipsoid model using digital elevation model data CAI-2 Level 2 products: Cloud Discrimination Products stores clear-sky confidence levels per pixel, which are calculated by combining the results of threshold tests for multiple features such as reflectance ratio and Normalized Difference Vegetation Index (NDVI), obtained from spectral radiance data in GOSAT-2 TANSO-CAI-2 L1B Product. This product also stores cloud status bit data, in which results of individual threshold tests and quality flags are summarized. The full ESA archive and newly acquired/systematically processed GOSAT2 FTS-2 and CAI-2 products are (ESA collection name versus JAXA product name): FTS-2 L1A Common day (FTS-2_1A_COMMON_DAY) FTS-2 L1A Common night (FTS-2_1A_COMMON_NIGHT) FTS-2 L1A SWIR day (FTS-2_1A_SWIR_DAY) FTS-2 L1A TIR day (FTS-2_1A_TIR_DAY) FTS-2 L1A TIR night (FTS-2_1A_TIR_NIGHT) FTS-2 L1B Common day (FTS-2_1B_COMMON_DAY) FTS-2 L1B Common night (FTS-2_1B_COMMON_NIGHT) FTS-2 L1B SWIR day (FTS-2_1B_SWIR_DAY) FTS-2 L1B TIR day (FTS-2_1B_TIR_DAY) FTS-2 L1B TIR night (FTS-2_1B_TIR_NIGHT) FTS-2 L2 Column-averaged Dry-air Mole Fraction (FTS-2_0) FTS-2 L2 Chlorophyll Fluorescence and Proxy Method (FTS-2_02_SWPR) CAI-2 L1A Common (CAI-2_1A_COMMON) CAI-2 L1A Forward viewing (CAI-2_1A_FWD) CAI-2 L1A Backward viewing (CAI-2_1A_BWD) CAI-2 L1B (CAI-2_1B).
Data - Announcement of Opportunity (Restrained)
Announcement of Opportunity for NoR
ESA invites submissions for the Network of Resources (NoR) call, which aims to support research, development and pre-commercial users to innovate their working practices, moving from a data download paradigm towards a 'bring the user to the data' paradigm.
Data - External Data (Restrained)
PROBA-V 1 km, 333 m, and 100 m products
The PROBA-V VEGETATION Raw products and Synthesis products provided coverage of all significant landmasses worldwide with, in the case of a 10-day synthesis product, a minimum effect of cloud cover, resulting from selection of cloud-free acquisitions during the 10-day period. It provided a daily coverage between Latitudes 35°N and 75°N, and between 35°S and 56°S, and a full coverage every two days at the equator. The VEGETATION instrument was pre-programmed with an indefinite repeated sequence of acquisitions. This nominal acquisition scenario allowed a continuous series of identical products to be generated, with the goal to map land cover and vegetation growth across the entire planet every two days. Level Synthesis Resolution resolution (m) Reflectance Level-1C n/a TOA Level-2A n/a 100 m TOA 333 m TOA 1 km TOA Level-3 S1 100 m TOA TOC TOC NDVI 333 m TOA TOC 1 km TOA TOC S5 100 m TOA TOC TOC NDVI S10 333 m TOC TOC NDVI 1 km TOC TOC NDVI Raw Products Overview Product Description Level-1C Level-1C segments (P – product): Radiometrically corrected Level-1B data, in raw sensor geometry (unprojected) Contains: - Top Of Atmosphere reflectance in the four spectral bands - Longitude/latitude information for every pixel - Geometric viewing conditions - Information on the status map (indicating missing and interpolated measurements). Format: HDF5 & GeoTiFF Level-2A Level-2A segment: projected Level-1C (P–product) data, radiometrically and geometrically corrected. Contains: - TOA reflectance values in the four spectral bands without atmospheric correction being performed - Information on the status map (containing identification of radiometric quality, snow, ice, shadow, clouds, land/sea for every pixel) - Geometric viewing conditions Plate carrée projection (EPSG:4326) with spatial resolution of 100 m, 333 m and 1 km Format: HDF5 & GeoTiFF Synthesis Products Overview Level-3 S1 = daily, S5 = 5 days, S10 = decade Different spatial resolution: 100 m, 333 m and 1 km Divided into so called granules, each measuring 10 degrees x 10 degrees, each granule being delivered as a single file Plate carrée projection (EPSG:4326) Format: HDF5 & GeoTiFF Products Content TOA - Top Of Atmosphere reflectance in the four spectral bands (no atmospheric correction applied) - Normalized Difference Vegetation Index (NDVI) -Information on the composite status map (containing identification of snow, ice, shadow, clouds, land/sea for every pixel) - Geometric viewing conditions & date and time of selected measurement TOC Level-2A segment: projected Level-1C (P–product) data, radiometrically and geometrically corrected. Contains: - Top Of Canopy (ground surface) reflectance in the four spectral bands, the atmospheric correction being performed using the SMAC (Simplified Method for Atmospheric Corrections) algorithm - Normalized Difference Vegetation Index (NDVI) - Information on the composite status map (containing identification of snow, ice, shadow, clouds, land/sea for every pixel) Normalized Difference Vegetation Index (NDVI) from Top Of Canopy product (SMAC algorithm for atmospheric corrections applied) - Geometric viewing conditions & date and time of selected measurement TOC NDVI Normalized Difference Vegetation Index (NDVI) from Top Of Canopy product (SMAC algorithm for atmospheric corrections applied)
Data - Fast Registration with immediate access (Open)
GOSAT TANSO FTS and CAI full archive and new products
The TANSO-FTS instrument on-board GOSAT satellite features high optical throughput, fine spectral resolution, and a wide spectral coverage (from VIS to TIR in four bands). The reflective radiative energy is covered by the VIS and SWIR (Shortwave Infrared) ranges, while the emissive portion of radiation from Earth's surface and the atmosphere is covered by the MWIR (Midwave Infrared) and TIR (Thermal Infrared) ranges. These spectra include the absorption lines of greenhouse gases such as carbon dioxide (CO2) and methane (CH4). The TANSO-CAI instrument on-board GOSAT satellite is a radiometer in the spectral ranges of ultraviolet (UV), visible, and SWIR to correct cloud and aerosol interference. The imager has continuous spatial coverage, a wider field of view, and higher spatial resolution than the FTS in order to detect the aerosol spatial distribution and cloud coverage. Using the multispectral bands, the spectral characteristics of the aerosol scattering can be retrieved together with optical thickness. In addition, the UV-band range observations provide the aerosol data over land. With the FTS spectra, imager data, and the retrieval algorithm to remove cloud and aerosol contamination, the column density of the gases can be the column density of the gases can be retrieved with an accuracy of 1%. The full ESA archive and newly acquired/systematically processed GOSAT FTS and CAI products are available in the following processing levels: FTS Observation mode 1 L1B, day (FTS_OB1D_1) FTS Observation mode 1 L1B, night (FTS_OB1N_1) FTS Special Observation L1B, day (FTS_SPOD_1) FTS Special Observation L1B, night (FTS_SPON_1) FTS L2 CO2 profile, TIR (FTS_P01T_2) FTS L2 CH4 profile, TIR (FTS_P02T_2) FTS L2 CH4 column amount, SWIR (FTS_C02S_2) FTS L2 CO2 column amount, SWIR (FTS_C01S_2) FTS L2 H2O column amount, SWIR (FTS_C03S_2) FTS L3 global CO2 distribution, SWIR (FTS_C01S_3) FTS L3 global CH4 distribution, SWIR (FTS_C02S_3) FTS L4A global CO2 flux, annual in text format (FTS_F01M4A) FTS L4A global CO2 flux, annual in netCDF format (FTS_F03M4A) FTS L4A global CO2 distribution (FTS_P01M4B) FTS L4A global CH4 flux, annual in text format (FTS_F02M4A) FTS L4A global CH4 flux, annual in netCDF format (FTS_F04M4A) FTS L4A global CH4 distribution (FTS_P02M4B) CAI L1B data (CAI_TRB0_1) CAI L1B+ (CAI_TRBP_1) CAI L2 cloud flag (CAI_CLDM_2) CAI L3 global reflect. distrib. clear sky (CAI_TRCF_3) CAI L3 global radiance distrib. all pixels (CAI_TRCL_3) CAI L3 global NDVI (CAI_NDVI_3). All products are made available as soon as processed and received from JAXA. To satisfy NearRealTime requirements, ESA also provides access to the FTS L1X products, which are the NRT version of FTS L1B products. The main difference between L1X and L1B is that L1X does not include CAM data, best-estimate pointing-location, and target point classification, but most of all the L1X products are available on the ESA server between 2 and 5 hours after acquisition. The L1X products remains on the FTP server for 5 days, the time for the corresponding L1B to be available. A document describing the differences between L1X and L1B products is listed in the available resources. For more details on products, please refer to below product specifications.
Data - External Data (Restrained)
Aura OMI complete NASA dataset
The OMI observations provide the following capabilities and features: A mapping of ozone columns at 13 km x 24 km and profiles at 13 km x 48 km A measurement of key air quality components: NO2, SO2, BrO, HCHO, and aerosol The ability to distinguish between aerosol types, such as smoke, dust and sulfates The ability to measure aerosol absorption capacity in terms of aerosol absorption optical depth or single scattering albedo A measurement of cloud pressure and coverage A mapping of the global distribution and trends in UV-B radiation. The OMI data are available in the following four levels: Level 0, Level 1B, Level 2, and Level 3. Level 0 products are raw sensor counts. Level 0 data are packaged into two-hour "chunks" of observations in the life of the spacecraft (and the OMI aboard it) irrespective of orbital boundaries. They contain orbital swath data. Level 1B processing takes Level 0 data and calibrates, geo-locates and packages the data into orbits. They contain orbital swath data. Level 2 products contain orbital swath data. Level 3 products contain global data that are composited over time (daily or monthly) or over space for small equal angle (latitude longitude) grids covering the whole globe.