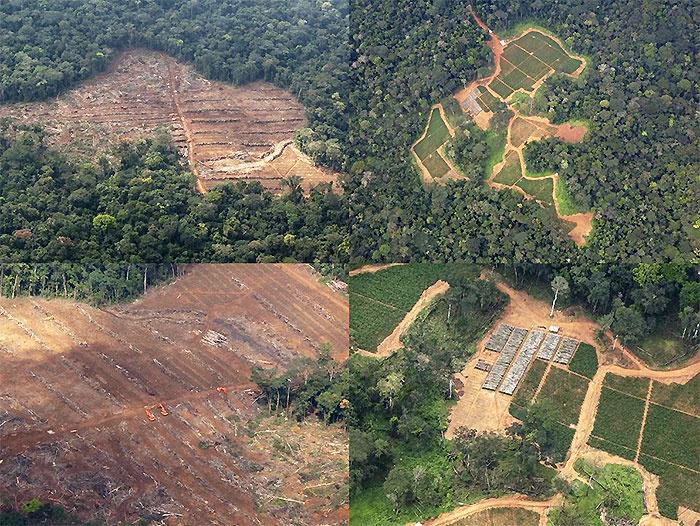
(From Global Greenhouse Warming) Deforestation by burning, a widespread practice in the world's tropical rain forests, adversely impacts the trace-gas composition of the atmosphere in two different ways. First, the burning of the tropical forests produces large amounts of carbon dioxide, carbon monoxide, methane, and other trace gases that are products when biomass burns. Second, the tropical forest is an important sink, or repository, for carbon dioxide. Atmospheric carbon dioxide is incorporated into the living biomass via the process of photosynthesis, which in turn produces the oxygen we breathe.
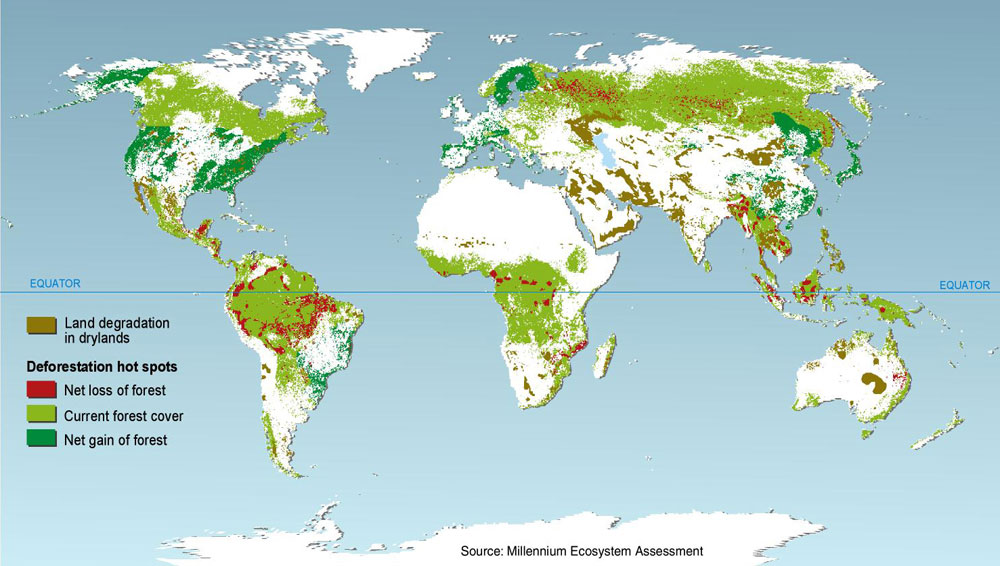
The Food and Agriculture Organization (FAO) estimates that 53,000 square miles of tropical forests (rain forest and other) were destroyed each year during the 1980s. Of this, they estimate that 21,000 square miles were deforested annually in South America, most of this in the Amazon Basin. Based on these estimates, an area of tropical forest large enough to cover North Carolina is deforested each year! Forests absorb a lot of sunlight for photosynthesis, and only about 12 to 15% is reflected. The large amounts of energy absorbed by forests acts to stimulate convection currents in air which enhance the production of rainfall. Tropical rainforests in particular are very wet and humid places. Deforested areas, by contrast, reflect about 20% of incoming sunlight. Deforested areas consequently, can become drier as a result of the loss of vegetation, increasing the risk of desertification. As the area of deforestation increases, so the impact on climate grows. Trees also absorb carbon dioxide from the atmosphere for photosynthesis, and therefore help to regulate the natural greenhouse effect. Deforestation takes away a potential sink for the carbon dioxide we are pumping into the atmosphere. In addition, if forests are removed by burning, a lot of extra carbon dioxide locked up in tree wood is returned to the atmosphere. Carbon stored in forest biomass, deadwood, litter and soil together is roughly 50 percent more than the amount of total carbon in the atmosphere.
|
Envisat and ERS images of deforestation |
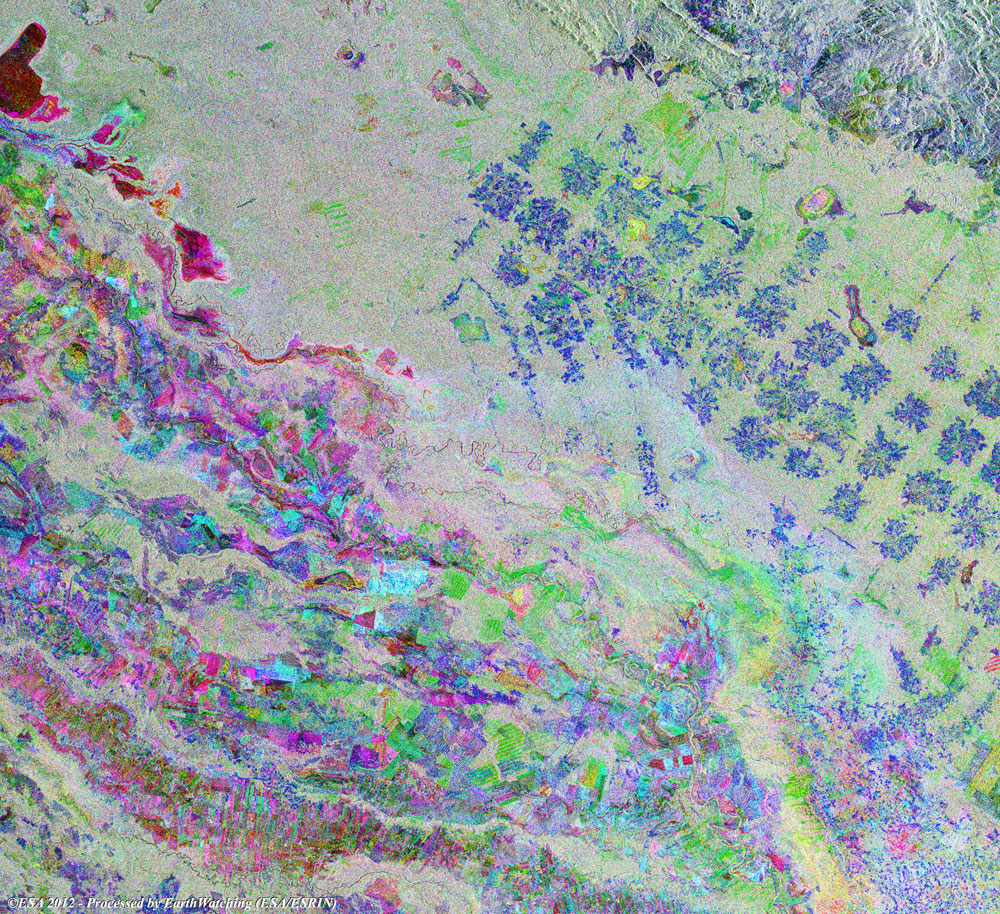
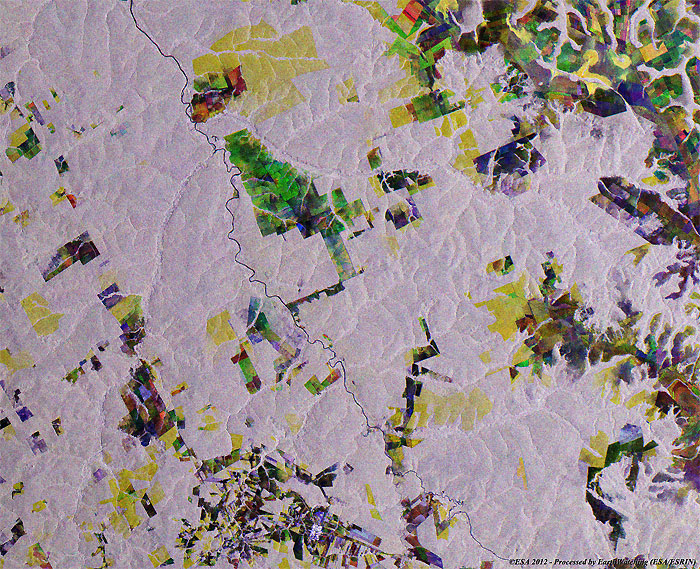
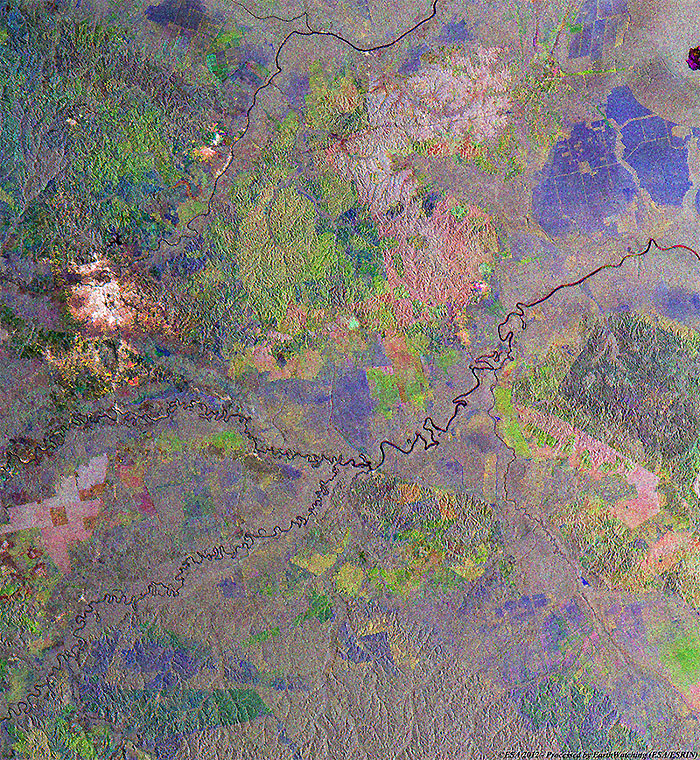
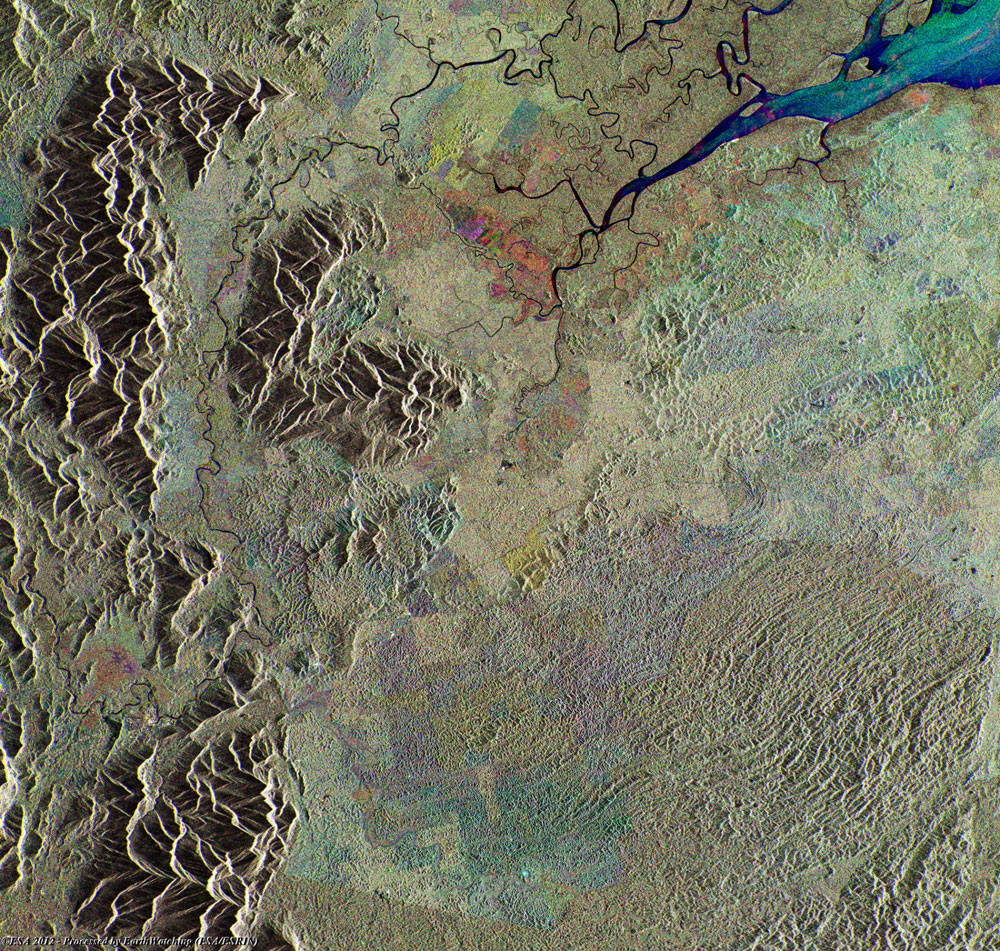
These merged images generated with the ERS-1/2 and Envisat Radar satellite during the last 20 years below; show some examples of deforestation in different areas of the world. Further images for these events are available in the links provided.
|
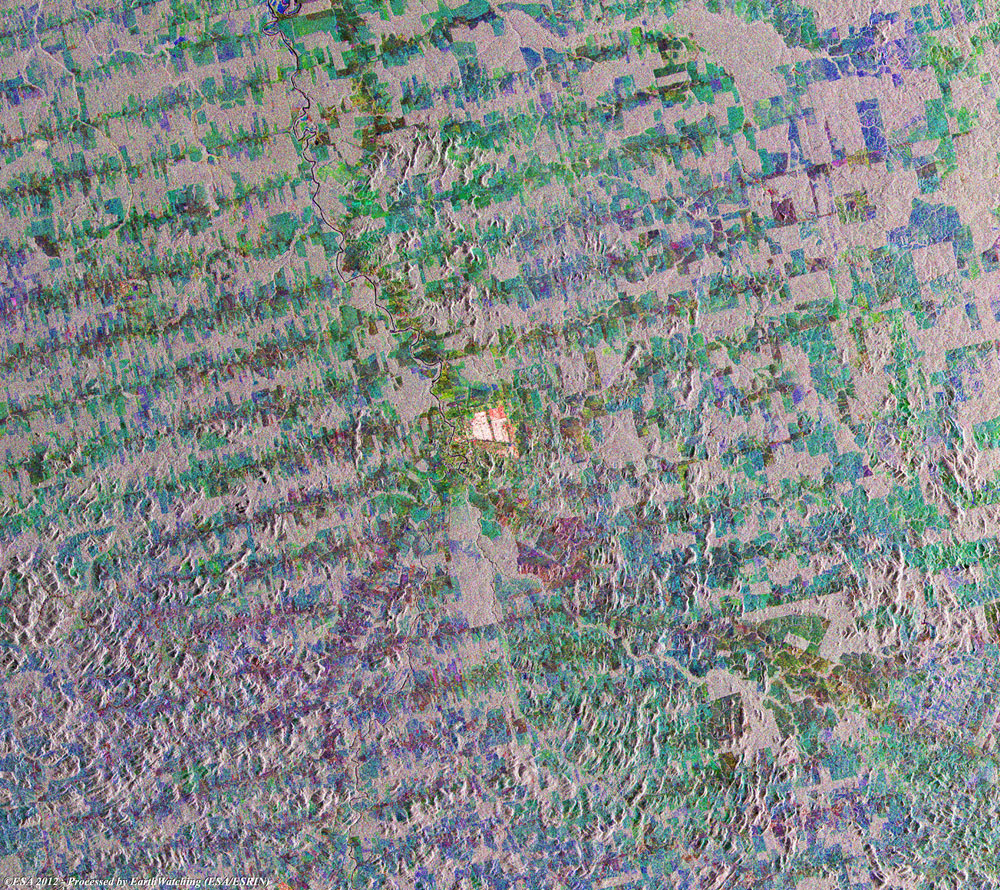
Bolivia (Santa Cruz de la Sierra) deforestation |
For more information on this image and to see further images of deforestation in Bolivia, see the related event.
|
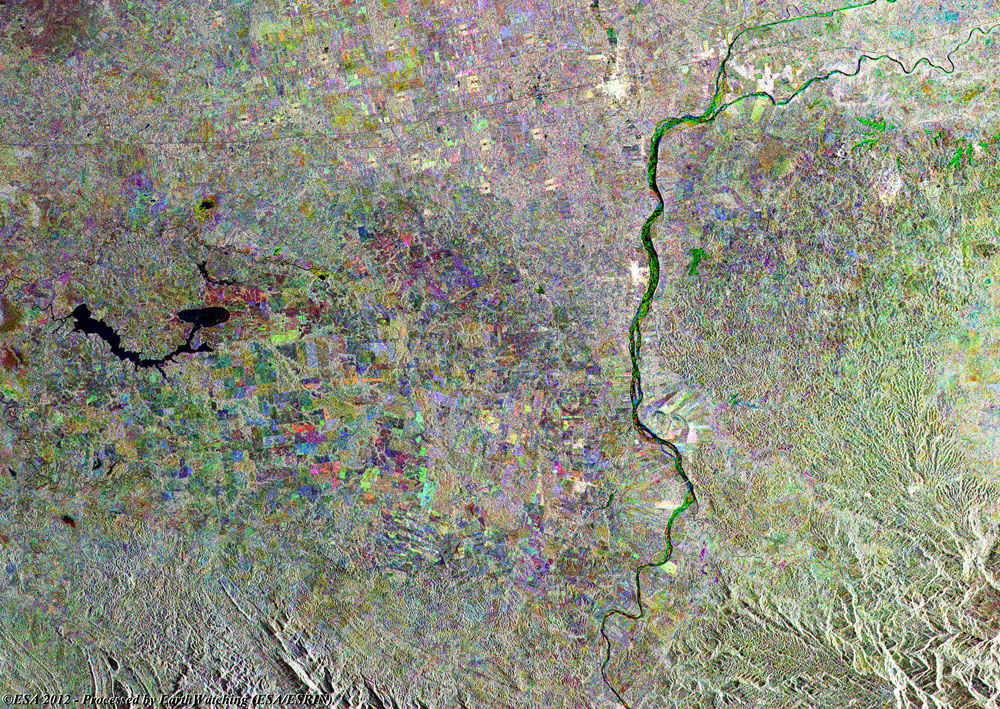
Brazil (Mato Grosso and Rondonia Regions) deforestation |
For more information on these images and to see further images of deforestation in Brazil, see the related event.
|
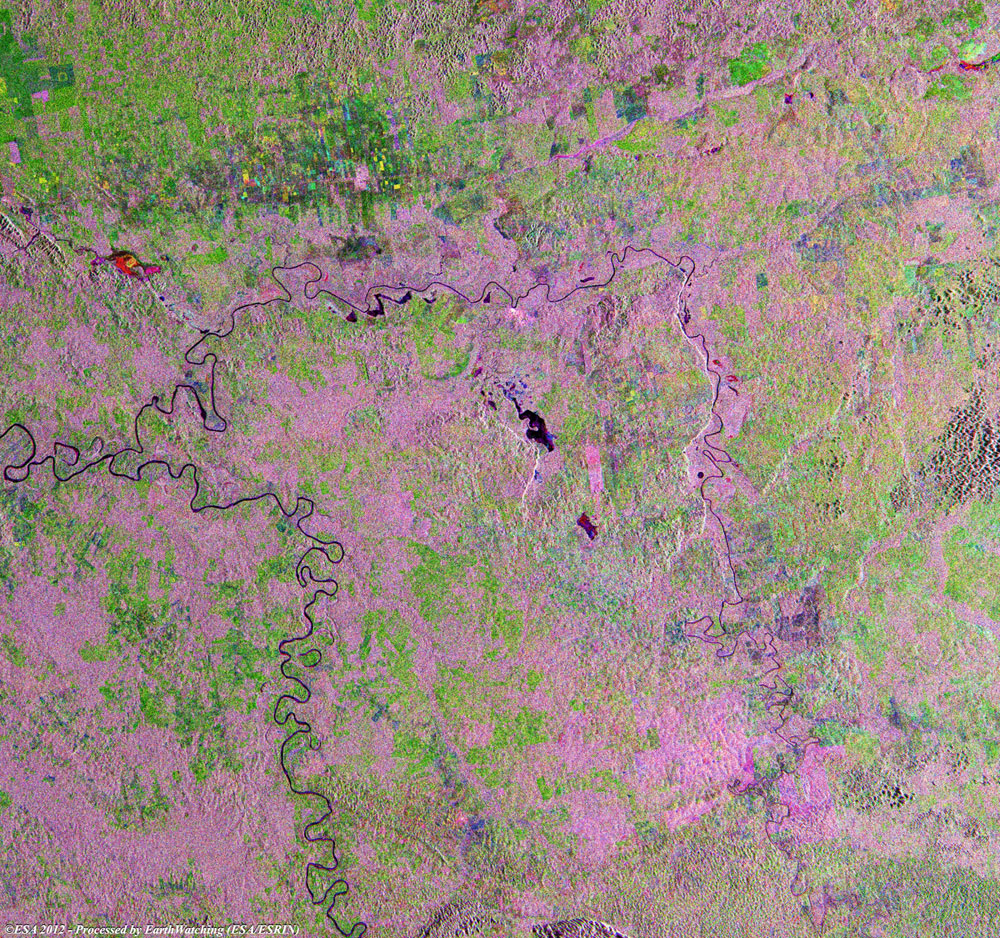
Mexico (Tabasco Region) deforestation |
For more information on this image and to see further images of deforestation in Mexico, see the related event.
For more information on this image and to see further images of deforestation in Guatemala, see the related event.
|
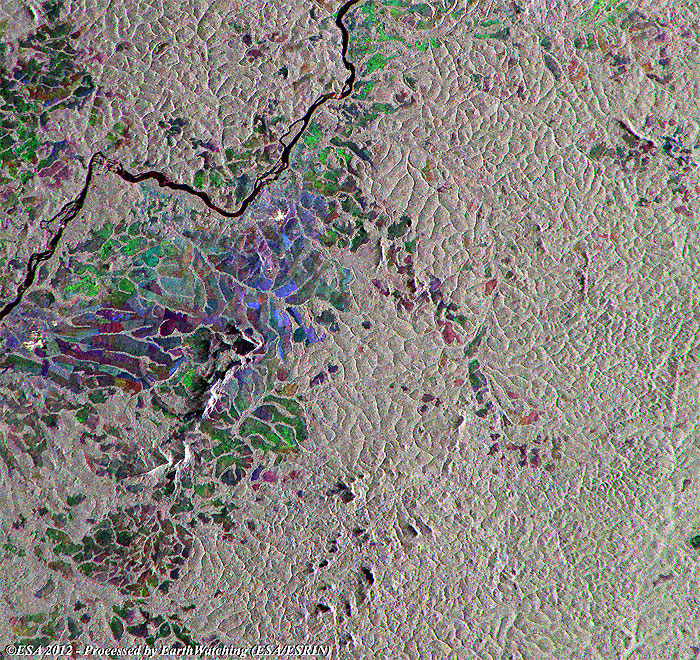
Cameroon (Korup National Park) deforestation |
For more information on this image and to see further images of deforestation in Cameroon, see the related event.
For more information on this image and to see further images of deforestation in Sumatra, see the related event.
|
Borneo (Sabah State) deforestation |
For more information on this image and to see further images of deforestation in Borneo, see the related event.
Back to top
 Browse SAR Events by Year