- All Categories (205)
- Data (37)
- News (88)
- Missions (8)
- Events (27)
- Tools (8)
- Campaigns (23)
- Documents (14)
News - Infographics
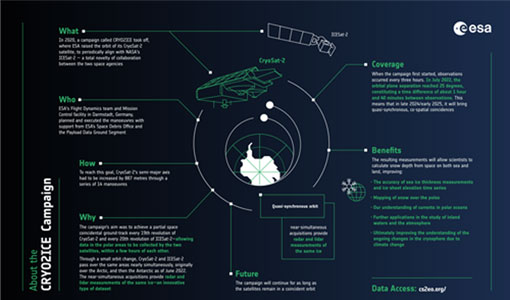
What is CRYO2ICE?
Learn about CRYO2ICE, an innovative campaign producing near simultaneous acquisitions over Antarctica from the CryoSat and ICESAT-2 missions, in this new infographic.
Campaign
WaddenSAR
The “WaddenSAR – Airborne bistatic C-band SAR experiment to demonstrate different acquisition geometries” was initiated to support the development of the Earth Explorer 10 Harmony mission.
Data - Campaigns (Open)
WaddenSAR
The “WaddenSAR – Airborne bistatic C-band SAR experiment to demonstrate different acquisition geometries” was initiated to support the development of the Earth Explorer 10 Harmony mission.
News - Data Release news
Updated CryoSat magnetometer data now available with new baseline 0201
An improved version of the CryoSat magnetic field data is now available on the Swarm Dissemination Server with new baseline 0201.
News - Data Release news
Updated CryoSat magnetometer data now available
An improved version of the CryoSat magnetic field data (version 0102) is now available in the "#CryoSat-2" folder of the ESA FTP server.
News - Operational News

Update for the SMOS Near Real Time Sea Surface Wind Speed Processor configuration
An updated configuration of the SMOS Near Real Time Sea Surface Wind Speed Processor was deployed at the IFREMER and ESA operational ground segment on 4th December 2023.
News - Thematic area articles
Transforming space data into climate action
ESA’s Earth observation activities are playing a key role in the revitalised global drive to combat climate change.
News - Success Stories
Trailblazing ERS-2 mission enables climate change applications
As ESA’s ERS-2 satellite approaches Earth’s atmosphere for reentry, it’s time to reflect on the mission’s great achievements in powering climate-related applications.
News - Infographics
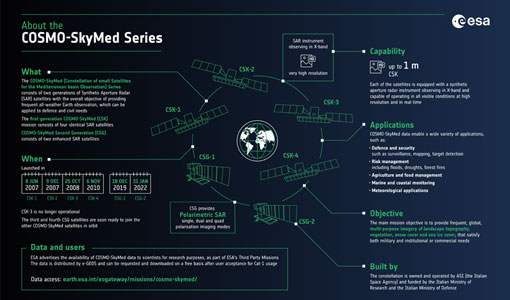
The COSMO-SkyMed series - Two generations of SAR satellites
Learn about the COSMO-SkyMed (Constellation of small Satellites for the Mediterranean basin Observation) series in our latest infographic.
News - Data Release news
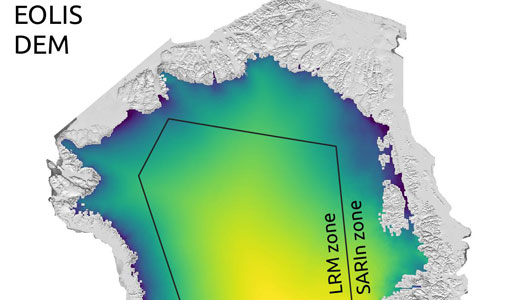
Systematic swath elevation and monthly DEMs over the Greenland Ice Sheet margin from CryoSat
The CryoTEMPO-EOLIS (Elevation Over Land Ice from Swath), the first of the CryoTEMPO products, is now available.
News - Data Release news
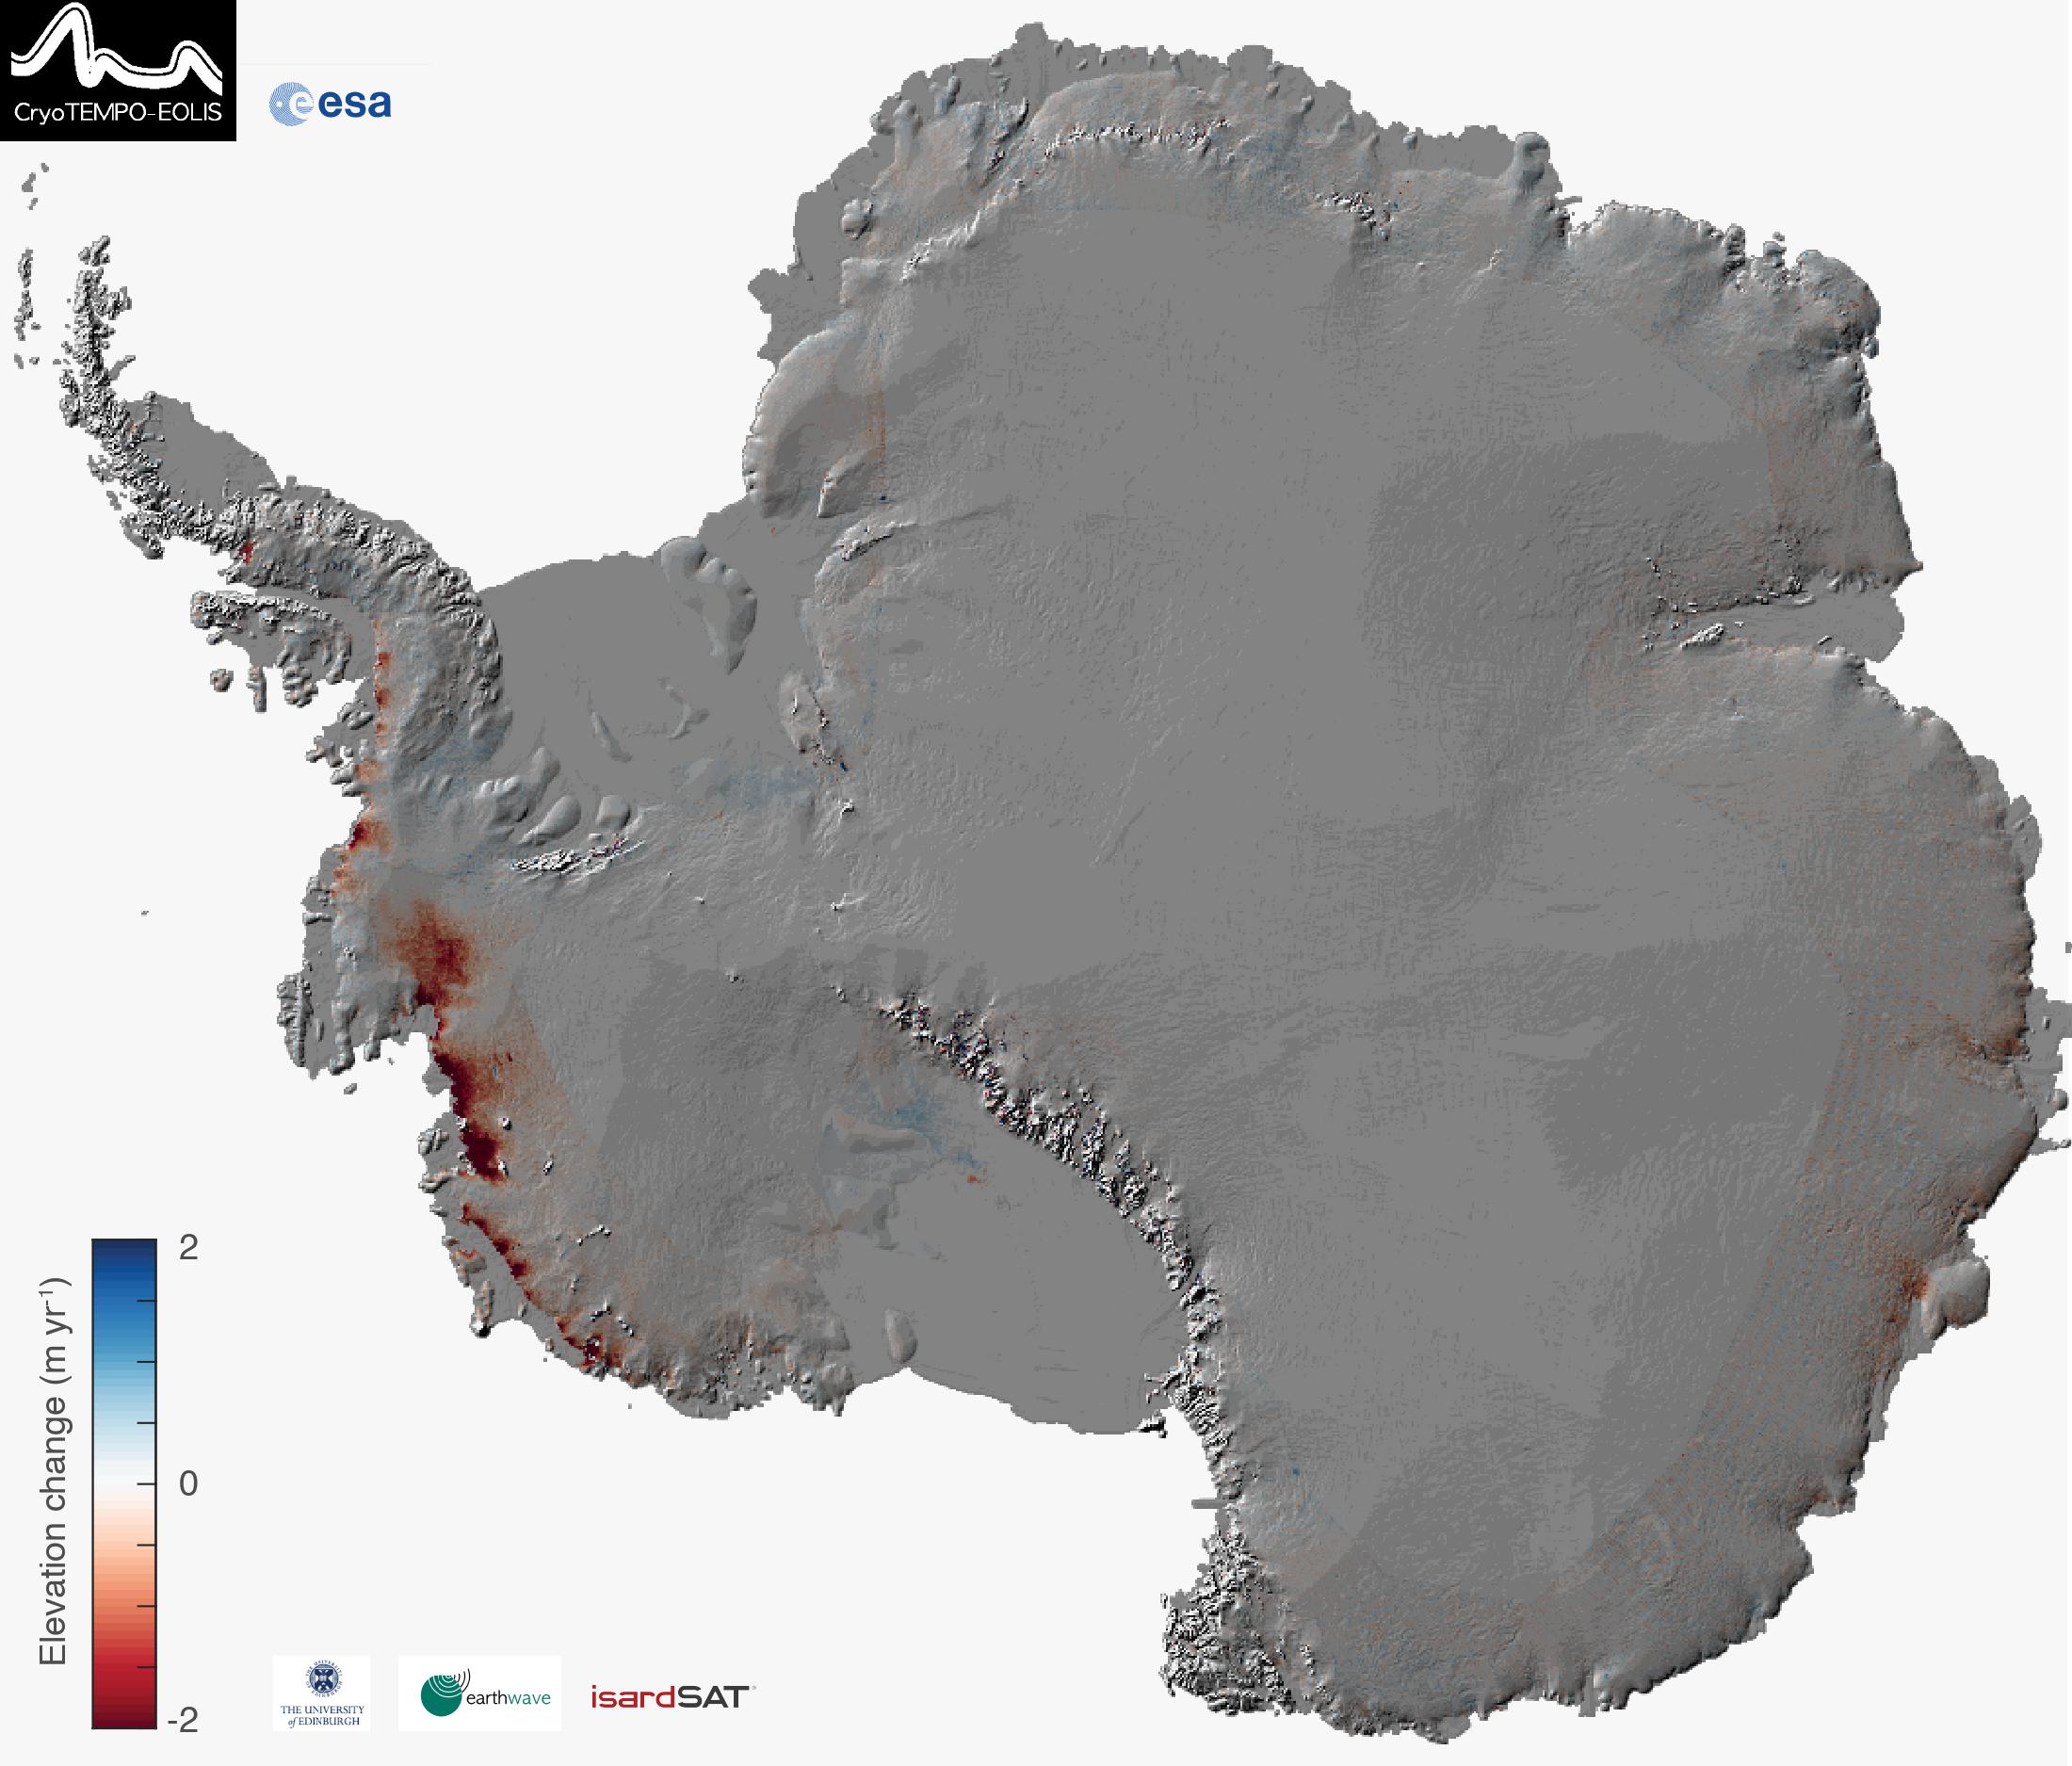
Systematic swath elevation and monthly DEMs over the Antarctica Ice Sheet margin from CryoSat 2
Land-ice is declining globally, raising sea levels worldwide and impacting glacial risks and access to fresh-water in high-mountain glaciers regions.
News - General News
Stunning new features for ESA and NASA altimetry portal cs2eo.org
Working with combined ESA and NASA altimetry data is easier than ever thanks to a range of handy new features on cs2eo.org.
Event - Workshop

Space and the Arctic 2009 Workshop
Temperatures in the Arctic are rising at an unprecedented rate. This workshop looked at the needs and challenges of working and living in the rapidly changing Arctic and explore how space-based services might help to meet those needs.
News - Data Release news
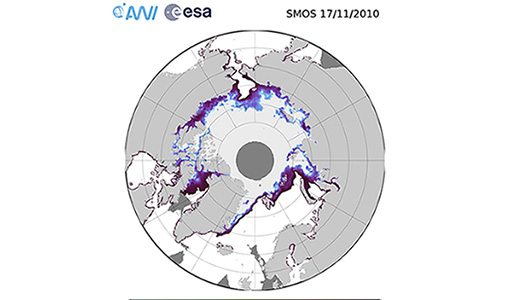
SMOS sea ice thickness reprocessed data now available
The reprocessed SMOS level 3 and 4 sea ice thickness products over the Arctic are now available from the ESA SMOS Dissemination Service.
News - Data Release news

SMOS sea ice thickness Arctic winter season 2021/2022 data available
SMOS Sea Ice thickness level 3 and level 4 data products are now available for the Arctic winter season 2021/2022.
Data - EO Sign In Authentication (Open)
SMOS L3 Sea Ice Thickness
The SMOS Level 3 Sea Ice Thickness product, in NetCDF format, provides daily estimations of SMOS-retrieved sea ice thickness (and its uncertainty) at the edge of the Arctic Ocean during the October-April (winter) season, from year 2010 onwards. The sea ice thickness is retrieved from the SMOS L1C product, up to a depth of approximately 0.5-1 m, depending on the ice temperature and salinity. Daily maps, projected on polar stereographic grid of 12.5 km, are generated by the Alfred Wegener Institut (AWI). This product is complementary with sea ice thickness measurements from ESA's CryoSat and Copernicus Sentinel-3 missions.
Tools - Processing

SMOS Artificial Scene Library (ASL)
The ASL function allows users to directly use the L1B product version 7 by mimicking the Gibbs-2 image reconstruction correction algorithm as it is implemented in the level 1 operational processor.
Data - EO Sign In Authentication (Open)
SMOS - CryoSat L4 Sea Ice Thickness
The SMOS-CryoSat merged Sea Ice Thickness Level 4 product, in NetCDF format, is based on estimates from both the MIRAS and the SIRAL instruments with a significant reduction in the relative uncertainty for the thickness of the thin ice. A weekly averaged preliminary product is generated every day by the Alfred Wegener Institut (AWI) by merging the weekly CryoSat Sea Ice Thickness product and the daily SMOS Sea Ice Thickness retrieval. A final product is provided with a latency of about 3-4 weeks using a different global sea ice concentration product and a reprocessed CryoSat product. All grids are projected onto the 25 km EASE2 Grid based on a polar aspect spherical Lambert azimuthal equal-area projection. The grid dimension is 5400 x 5400 km, equal to a 432 x 432 grid centered on the geographic pole. Coverage is limited to the October-April (winter) period for the Northern Hemisphere, due to the melting season, from year 2010 onwards.
News - Infographics
Showcasing success stories from ESA's Heritage Missions
Find out how ESA's Heritage Space Programme data continue to help, even decades after they finished operations, in our latest infographic.
News - Success Stories
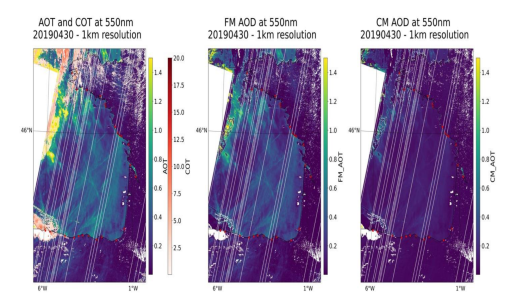
Ship trails in the Bay of Biscay observed using PROBA-V imagery
Ship trails have been perceived as convincing evidence of aerosol-cloud interaction. Ship emissions have been proven to contribute by about 1.9% and 2.9% to the increase in the global total and fine-mode aerosol optical thickness (AOT) respectively over a five year period (Peters et al. 20212).