- All Categories (3797)
- Data (21)
- News (34)
- Missions (15)
- Events (20)
- Tools (5)
- Activities (6)
- Campaigns (1)
- Documents (3695)
Document - General Reference

WATS - Water Vapour and Temperature in the Troposphere and Stratosphere.pdf
This report describes the WATS mission, one of the candidate Earth Explorers in the second cycle in 2001.
Document - Technical Note

WALES - Water Vapour Lidar Experiment in Space
This report describes the WALES mission, one of the candidate Earth Explorers in the second cycle in 2001.
Document - Product Cal/Val Plan/Report
Validation Report following the 3rd MERIS data reprocessing
This document prepared by the MERIS Quality Working Group (QWG) corresponds to the Validation Report following the 3rd MERIS data reprocessing. It aims at qualifying and quantifying the accuracy of the MERIS L2 products generated with the version 8.0 of MERIS Ground Segment prototype (MEGS), delivered to the whole community through the ODESA software (http://earth.eo.esa.int/odesa/). It is equivalent to version 6.0 of the Instrument Processing Facilities (IPF) at ESRIN.
News - Thematic area articles
Transforming space data into climate action
ESA’s Earth observation activities are playing a key role in the revitalised global drive to combat climate change.
Document - General Reference
The Nine Candidate Earth Explorer Missions - Earth Radiation Mission
This report for assessment addresses the Earth Radiation mission when it was selected with other nine Earth Explorer missions as a potential candidate for Phase A study.
Document - General Reference
The Nine Candidate Earth Explorer Missions - Atmospheric Dynamics MIssion
This report for assessment addresses the Atmospheric Dynamics mission when it was selected with other nine Earth Explorer missions as a potential candidate for Phase A study.
Document - General Reference
The Nine Candidate Earth Explorer Missions - Atmospheric Chemistry Mission
This report for assessment addresses the Atmospheric Chemistry mission when it was selected with other nine Earth Explorer missions as a potential candidate for Phase A study.
Document - General Reference
The MSG System - consisting of a Space Segment and a Ground Segment, designed to provide data, based on a series of three satellites called MSG-1, -2 and -3
This article was published in the ESA Bulletin Nr. 111.
Document - General Reference
The In-Orbit Commissioning of MSG-1
This article was published in the ESA Bulletin Nr. 114.
Document - General Reference
The four Candidate Earth Explorer Core Missions - Earth Radiation Mission
This report describes the Earth Radiation Mission, one of the four Candidate Earth Explorers in 1999.
Document - General Reference
The four Candidate Earth Explorer Core Missions - Atmospheric Dynamics Mission
This report describes the Atmospheric Dynamics Mission, one of the four Candidate Earth Explorers in 1999.
News - Operational News
Temporary interruption to Envisat AATSR dissemination service
A planned downtime will affect the access to the ftp dissemination server for the Envisat AATSR data during the period 13-15 February 2024.
News - Data Release news
TanSat AGCS and CAPI products now available for users
In the framework of Earthnet’s Third Party Missions Programme, ESA is opening a new TanSat collection to users, freely accessible and available worldwide upon submission of a fast registration.
Data - Fast Registration with immediate access (Open)
TanSat AGCS and CAPI products
The Atmospheric Carbon-dioxide Grating Spectrometer (ACGS) instrument is pushbroom spectrometer operating in NIR and SWIR bands which allows the measuring of CO2 mole fraction. The available ACGS products have a temporal coverage between March 2017 and January 2020 (not all days included in the time frame): L1A DS: Sample Dark Calibration sample product L1A GL: Sample Glint Sample products L1A LS: Sample Lamp Calibration sample product L1A ND: Principal-Plane Nadir Sample product L1A ZS: Sample Z-Axis Solar Calibration Sample L1B CAL DS: Sample Dark Calibration product L1B CAL LS: Sample Lamp Calibration product L1B CAL ZS: Sample Z-Axis Solar Calibration product L1B SCI GL: Sample Glint Science product L1B SCI ND: Principal-Plane Nadir Science product. The Cloud Aerosol Polarization Imager (CAPI) is a pushbroom radiometer in VIS, NIR and SWIR bands for the observation of aerosols and clouds optical properties. The CAPI products are available in a time range from July 2019 and January 2020 (not all days included in the time frame): L1A ND: Principal-Plane Nadir product L1B ND 1000M: Principal-Plane Nadir products at 1000 m resolution (1375 nm, 1640 nm) L1B ND 250M: Principal-Plane Nadir products at 250 m resolution (380 nm, 670 nm, 870 nm) L1B ND GEOQK: Principal-Plane Nadir georeferenced at 250 m resolution L1B ND GEO1K: Principal-Plane Nadir georeferenced at 1000 m resolution L1B ND OBC: Principal-Plane Nadir on-board calibrator product L2 ND CLM: Principal-Plane Nadir cloud flag product.
Mission - Third Party Missions
TanSat
The TanSat mission is one of the Earth Observation projects managed by the Ministry of Science and Technology of China and is dedicated to detecting and monitoring carbon dioxide in the atmosphere.
News - Events and Proceedings
Submit your abstracts for EarthCARE Pre-Launch Science and Validation Workshop
Invitations are now open for the EarthCARE Pre-Launch Science and Validation Workshop, which will take place at ESRIN in Frascati, Italy, from 13 to 17 November.
News - Success Stories
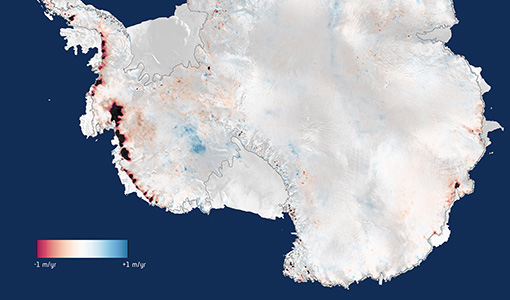
Spotlight on sea-level rise
Scientists to share findings on how satellite has revealed changes in the height of the sea, ice, inland bodies of water and more.
Data - Fast Registration with approval (Restrained)
SPOT 1-5 ESA archive
The ESA SPOT 1-5 collection is a dataset of SPOT 1 to 5 Panchromatic and Multispectral products that ESA collected over the years. The HRV(IR) sensor onboard SPOT 1-4 provides data at 10 m spatial resolution Panchromatic mode (-1 band) and 20 m (Multispectral mode -3 or 4 bands). The HRG sensor on board of SPOT-5 provides spatial resolution of the imagery to < 3 m in the panchromatic band and to 10 m in the multispectral mode (3 bands). The SWIR band imagery remains at 20 m. The dataset mainly focuses on European and African sites but some American, Asian and Greenland areas are also covered. Spatial coverage: Check the spatial coverage of the collection on a map available on the Third Party Missions Dissemination Service. The SPOT Collection
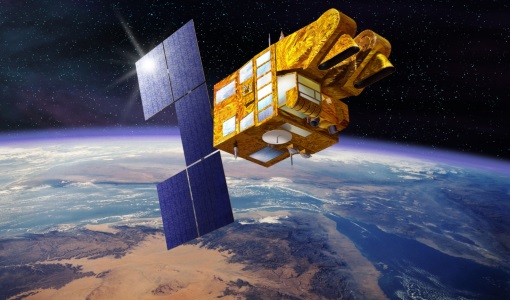
Mission - Heritage Missions
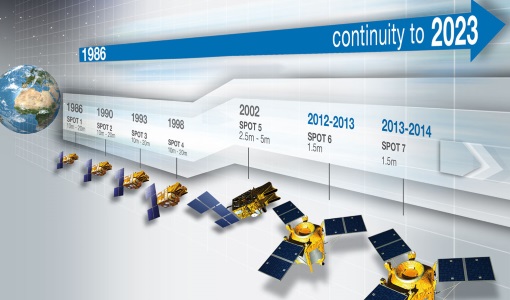
SPOT
The SPOT (from French "Satellite pour l'Observation de la Terre") series of missions has been supplying high-resolution, wide-area optical imagery since 1986.
Data - Project Proposal (Restrained)
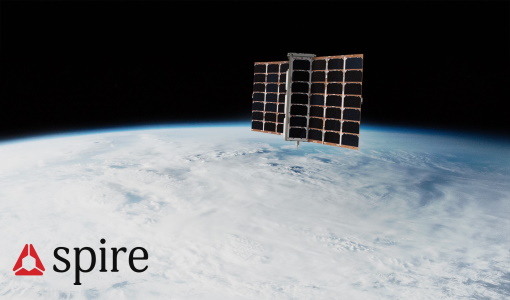
Spire live and historical data
The data collected by Spire from it's 110 satellites launched into Low Earth Orbit (LEO) has a diverse range of applications, from analysis of global trade patterns and commodity flows to aircraft routing to weather forecasting. The data also provides interesting research opportunities on topics as varied as ocean currents and GNSS-based planetary boundary layer height. The following products can be requested: ADS-B Data Stream Global ADS-B satellite data observed by Spire satellites and processed through the ground stations network. Historical ADS-B data older than 6 months can be delivered as data cuts containing CSV file(s) accessible through a Web Service or Cloud storage solutions. Live ADS-B data is available through a streaming API, and recent historical data can be accessed through a REST API. Data is distributed as a monthly subscription: historical data can be requested starting from 3 December 2018, the time period for live data starts from a user-defined date and continues for 30 days AIS AIS messages include satellite AIS (S-AIS) as observed by Spire satellites and terrestrial AIS (T-AIS) from third party sensor stations (up to 40 million messages per day). Historical AIS data are delivered as a cvs file with availability back to June 2016 or via Historical API from December 2018; live AIS data are pushed to end users via TCP or through Messages API. Data is distributed as a monthly subscription, from a user-defined date and continues for a 30 day period. GNSS-Radio Occultation GNSS Radio Occultation (GNSS-RO) measurements are collected globally on a continuous basis, generating profiles of the Earth’s atmosphere. Derived Level 1 and Level 2 products include both atmospheric and ionospheric products. Historical data for most of the GNSS-RO products are available from December 2018 to the present. Near real-time (within 90 minutes or less latency from collection to delivery) GNSS-RO profiles are also available upon request. GNSS Reflectometry GNSS Reflectometry (GNSS-R) is a technique to measure Earth’s surface properties using reflections of GNSS signals in the form of a bistatic radar. Spire collects two types of GNSS-R data: conventional, near-nadir incidence LHCP reflections collected by the Spire GNSS-R satellites (e.g., Spire GNSS-R “Batch-1” satellites) and grazing angle (i.e., low elevation angle) RHCP reflections collected by the Spire GNSS-RO satellites. Derived Level 1 and Level 2 products are available, as well as some special Level 0 raw intermediate frequency (IF) data. Historical grazing angle GNSS-R data are available from May 2019 to the present, while conventional GNSS-R data are available from December 2020 to the present. In addition, also Polarimetric Radio Occultation (PRO) measurements are available Name Description Data format and content Application Automatic Identification System (AIS) The automatic identification system (AIS) is an automatic tracking system that uses transponders on ships and is used by vessel traffic services. Spire data includes satellite AIS (S-AIS) as observed by Spire satellites and terrestrial AIS (T-AIS) from third party sensor stations. .parquet.gz files The AIS files contain time-series data on received AIS messages, both the raw NMEA message and added post-processing data for each message. Supply chain analysis, commodity trading, identification of illegal fishing or dark targets, ship route and fuel use optimization, analysis of global trade patterns, anti-piracy, autonomous vessel software, ocean currents Automatic Dependent Surveillance-Broadcast (ADS-B) Spire AirSafe ADS-B products give access to satellite and terrestrial ADS-B data from captured aircrafts. .csv.gz files The decompressed csv file contains a list of hexadecimal representations of ADS-B messages associated with the timestamp they were received on the satellite. Fleet management, ICAO regulatory compliance, route optimization, predictive maintenance, global airspace, domain awareness Global Navigation Satellite System Radio Occultation (GNSS-RO) GNSS atmospheric radio occultation (GNSS-RO) relies on the detection of a change in a radio signal as it passes through a planet's atmosphere, i.e. as it is refracted by the atmosphere. This data set contains precise orbit determination (POD) solutions, satellite attitude information, high-rate occultation observations, excess phase, and derived atmospheric dry temperature profiles. podObs*.rnx This file contains raw pseudorange, carrier phase, Doppler frequency, and signal-to-noise measurements for each observed GPS signal from a single Spire satellite which allow to estimate the positions and velocities of each Spire satellite and also used to derive ionospheric total electron content data. leoOrb*.sp3 This file contains the estimated position, velocity and receiver clock error of a given Spire satellite after processing of the POD observation file leoAtt*.log It contains 1 Hz rate quaternion information measured from a single Spire satellite describing the satellite orientation. opnGns*ro.bin, opnGns*rst.bin these files contain raw measurements from the occulting GNSS satellite (one for each signal frequency) and raw phase data from one or more reference GNSS satellites. atmPhs* The file contains occultation excess phase delay. Also contains SNR values, ransmitter and receiver positions and open loop model information atmPrf*.nc The file contains profiles of atmospheric dry pressure, dry temperature and neutral refractivity as a function of altitude produced from full processing of one occultation event. bfrPrf*.bufr The file contains derived profiles of dry pressure, dry temperature, refractivity and bending angle for each occultation. Atmospheric profiles of pressure, dry temperature, bending angle, and refractivity used in numerical weather prediction data assimilation and climate change studies. Raw IF samples from GNSS-RO satellites Raw intermediate frequency (IF) sampled data (I/Q) from the GNSS receiver front-end of GNSS-RO satellites. rocRIF*.zip Binary raw IF data and associated ancillary data (e.g., POD data) in a zip archive per collection event. GNSS-RO studies, GNSS RFI and jamming monitoring, research. Raw IF samples from GNSS-R satellites Raw intermediate frequency (IF) sampled data (I/Q) from the GNSS receiver front-end of conventional GNSS-R satellites. gbrRIF*.zip Binary raw IF data and associated ancillary data (e.g., POD data) in a zip archive per collection event. GNSS-R studies, GNSS RFI and jamming monitoring, research, etc. Grazing angle GNSS-R observations During grazing angle GNSS-R events, signal reflection at two frequencies is observed through the limb-facing antenna and is trackedusing an open-loop tracking technique thatrelies on a model topredict the propagationdelay and Doppler of thereflected signal. Simultaneous open-looptracking of the signaldirectly along theline-of-sight from thetransmitter to thereceiver is alsoperformed to provideadditional data that maybenecessary for signalcalibration. The mainoutput of the open-looptracking are in-phase (I)and quadrature (Q)accumulation samples(nominally at 50 Hz),which represent the residual Doppler (phase) from the model. grzObs*.nc L1A filecontains rawopen loopcarrier phasemeasurementsat 50 Hzsampling forgrazingangleGNSS-Rreflectionscaptured in the GNSS-RO RHC Pantennas, (bothdirect andreflectedsignals) on GNSS-RO satellites. Sea surface and sea ice height extent, and classification Georeferenced grazing angle GNSS-R observations The low-levelobservations of the high-rate grazing angle GNSS-R observationsbut withthegeoreferenced bistatic radar parameters of the satellite receiver,specular reflection, and GNSS transmitter included. grzRfl*.nc L1B file contains the georeferenced grazing angle GNSS-R data collected by Spire GNSS-RO satellites, including the low-level observables and bistatic radar geometries (e.g., receiver, specular reflection, and the transmitter locations). Sea surface and sea ice height extent, and classification GNSS-R calibrated bistatic radar reflectivities Higher level product used to derive land-surface reflectivity. gbrRfl*.nc L1A along-track calibrated relative power between reflected and direct signals (e.g., bistatic radar reflectivities) measured by Spire conventional GNSS-R satellites. GNSS-R studies, soil moisture, ocean wind, and sea ice applications GNSS-R calibrated bistatic radar cross-sections Higher level product used to derive ocean surface roughness products. gbrRCS*.nc L1B along-track calibrated and normalized bistatic radar cross-sections measured by Spire conventional GNSS-R satellites. GNSS-R studies, ocean wind and sea ice applications Combined Surface Soil Moisture Combined CYGNSS and SMAP soil moisture data are provided as a combined surface soil moisture (COMB-SSM) product in two data level formats: L2U1 and L3U1. 6 x 6 km grid cell. L-band measurements of surface soil moisture benefit from better vegetation penetration in comparison to traditional C-band measurements. COMB-SSM.nc This file contains the combined data product containing measurements from both CYGNSS and SMAP reported on a 6 km global Equi7Grid grid. Agriculture, crop insurance, farming solutions, climatology, terrain awareness, peatlands and wetlands monitoring etc Ionosphere total electron content Spire routinely collects and processes a large volume of total electron content (TEC) data, representing the line-of-sight integration of electron density between a Spire satellite and a GNSS satellite. Each file contains line-of-sight ionospheric total electron content (TEC) estimates derived for a ‘single viewing arc’ contained in the POD observation file. Viewing arcs are at least 10 minutes in duration. podTec*.nc This file contains the line-of-sight total electron content with associated orbital information. Space weather research, tsunamigenic earthquakes, weather applications, space situational awareness (SSA), autonomous vehicles etc Ionosphere scintillation The scintillation index for each GNSS frequency is computed onboard the spacecraft. This index provides a measure of the fluctuations of the GNSS signal over the course of 10 seconds caused by propagation of the radio signals through electron density irregularities in the ionosphere. After the raw indices are downlinked to the ground, they are packaged along with associated metadata such as orbit position to create the final scintillation data product. scnLv1*.nc This file contains on-board computed scintillation data (S4 only) with associated orbital information Space weather research, solar events, TIDs, weather applications positioning and navigation, communications etc Electron density profile Electron density profiles are retrieved as a function of altitude. Electron density profiles are processed from podTec netcdf files, which span a sufficient elevation angle range. A standard Abel inversion algorithm is applied to retrieve the profiles. ionPrf*.nc This file contains electron density profile retrieved from podTec files spanning appropriate elevation angle range Space weather research, solar events, TIDs, weather applications positioning and navigation, communications Polarimetric Radio Occultation (PRO) measurements PRO measurements observe the properties of GNSS signals as they pass through by Earth's atmosphere; the polarization state of the signals is recorded separately for H and V polarizations to provide information on the anisotropy of hydro-meteors along the propagation path. proObs Level 0 - Raw open loop carrier phase measurements at 50 Hz sampling for both linear polarization components (horizontal and vertical) of the occulted GNSS signal. leoOrb*.sp3 This file contains the estimated position, velocity and receiver clock error of a given Spire satellite after processing of the POD observation file h(v)(c)atmPhs Level 1B - Atmospheric excess phase delay computed for each individual linear polarization component (hatmPhs, vatmPhs) and for the combined (“H” + “V”) signal (catmPhs). Also contains values for signal-to-noise ratio, transmitter and receiver positions and open loop model information. polPhs Level 1C - Combines the information from the hatmPhs and vatmPhs files while removing phase continuities due to phase wrapping and navigation bit modulation. patmPrfLevel 2 - Bending angle, dry refractivity, and dry temperature as a function of mean sea level altitude and impact parameter derived from the “combined” excess phase delay (catmPhs) PRO measurements add a sensitivity to ice and precipitation content alongside the traditional RO measurements of the atmospheric temperature, pressure, and water vapor. The products are available as part of the Spire provision with worldwide coverage. All details about the data provision, data access conditions and quota assignment procedure are described in the Terms of Applicability.