- All Categories (24012)
- Data (36)
- News (119)
- Missions (3)
- Events (23)
- Tools (19)
- Activities (7)
- Campaigns (8)
- Documents (23797)
DATA
Discover and download the Earth observation data you need from the broad catalogue of missions the European Space Agency operate and support.
Data - Sample Data (Open)

CryoSat Data Samples
Download CryoSat data samples from Baseline-B, C, and D products.
Data - Announcement of Opportunity (Restrained)
Announcement of Opportunity for G-POD
ESA is offering all scientists the possibility to perform bulk processing and/or validation of their own algorithms exploiting the large ESA Earth-observation archive.
Data - Campaigns (Open)
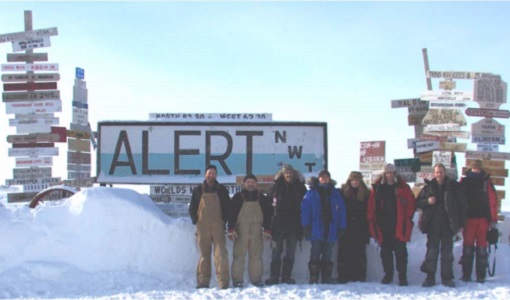
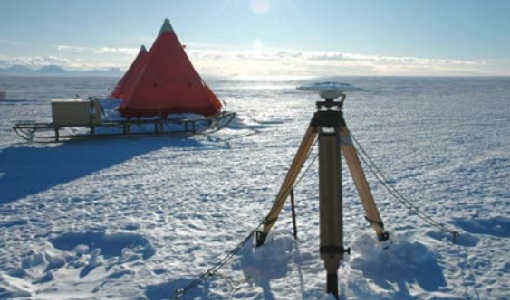
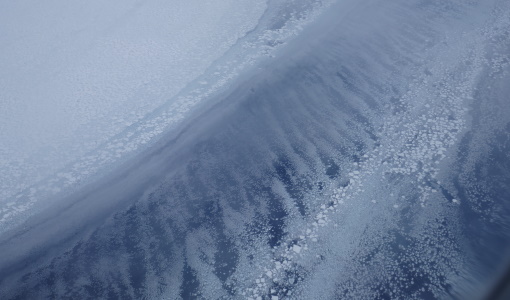
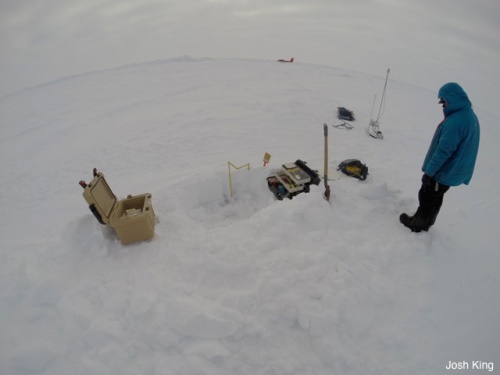
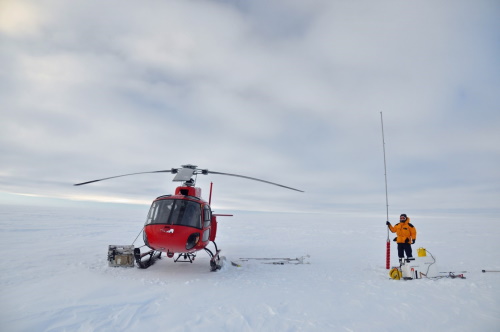
CryoVExGround 2011
The aims of the CryoVEx 2011 experiment, operating out of Alert base, was to study the snow and ice characteristics of Arctic sea ice and its snow cover during winter.
Data - Campaigns (Open)
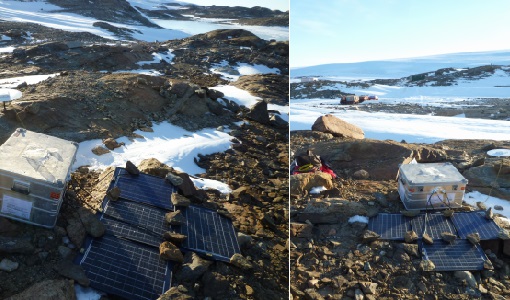
CryoVExAnt 2014/2015
The aim of CryoVEx Ant 2014 to 2015 was to perform altimeter measurements at a designated validation site in the vicinity of the Schirmacher Oasis, near Kohnen and Neumayer as well as in the Pine Island Glacier drainage basin.
Data - Campaigns (Open)
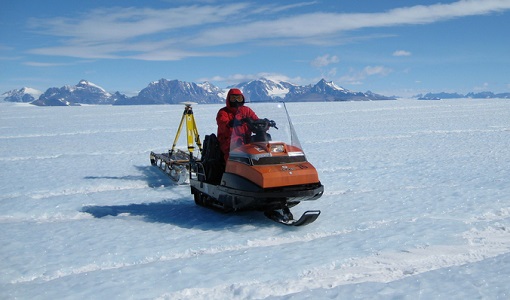
CryoVExAnt 2010/2011
The CryoVEx 2010/2011 Antartic campaign was carried out in Dronning Maud Land from 11 November 2010 to 20 February 2011.
Data - Campaigns (Open)
CryoVExAnt 2008/2009
The key objective of the CryoSat Validation Experiment Antarctica (CryoVExAnt) campaign is a better approximation of the error range of the elevation obtained from SAR-processed altimetric radar returns and its sensitivity to surface roughness.
Data - Open access (Open)
CryoSat products
CryoSat's primary payload is the SAR/Interferometric Radar Altimeter (SIRAL) which has extended capabilities to meet the measurement requirements for ice-sheet elevation and sea-ice freeboard. CryoSat also carries three star trackers for measuring the orientation of the baseline. In addition, a radio receiver called Doppler Orbit and Radio Positioning Integration by Satellite (DORIS) and a small laser retroreflector ensures that CryoSat's position will be accurately tracked. More detailed information on CryoSat instruments is available on the CryoSat mission page. The following CryoSat datasets are available and distributed to users: Level 1B and L2 Ice products: NRT, LRM, SAR and SARIn Consolidated Level 2 (GDR): (LRM+SAR+SARIN) consolidated ice products over an orbit Intermediate Level 2 Ice products: LRM, SAR and SARIn L1b and L2 Ocean Products: NOP, GOP and IOP Cryo-TEMPO Land Ice Cryo-TEMPO Sea Ice Cryo-TEMPO Coastal Ocean Cryo-TEMPO Polar Ocean Cryo-TEMPO Inland Waters Cryo-TEMPO EOLIS Point Products Cryo-TEMPO EOLIS Gridded Products CryoSat Quaternions Product. Detailed information concerning each of the above datasets is available in the CryoSat Products Overview. CryoSat Ice and Ocean products CryoSat Level 1B altimetric products contain time and geo-location information as well as SIRAL measurements in engineering units. Calibration corrections are included and have been applied to the window delay computations. In Offline products, geophysical corrections are computed from Analysis Auxiliary Data Files (ADFs), whereas in FDM products corrections are computed for Forecast ADFs. All corrections are included in the data products and therefore the range can be calculated by taking into account the surface type. The Offline Level 2 LRM, SAR and SARIn ice altimetric products are generated 30 days after data acquisition and are principally dedicated to glaciologists working on sea-ice and land-ice areas. The Level 2 FDM products are near-real time ocean products, generated 2-3 hours after data acquisition, and fulfill the needs of some ocean operational services. Level 2 products contain the time of measurement, the geo-location and the height of the surface. IOP and GOP are outputs of the CryoSat Ocean Processor. These products are dedicated to the study of ocean surfaces, and provided specifically for the needs of the oceanographic community. IOP are generated 2-3 days after data sensing acquisition and use the DORIS Preliminary Orbit. GOP are typically generated 30 days after data sensing acquisition and use the DORIS Precise Orbit. Geophysical corrections are computed from the Analysis ADFs, however following the oceanographic convention the corrections are available but not directly applied to the range (as for FDM). CryoSat Ice and Ocean products can be accessed through ftp://science-pds.cryosat.esa.int/ via an FTP client and HTTPS under the folders named “SIR_” followed by the data product type and the processing level (e.g., SIR_SAR_L2 for Level 2 SAR data). Additionally, data can be downloaded from all the other services listed in the How to Access Data section. Cryo-TEMPO Products The CryoSat ThEMatic PrOducts (Cryo-TEMPO) projects aim to deliver a new paradigm of simplified, harmonized, and agile CryoSat-2 products, that are easily accessible to new communities of non-altimeter experts and end users. The Cryo-TEMPO datasets include dedicated products over five thematic areas, covering Sea Ice, Land Ice, Polar Ocean, Coastal Ocean and Inland Water. The standard Cryo-TEMPO products include fully-traceable uncertainties and use rapidly evolving, state-of-the-art processing dedicated to each thematic area. Throughout the project, the products will be constantly evolved, and validated by a group of Thematic Users, thus ensuring optimal relevance and impact for the intended target communities. More information on the Cryo-TEMPO products can be found in the Product Handbook and on the Project Website. The products can be accessed through ftp://science-pds.cryosat.esa.int/ via an FTP client and HTTPS under the folders named “TEMPO_POCA_(SI/LI/PO/CO/IW)", where the last two letters are the initials of the thematic area (e.g., SI stands for Sea Ice). Cryo-TEMPO EOLIS The CryoTEMPO-EOLIS swath product exploits CryoSat's SARIn mode and the novel Swath processing technique to deliver increased spatial and temporal coverage of time-dependent elevation over land ice, a critical metric for tracking ice mass trends in support to a wide variety of end-users. The dataset consists of systematic reprocessing of the entire CryoSat archive to generate new L2-Swath products, increasing data sampling by 1 to 2 orders of magnitude compared with the operational L2 ESA product. In addition, the EOLIS dataset is joined with the ESA L2 Point-Of-Closest-Approach to generate monthly DEM (Digital Elevation Model) products. This dataset will further the ability of the community to analyse and understand trends across the Greenland Ice Sheet margin, Antarctica and several mountain glaciers and ice caps around the world. More information on the Cryo-TEMPO products can be found on the Project Website and the products can be accessed through ftp://science-pds.cryosat.esa.int/ via an FTP client and HTTPS under the folders named “TEMPO_SWATH_(POINT/GRID)”, where the last word is used to choose between the available “Point” and “Gridded” datasets. Additionally, Cryo-TEMPO EOLIS products can be visualised and downloaded from the CS2EO Platform. CryoSat Quaternions Product This product contains the attitude quaternions for the CryoSat-2 mission. It is obtained starting from the corrected mispointing angles measured by the platform star trackers. More information on the product can be found in the Algorithm Description and Product Format Specification documents. The quaternions product can be accessed from the CryoSat CalVal FTPS server via an FTPS client, and are located in the “AUX_PROQUA” folder. Users wishing to access the quaternions products should request a personal account to be created by emailing the CryoSat Mission Geophysicist, Dr. Alessandro Di Bella (alessandro.di.bella@ext.esa.int).
Data - EO Sign In Authentication (Open)
Envisat MERIS Full Resolution - Level 1 [MER_FRS_1P/ME_1_FRG]
The MERIS Level 1 Full Resolution (FR) product contains the Top of Atmosphere (TOA) upwelling spectral radiance measurements. The in-band reference irradiances for the 15 MERIS bands are computed by averaging the in-band solar irradiance of each pixel. The in-band solar irradiance of each pixel is computed by integrating the reference solar spectrum with the band-pass of each pixel. The MERIS FR Level 1 product has Sentinel 3-like format starting from the 4th reprocessing data released to users in July 2020. Each measurement and annotation data file is in NetCDF 4. The Level 1 product is composed of 22 data files: 15 files containing radiances at each band (one band per file), accompanied by the associated error estimates, and 7 annotation data files. The 15 sun spectral flux values provided in the instrument data file of the Level 1 products are the in-band reference irradiances adjusted for the Earth-sun distance at the time of measurement. The band-pass of each pixel is derived from on-ground and in-flight characterisation via an instrument model. The values "Band wavelength" and "Bandwidth" provided in the Manifest file of the Level 1b products are the averaged band-pass of each pixel over the instrument field of view. Auxiliary data are also listed in the Manifest file associated to each product. The Level 1 FR product covers the complete instrument swath. The product duration is not fixed and it can span up to the time interval of the input Level 0 (for a maximum of 20 minutes). Thus the estimated size of the Level 1 FR is dependent on the start/stop time of the acquired segment. During the Envisat mission, acquisition of MERIS Full Resolution data was subject to dedicated planning based on on-demand ordering and coverage of specific areas according to operational recommendations and considerations. See yearly and global density maps to get a better overview of the MERIS FR coverage.
Data - Fast Registration with approval (Restrained)
ERS-1/2 ATSR Averaged Surface Temperature [AT1/AT2_AR__2P]
The Averaged Surface Temperature Product (AST) contains averaged geophysical data at two different resolutions, and with respect to two different averaging schemes: measurement data sets at resolutions of 0.5 by 0.5 degrees and 10 by 10 arcmin with respect to a latitude/longitude grid; other data sets contain data averaged over equal area cells of 50 by 50 km and 17 by 17 km aligned with the satellite ground track. Both top-of-atmosphere and surface data sets are provided. The surface temperature data sets provide, for sea cells, nadir and dual view sea surface temperatures, and for land cells, land surface temperature (currently 11 micron BT) and NDVI. Cloud data is also included. No ADS are included in the AST product; auxiliary data is contained within the MDS. The data sets of the AST product are arranged by surface type and resolution. The 3rd reprocessing of ATSR data was performed in 2013; the processing updates that have been put in place and the scientific improvements are outlined in full in the User Summary Note for the Third ERS ATSR Reprocessing.
Data - Data Description
ERS-1/2 ATSR Meteo Product [AT1/AT2_MET_2P]
The data is a fast delivery Meteo product designed for use by meteorological offices, and contains averaged BT and SST at 10 arc minute resolution. The single MDS comprises the fields of MDS#3 (SST record, 10 arc min cell) of the AST product, with the addition of Average Brightness Temperature (ABT) fields (BT/TOA sea record, 10 arc min cell) to make it more self-contained. The 3rd reprocessing of ATSR data was performed in 2013; the processing updates that have been put in place and the scientific improvements are outlined in full in the User Summary Note for the Third ERS ATSR Reprocessing.
Data - Data Description
ERS-1/2 ATSR ARC L2P/L3U [UPA-L2P_GHRSST/L3U_GHRSST]
The L2P product contains full resolution dual-view Sea Surface Temperature (SST) values. These SST use the ARC SST retrieval and cloud screening which differ from the methods used to produce the Gridded Surface Temperature (ATS_NR__2P) products. In addition to SST, the L2P products contain the ATSR Saharan Dust Index (ASDI) and the clear-sky probability estimated by the ARC cloud detection algorithm. The L2P processor also generates L3U products; these are the L2P products averaged onto a regular grid at 0.1 degree resolution (they are therefore similar to the AR / Meteo Envisat-format products). The L2P and L3U products are provided in NetCDF-4 format following GHRSST Data Specifications (GDS) v2. The L2P/L3U archive has been reprocessed with a new processor based upon the ARC SST; the changes are outlined in full in the L2P Reprocessing User Note.
Data - EO Sign In Authentication (Open)
Envisat MERIS Full Resolution - Level 2 [MER_FRS_2P/ME_2_FRG]
MERIS FR Level 2 is a Full-Resolution Geophysical product for Ocean, Land and Atmosphere. Each MERIS Level 2 geophysical product is derived from a MERIS Level 1 product and auxiliary parameter files specific to the MERIS Level 2 processing. The MERIS FR Level 2 product has Sentinel 3-like format starting from the 4th reprocessing data released to users in July 2020. The data package is composed of NetCDF 4 files containing instrumental and scientific measurements, and a Manifest file which contains metadata information related to the description of the product. A Level 2 product is composed of 64 measurement files containing: 13 files containing Water-leaving reflectance, 13 files containing Land surface reflectance and 13 files containing the TOA reflectance (for all bands except those dedicated to measurement of atmospheric gas - M11 and M15), and several files containing additional measurements on Ocean, Land and Atmospheric parameters and annotation. The Auxiliary data used are listed in the Manifest file associated to each product. The Level 2 FR product covers the complete instrument swath. The product duration is not fixed and it can span up to the time interval of the input Level 0/Level 1. Thus the estimated size of the Level 2 FR is dependent on the start/stop time of the acquired segment. During the Envisat mission, acquisition of MERIS Full Resolution data was subject to dedicated planning based on on-demand ordering and coverage of specific areas according to operational recommendations and considerations. See yearly and global density maps to get a better overview of the MERIS FR coverage.
Data - Fast Registration with approval (Restrained)
ERS-1/2 ATSR Gridded Brightness Temperature/Reflectance [AT1/AT2_TOA_1P]
The Gridded Brightness Temperature/Reflectance (GBTR) product contains top of atmosphere (TOA) brightness temperature (BT) values for the infra-red channels and reflectance values for the visible channels. Values for each channel and for the nadir and forward views occupy separate measurement data sets. Additional MDS contain cloud and land/sea flags and confidence flags for each image pixel. The 3rd reprocessing of ATSR data was performed in 2013; the processing updates that have been put in place and the scientific improvements are outlined in full in the User Summary Note for the Third ERS ATSR Reprocessing.
Data - External Data (Restrained)
ERS-1/2 ATSR ARC Level 3 products [AT1/AT2_AVG_3PAARC]
The recommended ATSR Level 3 products for Sea Surface Temperature (SST) applications are the ARC (ATSR Re-processing for Climate) Level 3 products. ARC reprocesses the ATSR multi-mission archive using new cloud detection and SST retrievals to produce a homogenous record of sea surface temperature. The main ARC objective is to reduce regional biases in retrieved SST to less than 0.1 K for all global oceans while creating a very homogenous record with a stability (lack of drift in the observing system and analysis) of 0.05 K per decade. ARC products are available for ATSR-1, ATSR-2 and AATSR. ARC products are provided in netCDF format and contain data for both the skin SST and the SST estimated for depths of 0.2 and 1.0 m (corresponding approximately to drifter and moored buoy depths). The AATSR estimated depth SSTs are adjusted to a local equatorial crossing time of 10:30 (approximately half an hour after observation), to provide continuity with ATSR-1 and ATSR-2 data. The ARC project was led by Chris Merchant (University of Reading, formerly of the University of Edinburgh) and funded by NERC and the UK Government.
Data - Fast Registration with approval (Restrained)
ERS-1/2 ATSR Gridded Surface Temperature [AT1/AT2_NR__2P]
The Gridded Surface Temperature (GST) Product is the Level 2 full resolution geophysical product. The product contains gridded sea-surface temperature images using both nadir and dual view retrieval algorithms. The product includes pixel latitude/longitude positions, X/Y offset and the results of the cloud-clearing/land-flagging. It contains a single measurement data set the content of which is switchable, that is to say, the content of each pixel field will depend on the surface type. Specifically, the contents of the data fields will depend on the setting of the forward and nadir cloud flags and the land flag. The 3rd reprocessing of ATSR data was performed in 2013; the processing updates that have been put in place and the scientific improvements are outlined in full in the User Summary Note for the Third ERS ATSR Reprocessing.
Data - EO Sign In Authentication (Open)
Envisat MERIS Reduced Resolution - Level 1 [MER_RR__1P/ME_1_RRG]
The MERIS Level 1 Reduced Resolution (RR) product contains the Top of Atmosphere (TOA) upwelling spectral radiance measurements at reduced resolution. The in-band reference irradiances for the 15 MERIS bands are computed by averaging the in-band solar irradiance of each pixel. The in-band solar irradiance of each pixel is computed by integrating the reference solar spectrum with the band-pass of each pixel. The MERIS RR Level 1 product has Sentinel 3-like format starting from the 4th reprocessing data released to users in July 2020. Each measurement and annotation data file is in NetCDF 4. The Level 1 product is composed of 22 measurements data files, 15 files containing radiances at each band (one band per file), accompanied by the associated error estimates, and 7 annotation data files. The band-pass of each pixel is derived from on-ground and in-flight characterisation via an instrument model. The values "Band wavelength" and "Bandwidth" provided in the Manifest file of the Level 1 products are the averaged band-pass of each pixel over the instrument field of view. The Auxiliary data used are listed in the Manifest file associated to each product. MERIS was operating continuously on the day side of the Envisat orbit (descending track). RR data was acquired over 43.5 minutes in each orbit, i.e. 80% of the descending track.
Data - EO Sign In Authentication (Open)
Envisat MERIS Reduced Resolution - Level 2 [MER_RR__2P/ME_2_RRG]
MERIS RR Level 2 is a Reduced Resolution (RR) Geophysical product for Ocean, Land and Atmosphere. Each MERIS Level 2 geophysical product is derived from a MERIS Level 1 product and auxiliary parameter files specific to the MERIS Level 2 processing. The MERIS RR Level 2 product has a Sentinel 3-like format starting from the 4th reprocessing data released to users in July 2020. The data package is composed of NetCDF 4 files containing instrumental and scientific measurements, and a Manifest file, which contains metadata information related to the description of the product. A Level 2 product is composed of 64 measurement files containing mainly: 13 files containing Water-leaving reflectance, 13 files containing Land surface reflectance and 13 files containing the TOA reflectance (for all bands except those dedicated to measurement of atmospheric gas - M11 and M15), and several files containing additional measurement on Ocean, Land and Atmospheric parameters. The Auxiliary data used are listed in the Manifest file associated to each product. MERIS was operating continuously on the day side of the Envisat orbit (descending track). RR data was acquired over 43.5 minutes in each orbit, i.e. 80% of the descending track.
Data - Campaigns (Open)
CryoVEx/ICESat-2 Spring 2019
The ESA Spring CryoVEx/ICESat-2 campaign 2019 was the first CryoVEx campaign since the launch of NASA ICESat-2 in September 2018, and aimed at cross-validating ESA CryoSat-2 and NASA ICESat-2 missions over sea ice and land ice in the Arctic.
Data - Campaigns (Open)
CryoVEx KAREN 2017
The CryoVEx-KAREN 2017 Campaign in the Arctic had the goal to collect unique measurements to help us better understand how sea ice is changing.
Data - Campaigns (Open)
CryoVEx KAREN 2016 Fall
The CryoVEx-KAREN 2016 Fall Campaign in Ilulissat, Greenland had the goal to collect unique measurements to help us better understand how snow and ice on the Greenland ice sheet is changing over time, and help ESA design future space missions to monitor the changing climate in our polar regions.