- Activities
- UV nadir viewing galleries
- Water vapor, clouds, aerosols
Water vapor, clouds, aerosols
Overview
Water vapor, clouds and aerosols
Monitoring of the global distribution of water vapor, clouds and aerosols is essential for the understanding of the Earth's energy budget. All three quantities are interconnected in several ways: for example clouds can form when relative humidity exceeds saturation levels, the properties and amount of aerosols determine cloud properties (acting as cloud condensation nuclei), and precipitation is an effective removal process for aerosols. Because water vapor, clouds and aerosols are also involved in several climate feedback mechanisms they are important for the understanding and prediction of climate change. Water vapor, clouds and aerosols are highly variable making global observations from satellite highly desirable. Although instruments like GOME, SCIAMACHY and OMI (GOME-type instruemnst) were not primarily designed for the observation of these quantities, they can provide very valuable information on the global distribution of water vapor, clouds and aerosols.
Cloud and aerosol observations
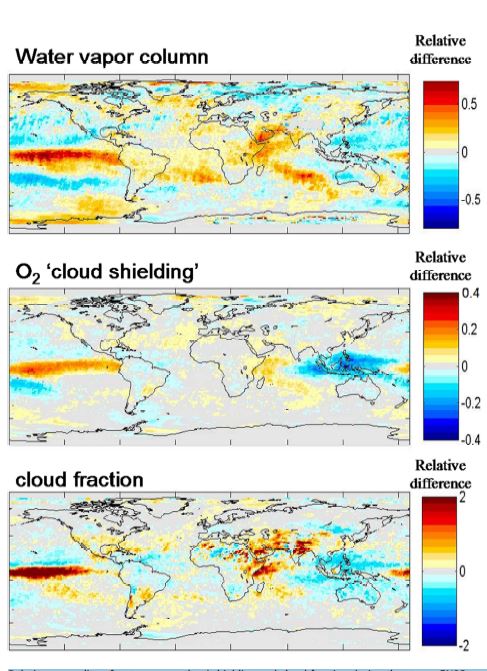
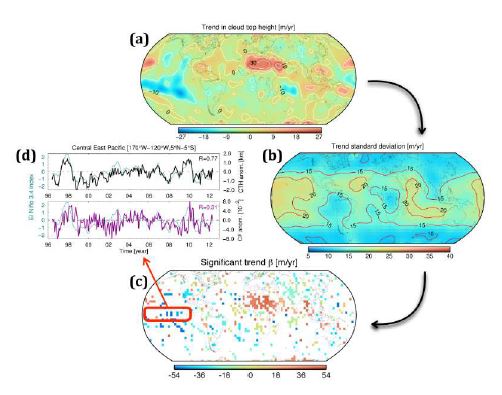
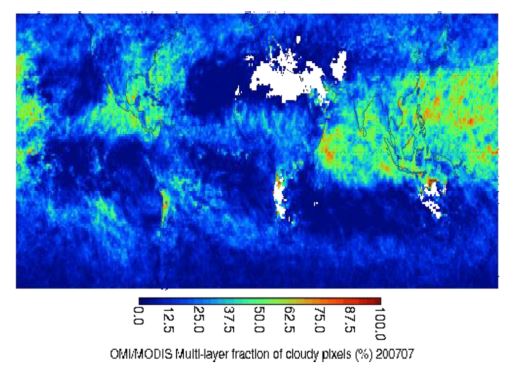
GOME-type instruments measure the backscattered solar radiance over continuous wavelength ranges with moderate spectral resolution. In the recorded ‘earthshine spectra' the fingerprints of many atmospheric trace gases (including water vapor, see below) can be found. However, the wealth of spectral information is achieved at the expense of a coarse spatial resolution (typically of the order of tens to hundreds of km). Thus GOME-type satellite instruments are usually not the preferred instruments for cloud and aerosol retrievals. Cloud and aerosol retrievals are mainly based on radiance measurements from sensors with moderate spatial resolution (and are often based on only one or a limited set of wavelengths). It is interesting to note here that even the spatial resolution of the so called polarization monitoring devises (PMDs) of GOME-type instruments is still much coarser than that of imaging instruments, e.g. MERIS and MODIS. Despite their limited spatial resolution, cloud and aerosol retrievals from GOME-type instruments are also possible. They have important advantages: The measured absorptions of atmospheric oxygen, O2, and the oxygen collisional complex, [O2]2, allow the determination of the cloud height (typically the height of the cloud center), because clouds shield part of the atmosphere below (cf. Kuce et al., 1994; Koelemeijer et al., 2001, Loyola et al., 2007; Kokhanovsky et al., 2007, 2011; Wagner et al., 2008; Lelli et al., 2014). In a similar way, measurements of the Ring effect (i.e. the filling-in of the Fraunhofer lines due to rotational Raman scattering) can be used to derive cloud altitude information (cf. Joiner and Bhartia, 1995¸ Vasilkov et al., 2008). It was shown, that from the combination of such measurements with simultaneous satellite measurements in the thermal IR, information on multi-layer clouds can be derived (Joiner et al., 2010). Such cloud properties are important for the correction of tropospheric trace gas observations from satellite instruments. They also provide useful input for the quantification of the radiative effects of clouds. It is interesting to note that cloud retrievals from GOME-type instruments are usually based on relative quantities (e.g. the depth of an O2 absorption band). Thus the derived cloud and water vapor products are rather insensitive to instrumental degradation and are therefore especially well suited for trend studies (e.g. Wagner et al., 2006; Mieruch et al., 2008, 2014; Lelli et al., 2014).
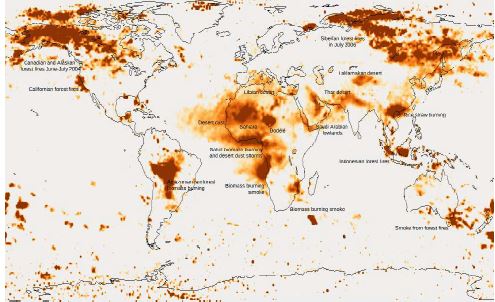
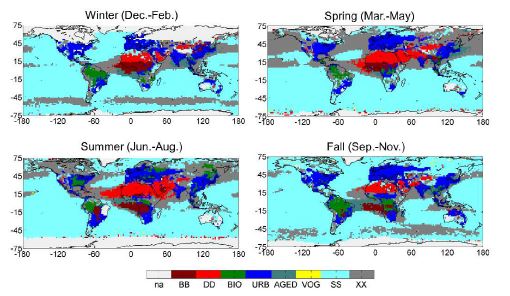
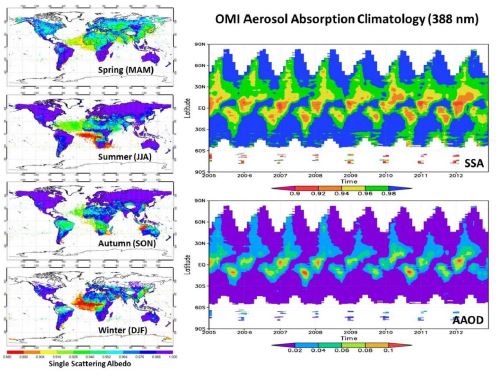
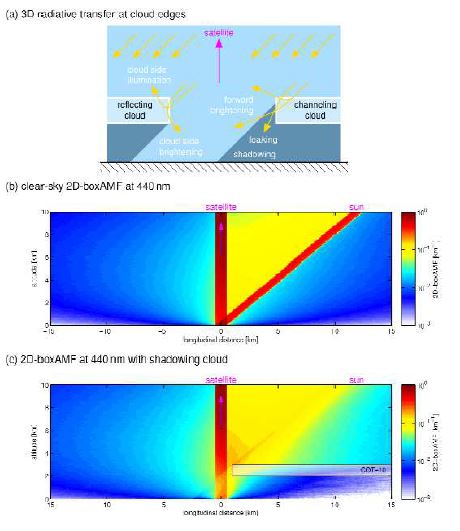
For aerosol retrievals, the large pixel sizes cause particular problems, because aerosol retrievals are heavily influenced by clouds (even for very small cloud fractions). In addition, the surface contribution to the measured top-of-atmosphere reflectance is often uncertain and often larger than the contributions of aerosols. One way around these issues is the use of the Absorbing Aerosol Index (AAI), which is determined from reflectance ratios at selected UV wavelengths (usually around 340 and 380 nm). This method was originally developed for TOMS observations (e.g. Hsu et al., 1996; De Graaf et al., 2005). AAI observations are possible also for cloudy scenes. In fact, if aerosols are located above clouds, the sensitivity towards absorbing aerosols is even increased. AAI measurements are very useful for the detection of biomass burning aerosols and volcanic ash. Recently, it was shown that also non-absorbing aerosols (like sulphate particles or secondary organic aerosols) can be detected by this method (Penning de Vries et al., 2009). However, from these UV aerosol indices (for both absorbing or non absorbing aerosols) quantitative information cannot easily be deduced, since UV aerosol indices (UVAI) depend not only on the aerosol single scattering albedo, but also on the aerosol optical depth and the layer height. In contrast, the most recent quantitative aerosol retrievals using OMI observations are based on more detailed radiative transfer simulations, which allow the simultaneous retrieval of both aerosol optical depth (AOD) and the single scattering albedo (SSA) under cloud free conditions (Torres et al., 2013), and the retrieval of AOD of aerosols above clouds (Torres et al., 2012, Ahn et al., 2014; Jethva et al.,2014). Another recent development is the combination of satellite observations of aerosol properties and trace gas amounts in order to determine aerosol properties and sources on a global scale from satellite observations (Veefkind et al., 2011; Torres et al., 2013; Penning de Vries et al., 2015).
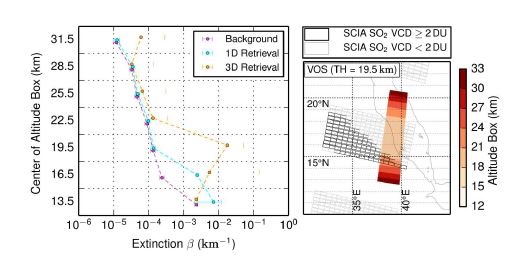
A few studies also derived stratospheric aerosol profiles from SCIAMACHY limb observations (e.g. Ernst et al., 2012, Savigny et al., 2015). Such observations are very important because of their daily global coverage, which is not possible for occultation measurements. Recent studies investigated the effect of non-homogeneous aerosol distributions after strong volcanic eruptions on limb aerosol retrievals and indicated the need to correct for these effects on the retrieved aerosol extinction and layer height (Penning de Vries et al., 2014).
Water vapor observations
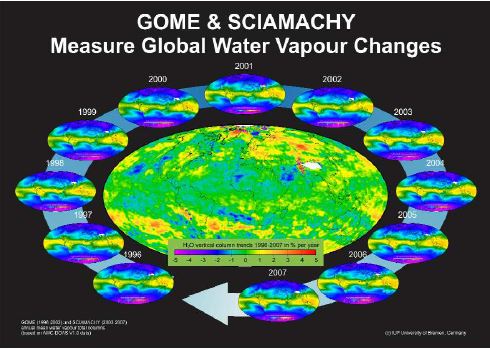
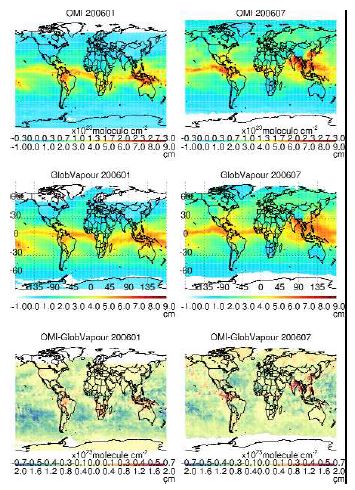
Atmospheric absorptions by water vapor occur in many spectral ranges (from the blue to the near IR) which are covered by GOME-type instruments. In general, the strength of the water vapor absorption increases towards larger wavelengths. Thus, depending on the viewing geometry and the atmospheric water vapor content, different spectral ranges for water vapor retrievals can be selected (e.g. Noël et al., 1999; Casadio et al., 2000; Lang et al., 2003; Wagner et al., 2003; Wagner et al., 2013; Wang et al., 2014). One advantage of water vapor retrievals from GOME-type instruments is that they are sensitive to the surface-near layers, where the water vapor concentrations are highest. In addition, they can be applied over both land and oceans. This allows in particular the study of ENSO-related changes on a global scale (Wagner et al., 2005; Loyola et al., 2006). A fundamental disadvantage of these retrievals is the relatively strong influence of clouds, which can cause large uncertainties for individual observations.
Compared to other tropospheric trace gases, the retrieval of the atmospheric water vapor column is challenging in several aspects: In many spectral ranges, the water vapor absorptions are quite strong. Thus saturation effects have to be corrected, and also the radiative transfer is rather complex (in principle line by line calculations are required). Thus for many retrieval algorithms the determination of appropriate AMFs is not based on radiative transfer simulations but on simultaneous measurements of the oxygen absorption (e.g. Wagner et al., 2005; Noël et al., 2004). This approach leads to very ‘stable' water vapor products, which are almost independent of external information and thus well suited for trend studies. Future water vapor retrieval algorithms will include full radiative transfer simulations, which will improve the accuracy for individual observations.
References and further readings
- Acarreta, J.R., J.F. de Haan and P. Stammes, Cloud pressure retrieval using the O2-O2 absorption band at 477 nm, J. Geophys. Res., 2004, 109, doi:10.1029/2003JD003915.
- Ahn, C., O. Torres, and H. Jethva (2014), Assessment of OMI near-UV aerosol optical depth over land, J. Geophys. Res. Atmos., 119, 2457–2473, doi:10.1002/2013JD020188.
- Casadio, S., Zehner, C., Pisacane, G., and Putz, E., Empirical retrieval of the atmospheric air mass factor (ERA) for the measurement of water vapour vertical content using GOME data, Geophys. Res. Lett., 27, 1483–1486, 2000.
- Ernst, F., von Savigny, C., Rozanov, A., Rozanov, V., Eichmann, K.-U., Brinkhoff, L. A., Bovensmann, H., and Burrows, J. P.: Global stratospheric aerosol extinction profile retrievals from SCIAMACHY limb-scatter observations, Atmos. Meas. Tech. Discuss., 5, 5993-6035, doi:10.5194/amtd-5-5993-2012, 2012.
- Fournier, N., P. Stammes, M. de Graaf, R. van der A, A. Piters, M. Grzegorski, A. Kokhanovsky, Improving cloud information over deserts from SCIAMACHY Oxygen A-band measurements, ACP, p163-172, 2006.
- de Graaf, M., Stammes, P., Torres, O., and Koelemeijer, R. B. A.: Absorbing Aerosol Index — Sensitivity analysis, application to GOME and comparison with TOMS, J. Geophys. Res., 110, D01202, doi:10.1029/2004JD005178, 2005.
- Grossi, M., Valks, P., Loyola, D., Aberle, B., Slijkhuis, S., Wagner, T., Beirle, S., and Lang, R.: Total column water vapour measurements from GOME-2 MetOp-A and MetOp-B, Atmos. Meas. Tech., 8, 1111-1133, doi:10.5194/amt-8-1111-2015, 2015.
- Grzegorski, M., M. Wenig, U. Platt, P. Stammes, N. Fournier, T. Wagner, The Heidelberg iterative cloud retrieval utilities (HICRU) and its application to GOME data, Atmos. Chem. Phys., 6, 4461-4476, 2006.
- Holzer-Popp, T., Schroedter-Homscheidt, M., Breitkreuz, H., Martynenko, D., and Klüser, L.: Improvements of synergetic aerosol retrieval for ENVISAT, Atmos. Chem. Phys., 8, 7651-7672, doi:10.5194/acp-8-7651-2008, 2008.
- Hsu, N. C., Herman, J. R., Bhartia, P. K., Seftor, C. J., Torres, O., Thompson, A. M., Gleason, J. F., Eck, T. F., and Holben, B. N.: Detection of biomass burning smoke from TOMS measurements, Geophys. Res. Lett., 23, 745–748, 1996.
- Jethva, H., O. Torres, and C. Ahn, Global assessment of OMI aerosol single-scattering albedo using ground-based AERONET inversion, J. Geophys. Res. Atmos., 119, doi:10.1002/2014JD021672, 2014.
- Joiner, J., P. K. Bhartia, The determination of cloud pressures from rotational Raman scattering in satellite backscatter ultraviolet measurements, J. Geophys. Res., 100, 23019–23026, 1995.
- Joiner, J., Vasilkov, A. P., Bhartia, P. K., Wind, G., Platnick, S., and Menzel, W. P.: Detection of multi-layer and vertically-extended clouds using A-train sensors, Atmos. Meas. Tech., 3, 233-247, doi:10.5194/amt-3-233-2010, 2010.
- Koelemeijer, R. B. A., P. Stammes, J. W. Hovenier, and J. F. de Haan: A fast method for retrieval of cloud parameters using oxygen A band measurements from the Global Ozone Monitoring Experiment, J. Geophys. Res. 106, 3475-3490, 2001
- Koelemeijer, R. B. A., P. Stammes, J. W. Hovenier, and J. F. de Haan: Global distributions of effective cloud fraction and cloud top pressure derived from oxygen A band spectra measured by the Global Ozone Monitoring Experiment: comparison to ISCCP data, J. Geophys. Res. 107, doi 10.1029/2001JD000840, 2002
- Kokhanovsky, A. A., Rozanov, V. V., Zege, E. P., Bovensmann, H., and Burrows, J. P.: A semianalytical cloud retrieval algorithm using backscattered radiation in 0.4–2.4μm spectral region, J. Geophys. Res., 108, 4008, doi:10.1029/2001JD001543, 2003.
- Kokhanovsky, A.A., and Rozanov, V.V. The physical parameterization of the top of atmosphere reflection function for a cloudy atmosphere-underlying surface system: The oxygen A-band case study. J. Quant. Spectrosc. Radiative Transfer, 85, 35-55, 2004.
- Kokhanovsky, A.A., Vountas, M., Rozanov, V.V., Lotz, W., Bovensmann, H., Burrows, J.P.; Schumann, U.: Global cloud top height and thermodynamic phase distribution as obtained by SCIAMACHY on ENVISAT, Int. J. Remote Sens., 28, 4499-4507, 2007.
- Kokhanovsky, A., M. Vountas, J.P. Burrows: Global Distribution of Cloud Top Height as Retrieved from SCIAMACHY Onboard ENVISAT Spaceborne Observations, Remote Sensing, 3, 836-844, doi: 10.3390/rs3050836, 2011.
- Kurosu, T., Chance, K., and Spurr, R. J. D.: Cloud Retrieval Algorithm for the European Space Agency’s Global Ozone Monitoring Experiment, in: Proceedings of SPIE, EUROPTO Series: Satellite Remote Sensing of Clouds and the Atmosphere III, ed.: Russel, J. E., 495, 17–26, 1998.
- Kuze, A. and Chance, K. V.: Analysis of cloud-top height and cloud coverage from satellites using the O2 A and B bands, J. Geophys. Res., 99, 14482–14491, 1994.
- Lang, R., Williams, J. E., van der Zande, W. J., and Maurellis, A.N.: Application of the Spectral Structure Parameterization technique: retrieval of total water vapour columns from GOME, Atmos. Chem. Phys., 3, 145–160, 2003.
- Lelli L., Kokhanovsky A.A., Rozanov V.V., Vountas M. and J.-P. Burrows: Linear trends in cloud top height from passive observations in the oxygen A-band, Atmos. Chem. Phys., 14, 5679–5692, doi:10.5194/acp-14-5679-2014, 2014.
- Loyola, D.: A New Cloud Recognition Algorithm for Optical Sensors, in: IEEE International Geoscience and Remote Sensing Symposium, Seattle, II, 572–574, 1998.
- Loyola, D., P. Valks, T. Ruppert, A. Richter, T. Wagner, W. Thomas, R. van der A, R. Meisner: The 1997 El Niño impact on clouds, water vapour, aerosols and reactive trace gases in the troposphere, as measured by the Global Ozone Monitoring Experiment, Adv. Geosci., 6, 267 – 272, 2006.
- Loyola D., Thomas W., Spurr, R., B. Mayer: Global patterns in daytime cloud properties derived from GOME backscatter UV-VIS measurements, Int. J. Remote Sens., 31, 16, 4295-4318, 2010.
- Loyola D., Thomas W., Livschitz Y., Ruppert T., Albert P., Hollmann. R.: Cloud properties derived from GOME/ERS-2 backscatter data for trace gas retrieval, IEEE Transactions Geosci. Remote Sens., 45, 2747-2758, 2007.
- Maurellis, A.N., R. Lang, W.J. van der Zande, I. Aben, W. Ubachs: Precipitable Water Column Retrieval from GOME data, Geophys. Res. Lett., 27, 903-906, 2000.
- Mieruch, S., S. Noël, H. Bovensmann and J. P. Burrows: Analysis of global water vapour trends from satellite measurements in the visible spectral range, Atmos. Chem. Phys., 8, 491-504, 2008.
- Mieruch, S., S. Noël, H. Bovensmann, J. P. Burrows and J. A. Freund: Markov chain analysis of regional climates, Nonlin. Processes Geophys., 17, 651-661, doi: 10.5194/npg-17-651-2010, 2010a.
- Mieruch, S., M. Schröder, S. Noël and J. Schulz, Comparison of monthly means of global total column water vapor retrieved from independent satellite observations, J. Geophys. Res., 115, D23310, doi: 10.1029/2010JD013946, 2010b.
- Mieruch, S., S. Noël, M. Reuter, H. Bovensmann, J.P. Burrows, M. Schröder, and J. Schulz: A new method for the comparison of trend data and application to water vapor, J. Clim., 24, 12, 3124-3141, doi: 10.1175/2011JCLI3669.1, 2011.
- Mieruch, S., M. Schröder, S. Noël and J. Schulz: Comparison of decadal global water vapor changes derived from independent satellite time series, J. Geophys. Res. Atmos., 119, 12,489-12,499, ISSN 2169-8996, doi: 10.1002/2014JD021588, 2014.
- Noël, S., M. Buchwitz, H. Bovensmann, R. Hoogen and J. P. Burrows, Atmospheric water vapor amounts retrieved from GOME satellite data, Geophys. Res. Lett., 26, 1841-1844, 1999.
- Noël, S., M. Buchwitz and J. P. Burrows: First retrieval of global water vapour column amounts from SCIAMACHY measurements, Atmos. Chem. Phys., 4, 111-125, 2004.
- Noël, S., M. Buchwitz, H. Bovensmann and J. P. Burrows: Validation of SCIAMACHY AMC-DOAS water vapour columns, Atmos. Chem. Phys., 5, 1835-1841, 2005.
- Noël, S., S. Mieruch, H. Bovensmann and J. P. Burrows: Preliminary results of GOME-2 water vapour retrievals and first applications in polar regions, Atmos. Chem. Phys., 8, 1519-1529, 2008.
- Palm, M., C. Melsheimer, S. Noël, S. Heise, J. Notholt, J. Burrows and O. Schrems: Integrated water vapor above Ny Ålesund, Spitsbergen: a multisensor intercomparison, Atmos. Chem. Phys., 10, 1215-1226, 2010.
- Penning de Vries, M. J. M., Beirle, S., and Wagner, T.: UV Aerosol Indices from SCIAMACHY: introducing the SCattering Index (SCI), Atmos. Chem. Phys., 9, 9555-9567, 2009.
- Penning de Vries, M. and Wagner, T.: Modelled and measured effects of clouds on UV Aerosol Indices on a local, regional, and global scale, Atmos. Chem. Phys., 11, 12715-12735, doi:10.5194/acp-11-12715-2011, 2011.
- Penning de Vries, M. J. M., Dörner, S., Puķīte, J., Hörmann, C., Fromm, M. D., and Wagner, T.: Characterisation of a stratospheric sulfate plume from the Nabro volcano using a combination of passive satellite measurements in nadir and limb geometry, Atmos. Chem. Phys., 14, 8149-8163, doi:10.5194/acp-14-8149-2014, 2014.
- Penning de Vries, M. J. M., Beirle, S., Hörmann, C., Kaiser, J. W., Stammes, P., Tilstra, L. G., Tuinder, O. N. E., and Wagner, T.: A global aerosol classification algorithm incorporating multiple satellite data sets of aerosol and trace gas abundances, Atmos. Chem. Phys., 15, 10597-10618, doi:10.5194/acp-15-10597-2015, 2015.
- du Piesanie, A., A. J. M. Piters, I. Aben, H. Schrijver, P. Wang and S. Noël, Validation of two independent retrievals of SCIAMACHY water vapour columns using radiosonde data, Atmos. Meas. Tech., 6, 2925-2940, doi: 10.5194/amt-6-2925-2013, 2013.
- Rozanov, V. V. and Kokhanovsky, A. A.: Semianalytical cloud retrieval algorithm as applied to the cloud top altitude and the cloud geometrical thickness determination from top-of-atmosphere reflectance measurements in the oxygen A band, J. Geophys. Res., 109D5, D05202, doi:10.1029/2003JD004104, 2004.
- Sanghavi, S., Martonchik, J. V., Landgraf, J., and Platt, U.: Retrieval of the optical depth and vertical distribution of particulate scatterers in the atmosphere using O2 A- and B-band SCIAMACHY observations over Kanpur: a case study, Atmos. Meas. Tech., 5, 1099-1119, doi:10.5194/amt-5-1099-2012, 2012.
- von Savigny, C., F. Ernst, A. Rozanov, R. Hommel, K.-U. Eichmann, V. Rozanov, J. P. Burrows, and L. W. Thomason, Improved stratospheric aerosol extinction profiles from SCIAMACHY: Validation and sample results, Atmos. Meas. Tech. Discuss., 8, 8353-8383, 2015.
- Tilstra, L. G., de Graaf, M., Aben, I. and Stammes, P.: In-flight degradation correction of SCIAMACHY UV reflectances and Absorbing Aerosol Index, J. Geophys. Res., 117, D06209, doi:10.1029/2011JD016957, 900 2012.
- Torres, O, H. Jethva, and P.K. Bhartia: Retrieval of Aerosol Optical Depth above Clouds from OMI Observations: Sensitivity Analysis and Case Studies, Journal. Atm. Sci., 69, 1037-1053, doi:10.1175/JAS-D-11-0130.1, 2012.
- Torres, O., Ahn, C., and Chen, Z.: Improvements to the OMI near-UV aerosol algorithm using A-train CALIOP and AIRS observations, Atmos. Meas. Tech., 6, 3257-3270, doi:10.5194/amt-6-3257-2013, 2013.
- Tuinder, O. N. E., de Winter-Sorkina, R., and Builtjes, P. J. H.: Retrieval methods of effective cloud cover from the GOME instrument: an intercomparision, Atmos. Chem. Phys., 4, 255–273, 2004.
- Van Malderen, R., Brenot, H., Pottiaux, E., Beirle, S., Hermans, C., De Mazière, M., Wagner, T., De Backer, H., and Bruyninx, C.: A multi-site intercomparison of integrated water vapour observations for climate change analysis, Atmos. Meas. Tech., 7, 2487-2512, doi:10.5194/amt-7-2487-2014, 2014.
- Vasilkov, A. P., J. Joiner, R. Spurr, P. K. Bhartia, P. F. Levelt, and G. Stephens: Evaluation of the OMI cloud pressures derived from rotational Raman scattering by comparisons with satellite data andradiative transfer simulations, J. Geophys. Res., 113, D15S19, doi:10.1029/2007JD008689, 2008.
- Veefkind, J. P., Boersma, K. F., Wang, J., Kurosu, T. P., Krotkov, N., Chance, K., and Levelt, P. F.: Global satellite analysis of the relation between aerosols and short-lived trace gases, Atmos. Chem. Phys., 11, 1255-1267, doi:10.5194/acp-11-1255-2011, 2011.
- Wagner, T., J. Heland, M. Zöger, and U. Platt: A fast H2O total column density product from GOME - validation with in-situ aircraft measurements, Atmos. Chem. Phys. Discuss., 3, 323-353, 2003.
- Wagner, T., S. Beirle, M. Grzegorski, S. Sanghavi, U. Platt: El-Niño induced anomalies in global data sets of water vapour and cloud cover derived from GOME on ERS-2, J. Geophys. Res, 110, D15104, doi:10.1029/2005JD005972, 2005.
- Wagner T., S. Beirle, M. Grzegorski, U. Platt: Global trends (1996–2003) of total column precipitable water observed by Global Ozone Monitoring Experiment (GOME) on ERS-2 and their relation to near-surface temperature, J. Geophys. Res., 111, D12102, doi:10.1029/2005JD006523, 2006.
- Wagner, T., S. Beirle, T. Deutschmann, M. Grzegorski, and U. Platt: Dependence of cloud properties derived from spectrally resolved visible satellite observations on surface temperature, Atmos. Chem. Phys., 8, 2299-2312, doi:10.5194/acp-8-2299-2008, 2008.
- Wagner, T., Beirle, S., and Deutschmann, T.: Three-dimensional simulation of the Ring effect in observations of scattered sun light using Monte Carlo radiative transfer models, Atmos. Meas. Tech., 2, 113-124, 2009.
- Wagner, T., Beirle, S., Deutschmann, T., and Penning de Vries, M.: A sensitivity analysis of Ring effect to aerosol properties and comparison to satellite observations, Atmos. Meas. Tech., 3, 1723-1751, doi:10.5194/amt-3-1723-2010, 2010.
- Wagner, T., Beirle, S., Sihler, H., and Mies, K.: A feasibility study for the retrieval of the total column precipitable water vapour from satellite observations in the blue spectral range, Atmos. Meas. Tech., 6, 2593-2605, doi:10.5194/amt-6-2593-2013, 2013.
- Wang, H., Liu, X., Chance, K., González Abad, G., and Chan Miller, C.: Water vapor retrieval from OMI visible spectra, Atmos. Meas. Tech., 7, 1901-1913, doi:10.5194/amt-7-1901-2014, 2014.
- Wang, P., P. Stammes, R. van der A, G. Pinardi, M. van Roozendael, FRESCO+: an improved O2 A-band cloud retrieval algorithm for tropospheric trace gas retrievals, Atmospheric Chemistry and Physics, 8, 6565-6576, 2008.
- Wang, P., Stammes, P., and Mueller, R., Surface solar irradiance from SCIAMACHY measurements: algorithm and validation, Atmos. Meas. Tech., 4, 875-891, doi:10.5194/amt-4-875-2011, 2011.