- Activities
- UV nadir viewing galleries
- Natural emission and hazards
Natural emission and hazards
Overview
Natural emission and hazards
Owing to their sensitivity in large range of altitudes down to the surface, nadir UV/visible satellite sensors are well suited to monitor the atmospheric composition in both the troposphere and stratosphere. Emissions, which to a large part control the chemical state of the atmosphere, can originate from both natural and anthropogenic sources. Whilst man-made pollution and poor air quality is a major environmental concern, there are many natural sources of pollution which are often greater than their man-made counterparts and sometimes may be a source of hazards for humans on Earth. Relevant trace gases which can be measured by UV/visible spectroscopy are sulfur dioxide (SO2), formaldehyde (H2CO), glyoxal (CHOCHO), NO2, ozone, absorbing aerosols and the halogen oxides BrO and IO.
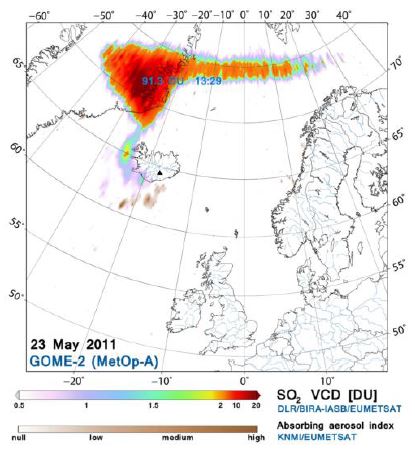
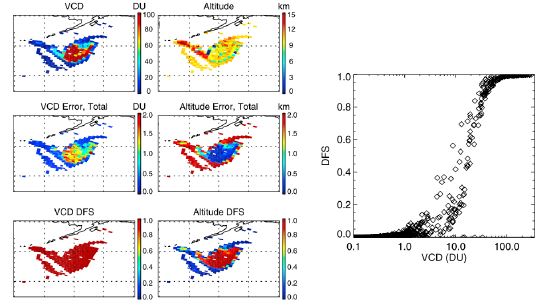
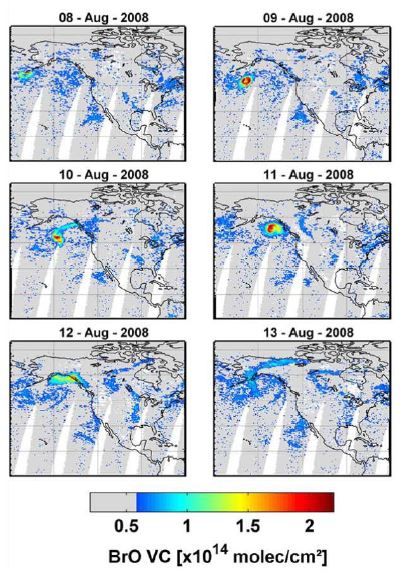
A major natural source of SO2 and particles is related to volcanic activity. Volcanic eruptions emit large amounts of ash and gases which can sometimes have severe implications for life on Earth and human society. Volcanic clouds can also have a significant impact on atmospheric chemistry and climate, both locally and on a global scale. For obvious reasons, volcanic ash and – to a lesser extent – sulfuric gases are major hazards to aviation. As a result, near-real-time satellite measurements of SO2 and aerosol index (a good proxy for volcanic ash) have developed as an essential component of operational early warning systems such as the SACS (Support to Aviation Control System, http://sacs.aeronomie.be), which provides support to Volcanic Ash Advisory Centres (VAACs) designated to advise civil aviation authorities in case of volcanic eruptions. UV/visible space nadir observations have also contributed to a better understanding of the chemical composition of the volcanic plumes, through the unambiguous detection of several halogenated compounds such as BrO, IO and OClO.
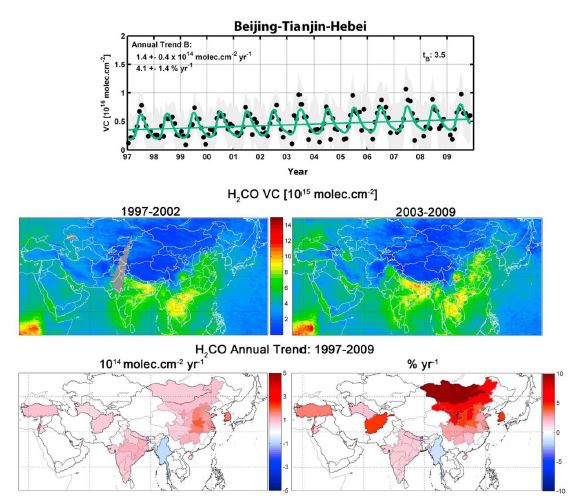
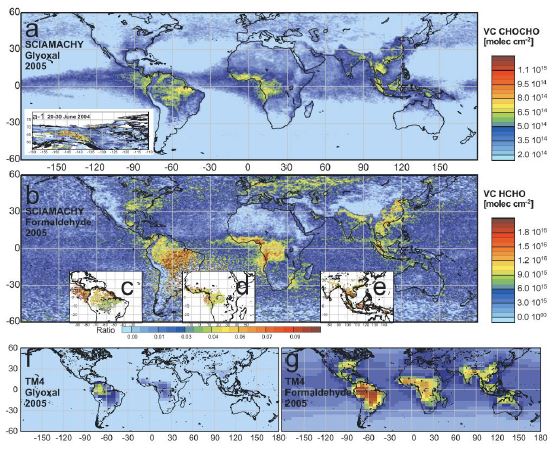
Volatile organic compounds (VOCs) are another example of species naturally produced, in this case, by plants and trees as well as by fires and biomass burning processes. Isoprene in particular is a common VOC emitted in large quantities by vegetation, suspected to trigger asthma and other allergic reactions. Natural and anthropogenic emissions of VOCs can be inferred from space-based measurements of H2CO and glyoxal, which are both short-lived intermediate product common to the degradation of many VOCs. Monitoring the spatial and temporal variability of VOCs is essential since, together with NOx, they control the formation of tropospheric ozone and indirectly also secondary organic aerosols. For these reasons, H2CO satellite observations (and more recently also glyoxal) have been increasingly used in combination with global chemistry transport models to constrain VOC emissions.
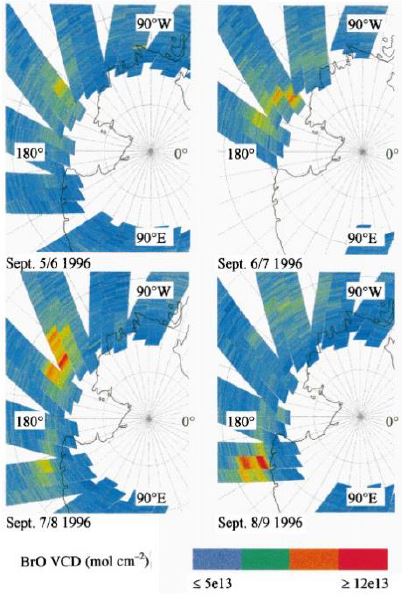
Another important contribution of UV/visible spectroscopy to the monitoring of natural emissions concerns the identification of the role of reactive halogen compounds on polar tropospheric ozone. Following the so-called ‘polar bromine explosion' mechanism which catalytically releases massive amounts of inorganic bromine in the Spring boundary layer of both hemispheres, halogen oxide mixing ratios of up to 30 parts per trillion are produced, sufficient to destroy within one to two days the 30–40 parts per billion of ozone typically present in the boundary layer – leading to a ‘tropospheric ozone hole'. The systematic monitoring by sensors like GOME and SCIAMACHY of the spatial extent and variability of the BrO plumes responsible of the ozone destruction has allowed to significantly progress in the understanding of this phenomenon.
Chapter Editor
Michel van Roozendael (BIRA)
Contributors
Nicolas Theys (BIRA), Isabelle De Smedt (BIRA), Folkard Wittrock (U. Bremen), T. Wagner (MPIC), C. Nowlan (SAO)
References and further readings
- Brenot, H., Theys, N., Clarisse, L., van Geffen, J., van Gent, J., Van Roozendael, M., van der A, R., Hurtmans, D., Coheur, P.-F., Clerbaux, C., Valks, P., Hedelt, P., Prata, F., Rasson, O., Sievers, K., Zehner, C.: Support to Aviation Control Service (SACS): an online service for near-real-time satellite monitoring of volcanic plumes, Nat. Hazards Earth Syst. Sci., 14, 1099–1123, doi:10.5194/nhess-14-1099-2014, 2014.
- De Smedt, I., T. Stavrakou, J.-F. Müller, R. van der A, and M. Van Roozendael: Trend detection in satellite observations of formaldehyde tropospheric columns, Geophys. Res. Lett., 37, L18808, doi:10.1029/2010GL044245, 2010.
- Nowlan, C. R., X. Liu, K. Chance, Z. Cai, T. P. Kurosu, C. Lee, and R. V. Martin: Retrievals of sulfur dioxide from the Global Ozone Monitoring Experiment 2 (GOME-2) using an optimal estimation approach: Algorithm and initial validation, J. Geophys. Res., 116, D18301, doi:10.1029/2011JD015808, 2011.
- Theys, N., M. Van Roozendael, B. Dils, F. Hendrick, N. Hao, and M. De Mazière: First satellite detection of volcanic bromine monoxide emission after the Kasatochi eruption, Geophys. Res. Lett., 36, L03809, doi:10.1029/2008GL036552, 2009.
- Wagner, T., and U. Platt: Satellite mapping of enhanced BrO concentrations in the troposphere, Nature, 395, 486–490, 1998.
- Wittrock, F., A. Richter, H. Oetjen, J. P. Burrows, M. Kanakidou, S. Myriokefalitakis, R. Volkamer, S. Beirle, U. Platt, and T. Wagner: Simultaneous global observations of glyoxal and formaldehyde from space, Geophys. Res. Lett., 33, 1–5, doi:10.1029/2006GL026310, 2006.