- Activities
- UV nadir viewing galleries
- Strato and Troposhperic Ozone
Strato and Troposhperic Ozone
Overview
Stratospheric and Troposhperic Ozone
The largest amount of ozone molecules (O3) is found in the stratosphere with about 90 % of it at altitudes between 15 and 30 km. Stratospheric ozone filters out a large part of the ultraviolet (UV) radiation emitted by the sun, protecting life on Earth. Enhanced UV-B radiation (280 to 320 nm) can have a negative impact on photosynthesis, cause skin cancer and weaken the immune system. On the other hand, absorption of solar UV radiation by stratospheric O3 causes the temperature of the stratosphere to increase with height, creating a stable layer that limits strong vertical air movement. This plays a key role for Earth's climate system (Dameris and Loyola, 2012).
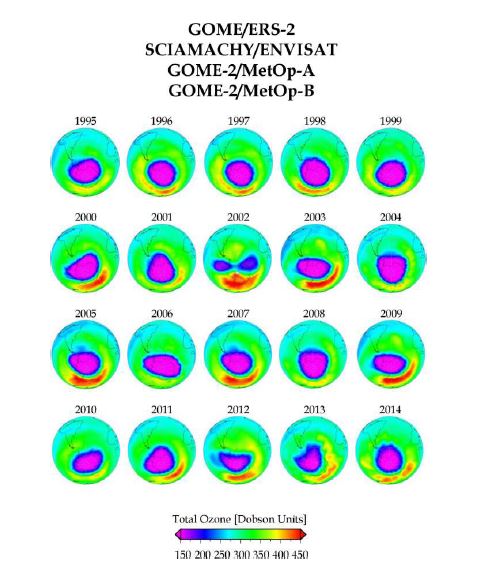
Following the discovery of the Antarctic ozone hole in 1985, an international agreement known as Montreal Protocol was reached in 1987 to progressively phase out the use of ozone-depleting chemicals. Conducted under the auspices of the World Meteorological Organization (WMO) and the United Nations Environment Programme (UNEP), the Scientific Assessment of Ozone Depletion periodically update governments on the latest scientific findings related to the ozone layer using satellite and ground-based measurements as well as model simulations. The last report released in 2014 indicates that stratospheric ozone depletion has leveled off and is showing telltale signs of recovery.
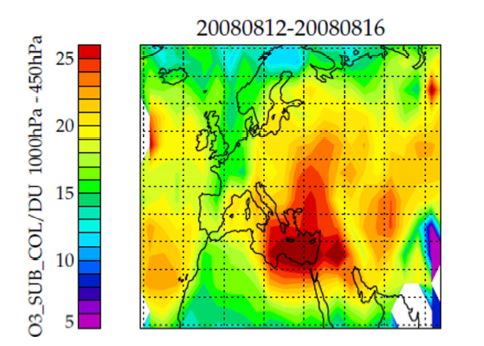
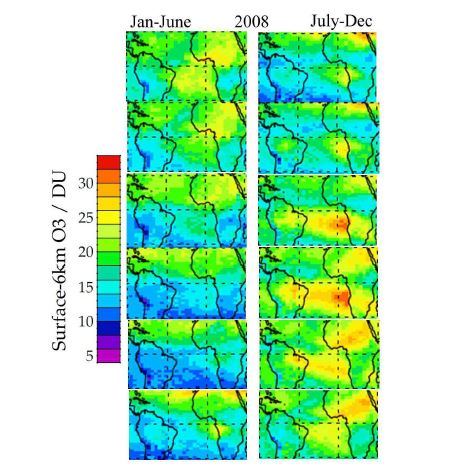
Tropospheric ozone is a secondary pollutant, formed from the gaseous emissions from fossil fuel or biomass burning - nitrogen oxides (NOx) and volatile organic compounds (VOCs) - and sunlight. Some tropospheric ozone also finds its way to the troposphere via stratospheric-tropospheric exchange, where air from each layer mixes dynamically. This is particularly the case in the midlatitudes. Ozone in the troposphere is also a greenhouse gas. High levels of ozone have been linked to increased mortality/excess deaths when associated with localised heat wave events. Tropospheric ozone can be harmful to agriculture by increasing the failure rate of crops by damaging leaves. For these reasons, it is vitally important to monitor ozone in the troposphere as well as the stratosphere, but in situ surface observations and ozonesondes are sparse and heavily favour the Northern Hemisphere. With satellite data from GOME, SCIAMACHY and GOME-2, we are able to monitor tropospheric ozone globally every day.
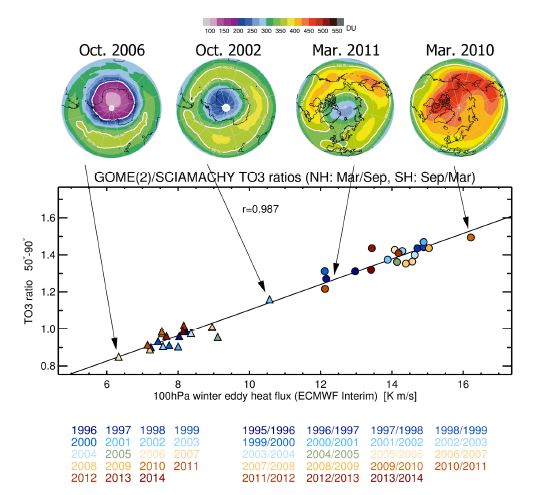
The ozone layer's thickness is not solely controlled by chemical processes in the stratosphere. As an atmospheric trace gas, O3 is also transported over large distances by stratospheric winds, which significantly affects global ozone distribution. Dynamic and chemical processes in the atmosphere interact in highly complex ways. Radiative processes also play a crucial role since O3 is one of the most important radiatively active gases in the atmosphere. It absorbs both shortwave and longwave radiation and thus influences the vertical temperature distribution of the stratosphere.
Chapter Editor
Diego Loyola (DLR)
Contributors
Melanie Coldewey-Egbers (DLR), Georgina Miles (STFC RAL), Mark Weber (U. Bremen)
References and further readings
- Coldewey-Egbers, M., D. Loyola, P. Braesicke, M. Dameris, M. van Roozendael, C. Lerot, and W. Zimmer, A new health check of the ozone layer at global and regional scales, Geophys. Res. Lett., 41, 4363-4372, doi 10.1002/2014GL060212, 2014.
- Dameris, M. and D. Loyola: Recent and future evolution of the stratospheric ozone layer, Chapter 45 in Atmospheric Physics, Background-Methods-Trends, Ed. U. Schumann, Springer, Heidelberg, ISBN 978-3-642-30182-7, doi: 10.1007/978-3-642-30183-4, pp.747-761, 2012
- Miles G. M., R. Siddans, B. J. Kerridge, B. G. Latter, and N. A. D. Richards, Tropospheric ozone and ozone profiles retrieved from GOME-2 and their validation, Atmos. Meas. Tech., 8, 385–398, 2015.
- Weber, M., S. Dikty, J. P. Burrows, H. Garny, M. Dameris, A. Kubin, J. Abalichin, and U. Langematz, The Brewer-Dobson circulation and total ozone from seasonal to decadal time scales, Atmos. Chem. Phys., 11, 11221-11235, doi:10.5194/acp-11-11221-2011, 2011.
- Weber, M., W. Steinbrecht, C. Roth, M. Coldewey-Egbers, R. J. van der A, D. Degenstein, V. E. Fioletov, S. M. Frith, L. Froidevaux, C. S. Long, D. Loyola, and J. D. Wild, [Global Climate] Stratospheric ozone [in "State of the Climate in 2014"], Bull. Amer. Meteor. Soc., 96, S44–S46, 2015.
- WMO (World Meteorological Organization), Scientific Assessment of Ozone Depletion: 2014, Global Ozone Research and Monitoring Project–Report No. 55, Geneva, Switzerland, url: http://www.wmo.int/pages/prog/arep/gaw/ozone_2014/ozone_asst_ report.html, 2014.