- Activities
- UV nadir viewing galleries
- Air Quality
Air Quality
Overview
Air Quality
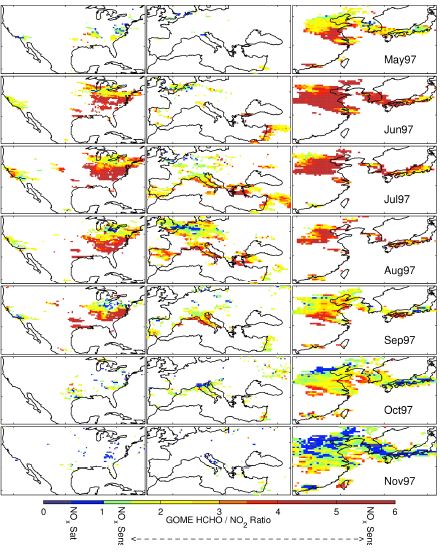
One of the main advantages of nadir UV/visible satellite observations is their ability to probe the atmosphere down to the surface where air pollution affects human health directly. Although the number of species that can be observed in the UV/vis spectral region is limited, it turns out that several key parameters of air quality can be detected, including NO2, ozone, formaldehyde, sulphur dioxide and aerosols.
Historically, air pollution first was a problem linked to fires, used outdoors for land clearing and agriculture and indoors for cooking. With the onset of industrialisation, sulphur dioxide became important as result of smeltering and the burning of sulphur rich coal for energy and heating. In combination with humidity, sulphuric acid is formed which lead to the infamous winter smog (smoke and fog) in London, killing more than 4000 people in London in just 5 days in 1952. A completely different type of smog is formed in summer in warm and sunny conditions when active photochemistry of nitrogen oxides and volatile organic compounds leads to the formation of ozone and other photo-oxidants. As the London smog, this so called Los Angeles smog has adverse effects on humans but also on plants.
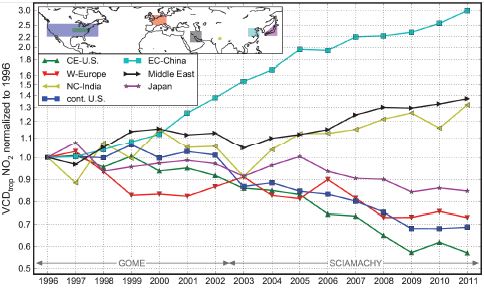
Technical measures to limit sulphur dioxide emissions have much reduced the occurrence of winter smog in the industrialised countries. This was supported by a switch from coal to cleaner fuels and a displacement of heavy industry towards Asia. Summer smog on the other side remained a problem as an ever growing number of cars and increasing energy need leads to high NOx levels in spite of attempts to reduce both, NOx and VOC emissions. Over the last two decades, rapid changes happened, in particular in Asia where strong economic developments in China and in other countries lead to an unprecedented increase in air pollution. At the same time, air quality in Europe, the US and Japan improved significantly as environmental regulation continuously tightened air quality standards. In recent years, China has undertaken large efforts to follow this path and first signs of improvement in air quality have been reported.
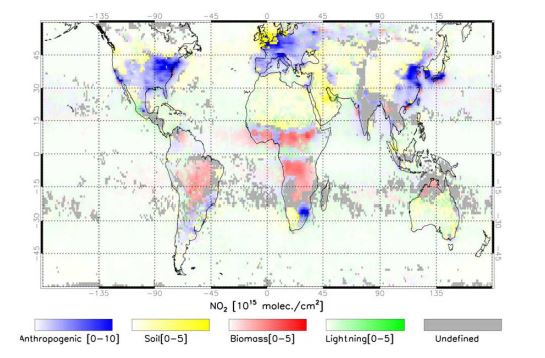
Nitrogen dioxide is the most studied air quality related satellite data product, and many exciting and novel applications of satellite data have been demonstrated on this species. This success is based on the strong and structured absorption signal which can be easily retrieved in the blue part of the spectrum where Rayleigh scattering is not as large as in the UV. This is important as the sensitivity of nadir satellite observations decreases towards the surface as result of scattering, and this effect is more pronounced at shorter wavelengths. While the change in sensitivity can be accounted for in the retrieval, the fact that for most species, no vertical distribution can be derived but only an integrated tropospheric column is a challenge for the use of satellite data in air quality applications. On the other hand, integrated columns have several advantages for atmospheric chemistry applications in comparison to in-situ observations as they do not depend on changes in boundary layer height and properly account for elevated pollution layers.
Chapter Editor
Andreas Richter (U. Bremen)
Contributors
Steffen Beirle (MPIC), Andreas Hilboll (U. Bremen), S.-W. Kim (NCAR), Randall Martin (U. Dalhousie), Ronald van der A (KNMI)
References and further readings
- van der A, R.J., H.J. Eskes, K.F. Boersma, T.P.C. van Noije, M. Van Roozendael, I. De Smedt, D.H.M.U. Peters, J.J.P. Kuenen and E.W. Meijer, Trends, seasonal variability and dominant NOx source derived from a ten year record of NO2 measured from space, J. Geophys. Res., 2008, 113, doi:10.1029/2007JD009021, 2008.
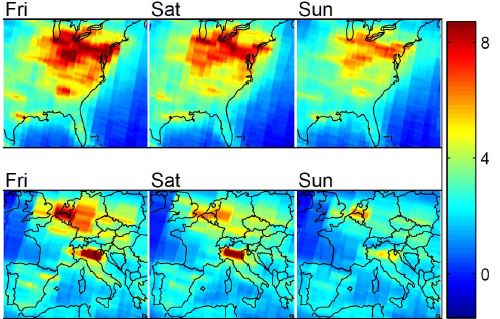
- Beirle, S., Platt, U., Wenig, M., and Wagner, T.: Weekly cycle of NO2 by GOME measurements: a signature of anthropogenic sources, Atmos. Chem. Phys., 3, 2225-2232, doi:10.5194/acp-3-2225-2003, 2003.
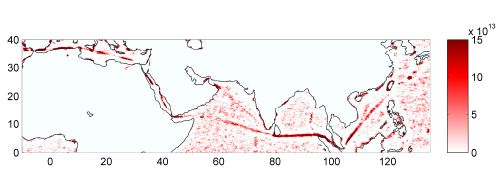
- Beirle, S., Platt, U., von Glasow, R., Wenig, M. and Wagner, T.: Estimate of nitrogen oxide emissions from shipping by satellite remote sensing, Geophys. Res. Lett., 31, L18102, doi:10.1029/2004GL020312, 2004.
- Hilboll, A., Richter, A., and Burrows, J. P.: Long-term changes of tropospheric NO2 over megacities derived from multiple satellite instruments, Atmos. Chem. Phys., 13, 4145-4169, doi:10.5194/acp-13-4145-2013, 2013.
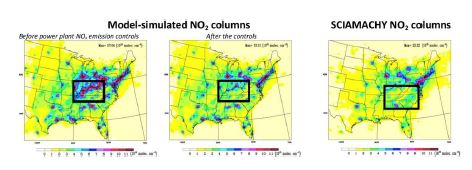
- Kim, S.-W., Heckel, A., Frost, G. J., Richter, A., Gleason, J., Burrows, J. P., McKeen, S., Hsie, E.-Y., Granier, C. and Trainer, M.: NO2 columns in the western United States observed from space and simulated by a regional chemistry model and their implications for NOx emissions, J. Geophys. Res., 114, D11301, doi:10.1029/2008JD011343, 2009.
- Martin, R.V., A.M. Fiore, and A. van Donkelaar, Space-based diagnosis of surface ozone sensitivity to anthropogenic emissions: Geophys. Res. Lett., 31, L06120, doi:10.1029/2004GL019416, 2004.
- Richter, A., Eyring, V., Burrows, J. P., Bovensmann, H., Lauer, A., Sierk, B. and Crutzen, P. J.: Satellite measurements of NO 2 from international shipping emissions, Geophys. Res. Lett., 31, L23110, doi:10.1029/2004GL020822, 2004.
- Richter, A., Burrows, J. P., Nüß, H., Granier, C, Niemeier, U.: Increase in tropospheric nitrogen dioxide over China observed from space, Nature, 437, 129-132, doi: 10.1038/nature04092, 2005