- All Categories (66)
- Data (14)
- News (23)
- Missions (5)
- Events (15)
- Tools (2)
- Activities (1)
- Campaigns (6)
News - Events and Proceedings

Φ-Week Triumphs
In its fourth edition, Φ-Week presented the scientific community with amazing opportunities and projects—thus running alongside innovation at 360 degrees.
News - Data Release news
TanSat AGCS and CAPI products now available for users
In the framework of Earthnet’s Third Party Missions Programme, ESA is opening a new TanSat collection to users, freely accessible and available worldwide upon submission of a fast registration.
Mission - Third Party Missions
TanSat
The TanSat mission is one of the Earth Observation projects managed by the Ministry of Science and Technology of China and is dedicated to detecting and monitoring carbon dioxide in the atmosphere.
News - Infographics
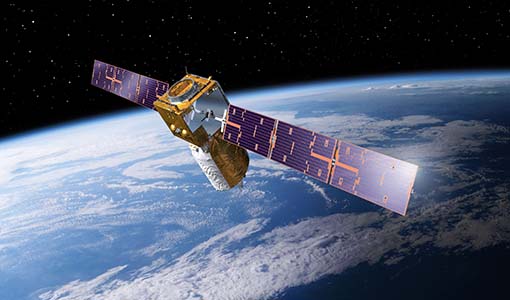
Showcasing the atmosphere-studying Odin mission
Learn about the Odin mission in our new infographic.
News - Events and Proceedings
Scientists to showcase value of Earth observation data at EGU
Remote sensing scientists are getting ready to present innovative and exciting applications of satellite data at the European Geosciences Union general assembly which will take place from 24 to 28 April in Vienna, Austria.
News - Success Stories
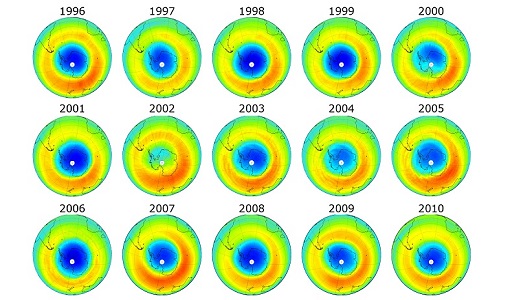
Satellites track the health of the ozone layer
ESA’s Earth observation activities are contributing to international efforts to monitor and preserve the layer of stratospheric ozone that blankets the planet.
News - Data Release news
PROBA-V ‘Collection 2’ - Reprocessed Dataset available
The improved PROBA-V data (Collection 2) has been released. Data is available via the PROBA-V MEP and Terrascope platforms so users can freely exploit the data using Virtual machines, Jupyter Notebooks, and the new viewing application.
News - Success Stories
PROBA-V data improve surface albedo products in Africa
As ESA’s PROBA-V satellite marks its 10-year launch milestone, data tasked during the mission’s lifetime are still being used to assess changes in land cover.
Event - Meeting

Proba-V Cloud Detection Round Robin Meeting
A Round Robin exercise aimed at the inter-comparison of different cloud detection algorithms for Proba-V has been organised by the European Space Agency (ESA) and the Belgian Science Policy Office (BELSPO).
Data - External Data (Restrained)
PROBA-V 1 km, 333 m, and 100 m products
The PROBA-V VEGETATION Raw products and Synthesis products provided coverage of all significant landmasses worldwide with, in the case of a 10-day synthesis product, a minimum effect of cloud cover, resulting from selection of cloud-free acquisitions during the 10-day period. It provided a daily coverage between Latitudes 35°N and 75°N, and between 35°S and 56°S, and a full coverage every two days at the equator. The VEGETATION instrument was pre-programmed with an indefinite repeated sequence of acquisitions. This nominal acquisition scenario allowed a continuous series of identical products to be generated, with the goal to map land cover and vegetation growth across the entire planet every two days. Level Synthesis Resolution resolution (m) Reflectance Level-1C n/a TOA Level-2A n/a 100 m TOA 333 m TOA 1 km TOA Level-3 S1 100 m TOA TOC TOC NDVI 333 m TOA TOC 1 km TOA TOC S5 100 m TOA TOC TOC NDVI S10 333 m TOC TOC NDVI 1 km TOC TOC NDVI Raw Products Overview Product Description Level-1C Level-1C segments (P – product): Radiometrically corrected Level-1B data, in raw sensor geometry (unprojected) Contains: - Top Of Atmosphere reflectance in the four spectral bands - Longitude/latitude information for every pixel - Geometric viewing conditions - Information on the status map (indicating missing and interpolated measurements). Format: HDF5 & GeoTiFF Level-2A Level-2A segment: projected Level-1C (P–product) data, radiometrically and geometrically corrected. Contains: - TOA reflectance values in the four spectral bands without atmospheric correction being performed - Information on the status map (containing identification of radiometric quality, snow, ice, shadow, clouds, land/sea for every pixel) - Geometric viewing conditions Plate carrée projection (EPSG:4326) with spatial resolution of 100 m, 333 m and 1 km Format: HDF5 & GeoTiFF Synthesis Products Overview Level-3 S1 = daily, S5 = 5 days, S10 = decade Different spatial resolution: 100 m, 333 m and 1 km Divided into so called granules, each measuring 10 degrees x 10 degrees, each granule being delivered as a single file Plate carrée projection (EPSG:4326) Format: HDF5 & GeoTiFF Products Content TOA - Top Of Atmosphere reflectance in the four spectral bands (no atmospheric correction applied) - Normalized Difference Vegetation Index (NDVI) -Information on the composite status map (containing identification of snow, ice, shadow, clouds, land/sea for every pixel) - Geometric viewing conditions & date and time of selected measurement TOC Level-2A segment: projected Level-1C (P–product) data, radiometrically and geometrically corrected. Contains: - Top Of Canopy (ground surface) reflectance in the four spectral bands, the atmospheric correction being performed using the SMAC (Simplified Method for Atmospheric Corrections) algorithm - Normalized Difference Vegetation Index (NDVI) - Information on the composite status map (containing identification of snow, ice, shadow, clouds, land/sea for every pixel) Normalized Difference Vegetation Index (NDVI) from Top Of Canopy product (SMAC algorithm for atmospheric corrections applied) - Geometric viewing conditions & date and time of selected measurement TOC NDVI Normalized Difference Vegetation Index (NDVI) from Top Of Canopy product (SMAC algorithm for atmospheric corrections applied)
Mission - Earth Watch
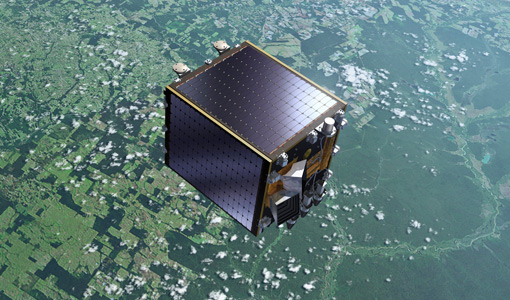
PROBA-V
The PROBA-V mission provides multispectral images to study the evolution of the vegetation cover on a daily and global basis.
Data - Data Description
Odin SMR data products
The latest Odin Sub-Millimetre Radiometer (SMR) datasets have been generated by Chalmers University of Technology and Molflow within the Odin-SMR Recalibration and Harmonisation project, funded by the European Space Agency (ESA) to create a fully consistent and homogeneous dataset from the 20 years of satellite operations. The Odin satellite was launched in February 2001 as a joint undertaking between Sweden, Canada, France and Finland, and is part of the ESA Third Party Missions (TPM) programme since 2007. The complete Odin-SMR data archive was reprocessed applying a revised calibration scheme and upgraded algorithms. The Level 1b dataset is entirely reconsolidated, while Level 2 products are regenerated for the main mesospheric and stratospheric frequency modes (i.e., FM 01, 02, 08, 13, 14, 19, 21, 22, 24). The resulting dataset represents the first full-mission reprocessing campaign of the mission, which is still in operation.
Data - External Data (Restrained)
Odin OSIRIS data products
The Odin OSIRIS (Optical Spectrograph and Infra-Red Imaging System) data provides vertical profiles measures of spectrally dispersed, limb scattered sunlight from the upper troposphere into the lower mesosphere. The data products are regularly processed and provide Ozone density vertical profiles (both Level 2 and Level 3), vertical profiles of stratospheric Aerosol (both Level 2 and Level 3), slant column densities of nitrogen dioxide NO2 profiles (Level 2), stratospheric BrO profiles (Level 2).
News - Data Release news
New FLEX-related campaign datasets released
New datasets have been released for three campaigns, covering activities supporting the upcoming FLEX mission.
News - Data Release news
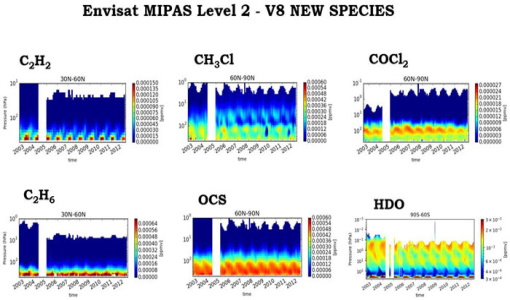
New Envisat MIPAS L2 dataset reprocessed with ORM v8.22 available
The Level 2 reprocessing of the full Envisat MIPAS mission with the ESA ORM processor version 8.22 has been completed.
News - Operational News
New Aeolus Processing Baseline 16 now activated
The new Aeolus processing baseline 16 was activated on Tuesday 18 April 2023.
News - General News
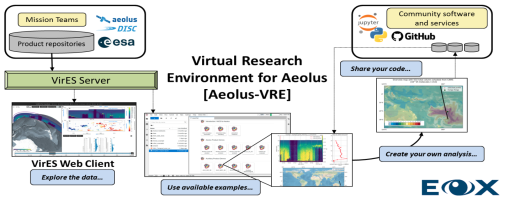
Launch of Aeolus VRE
The Aeolus Virtual Research Environment (VRE) is a cloud service, which provides users with a web-based development environment in the form of a JupyterLab workspace.
News - General News
Introducing the Newest ESA Third Party Missions
ESA's Earth Observation Programme Board has unanimously approved the integration of the Federated Satellite Systems (FSSCat) mission, the Geostationary Environment Monitoring Spectrometer (GEMS) instrument on-board the GEO-KOMPSAT-2B satellite and the Gravity Recovery and Climate Experiment Follow-On (GRACE-FO) mission, as Third Party Missions.
News - Operational News
GOSAT – TANSO-FTS observations unavailability
Due to an inclination control manoeuvre of the JAXA GOSAT-1 satellite, the TANSO-FTS sensor observations have been suspended.
Data - Fast Registration with immediate access (Open)
GOSAT TANSO FTS and CAI full archive and new products
The TANSO-FTS instrument on-board GOSAT satellite features high optical throughput, fine spectral resolution, and a wide spectral coverage (from VIS to TIR in four bands). The reflective radiative energy is covered by the VIS and SWIR (Shortwave Infrared) ranges, while the emissive portion of radiation from Earth's surface and the atmosphere is covered by the MWIR (Midwave Infrared) and TIR (Thermal Infrared) ranges. These spectra include the absorption lines of greenhouse gases such as carbon dioxide (CO2) and methane (CH4). The TANSO-CAI instrument on-board GOSAT satellite is a radiometer in the spectral ranges of ultraviolet (UV), visible, and SWIR to correct cloud and aerosol interference. The imager has continuous spatial coverage, a wider field of view, and higher spatial resolution than the FTS in order to detect the aerosol spatial distribution and cloud coverage. Using the multispectral bands, the spectral characteristics of the aerosol scattering can be retrieved together with optical thickness. In addition, the UV-band range observations provide the aerosol data over land. With the FTS spectra, imager data, and the retrieval algorithm to remove cloud and aerosol contamination, the column density of the gases can be the column density of the gases can be retrieved with an accuracy of 1%. The full ESA archive and newly acquired/systematically processed GOSAT FTS and CAI products are available in the following processing levels: FTS Observation mode 1 L1B, day (FTS_OB1D_1) FTS Observation mode 1 L1B, night (FTS_OB1N_1) FTS Special Observation L1B, day (FTS_SPOD_1) FTS Special Observation L1B, night (FTS_SPON_1) FTS L2 CO2 profile, TIR (FTS_P01T_2) FTS L2 CH4 profile, TIR (FTS_P02T_2) FTS L2 CH4 column amount, SWIR (FTS_C02S_2) FTS L2 CO2 column amount, SWIR (FTS_C01S_2) FTS L2 H2O column amount, SWIR (FTS_C03S_2) FTS L3 global CO2 distribution, SWIR (FTS_C01S_3) FTS L3 global CH4 distribution, SWIR (FTS_C02S_3) FTS L4A global CO2 flux, annual in text format (FTS_F01M4A) FTS L4A global CO2 flux, annual in netCDF format (FTS_F03M4A) FTS L4A global CO2 distribution (FTS_P01M4B) FTS L4A global CH4 flux, annual in text format (FTS_F02M4A) FTS L4A global CH4 flux, annual in netCDF format (FTS_F04M4A) FTS L4A global CH4 distribution (FTS_P02M4B) CAI L1B data (CAI_TRB0_1) CAI L1B+ (CAI_TRBP_1) CAI L2 cloud flag (CAI_CLDM_2) CAI L3 global reflect. distrib. clear sky (CAI_TRCF_3) CAI L3 global radiance distrib. all pixels (CAI_TRCL_3) CAI L3 global NDVI (CAI_NDVI_3). All products are made available as soon as processed and received from JAXA. To satisfy NearRealTime requirements, ESA also provides access to the FTS L1X products, which are the NRT version of FTS L1B products. The main difference between L1X and L1B is that L1X does not include CAM data, best-estimate pointing-location, and target point classification, but most of all the L1X products are available on the ESA server between 2 and 5 hours after acquisition. The L1X products remains on the FTP server for 5 days, the time for the corresponding L1B to be available. A document describing the differences between L1X and L1B products is listed in the available resources. For more details on products, please refer to below product specifications.