- All Categories (38)
- Data (14)
- News (7)
- Missions (1)
- Events (9)
- Activities (4)
- Campaigns (2)
- Documents (1)
DATA
Discover and download the Earth observation data you need from the broad catalogue of missions the European Space Agency operate and support.
Data - EO Sign In Authentication (Open)
Aeolus L2A Aerosol/Cloud optical product
The Level 2A aerosol/cloud optical products of the Aeolus mission include: Geo-located consolidated backscatter and extinction profiles Backscatter-to-extinction coefficient LIDAR ratio, scene classification Heterogeneity index Attenuated backscatter signals. Resolution: Horizontal resolution of L2A optical properties at observation scale (~87 km); Exceptions are group properties (horizontal accumulation of measurements from ~3 km to ~87 km) and attenuated backscatters (~3 km). Note: The resolution of "groups" in the L2A can only go down to 5 measurements at the moment, i.e. ~15 km horizontal resolution. This could be configured to go to 1 measurement - Vertical resolution 250-2000 m (Defined by Range Bin Settings).
Data - Project Proposal (Restrained)
GHGSat archive and tasking
GHGSat data produce measures of vertical column densities of greenhouse gas emissions ((currently CH4, but eventually CO2), provided on a pre-defined area of 12 km x 12 km, from the full sensor field-of-view. GHGSat Catalogue and New Collect data are available in three different data types: Single Observation: a single observation of a scene. Monthly Monitoring: guaranteed 12 successful observations in a year over a given site (once per month or flexible best effort cadence depending on weather). Weekly Monitoring: guaranteed 52 successful observations in a year over a given site (once a week or flexible best effort cadence based on weather), to accommodate large & persistent monitoring needs. Data are provided as an Emissions package containing the following products: Abundance dataset (Level 2): Set of per-pixel abundances in excess of the local background (ppb) for a single species, and per-pixel measurement error expressed as a standard deviation for a single site on a single satellite pass. Data format is 16-bit GeoTIFF. Concentration Maps (Level 2): High readability pseudocolour map combining surface reflectance, and column density expressed in ppb for a single species in PNG format. The relevant abundance dataset is provided as well. Emission Rates (Level 4): Instantaneous rate for a detected emission from a targeted source estimated using abundance datasets from a single satellite pass and applying dispersion modelling techniques. The delivered product includes the emission rate estimate with uncertainty and key dispersion parameters (in CSV format) as well as the abundance dataset used for the emission estimate. This product is only delivered in the Emissions package if an emission is detected within the abundance dataset. The Level 2 products will be delivered regardless of whether or not an emission is detected. The properties of available products are summarised in the table. Band(s) / Beam Mode(s) and Polarisation SWIR (1635-1675 nm), multiple bands, unpolarised Spatial Resolution <30 m Scene size 12 km x 12 km Species Measured CH4 Geometric Corrections Radial distortion, perspective projection Radiometric Corrections Detector pixel response, ghosting, spectral response, atmospheric correction including trace gas modelling and surface reflectance Details about the data provision, data access conditions and quota assignment procedure are described in the GHGSat Terms of Applicability.
Data - Announcement of Opportunity (Restrained)
Announcement of Opportunity for NoR
ESA invites submissions for the Network of Resources (NoR) call, which aims to support research, development and pre-commercial users to innovate their working practices, moving from a data download paradigm towards a 'bring the user to the data' paradigm.
Data - EO Sign In Authentication (Open)
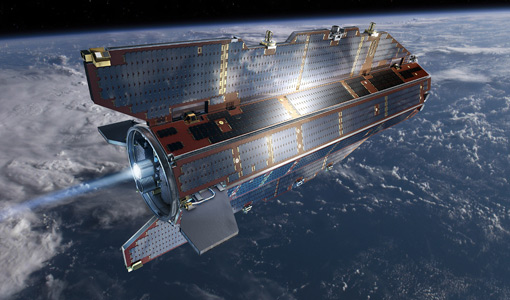
VT GOCE Data
This collection contains the VT GOCE software and associated data set needed to run the software that is used for GOCE data visualisation.
Data - External Data (Restrained)

SciSat-1: ACE-FTS and MAESTRO
SCISAT-1 data aim at monitoring and analysing the chemical processes that control the distribution of ozone in the upper troposphere and stratosphere. It provides acquisitions from the two instruments MAESTRO and ACE-FTS. MAESTRO: Measurement of Aerosol Extinction in the Stratosphere and Troposphere Retrieved by Occultation. Dual-channel optical spectrometer in the spectral region of 285-1030 nm. The objective is to measure ozone, nitrogen dioxide and aerosol/cloud extinction (solar occultation measurements of atmospheric attenuation during satellite sunrise and sunset with the primary objective of assessing the stratospheric ozone budget). Solar occultation spectra are being used for retrieving vertical profiles of temperature and pressure, aerosols, and trace gases (O3, NO2, H2O, OClO, and BrO) involved in middle atmosphere ozone distribution. The use of two overlapping spectrometers (280 - 550 nm, 500 - 1030 nm) improves the stray-light performance. The spectral resolution is about 1-2 nm. ACE-FTS: Fourier Transform Spectrometer. The objective is to measure the vertical distribution of atmospheric trace gases, in particular of the regional polar O3 budget, as well as pressure and temperature (derived from CO2 lines). The instrument is an adapted version of the classical sweeping Michelson interferometer, using an optimised optical layout. The ACE-FTS measurements are recorded every 2 s. This corresponds to a measurement spacing of 2-6 km which decreases at lower altitudes due to refraction. The typical altitude spacing changes with the orbital beta angle. For historical reasons, the retrieved results are interpolated onto a 1 km "grid" using a piecewise quadratic method. For ACE-FTS version 1.0, the results were reported only on the interpolated grid (every 1 km from 0.5 to 149.5 km). For versions 2.2, both the "retrieval" grid and the "1 km" grid profiles are available. SCISAT-1 collection provides ACE-FTS and MAESTRO Level 2 Data. As of today, ACE-FTS products are available in version 4.1, while MAESTRO products are available in version 3.13.
Data - Fast Registration with immediate access (Open)
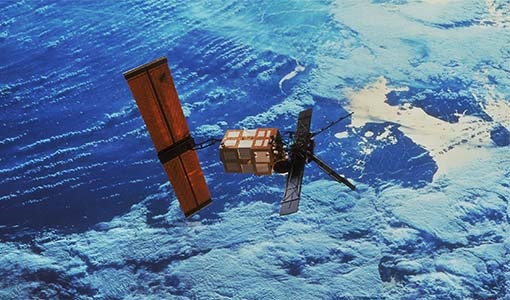
ERS PRARE Precise Orbit Product (ERS.ORB.POD/ERS.ORB/PRC)
The precise orbit results from a data reduction process in which all available tracking data (Single-Lens Reflex, radar altimeter crossovers, PRARE range and Doppler data) and most accurate correction, transformation and dynamical models are taken into account and in which high level numerical procedures are applied. These orbits are "optimal" achievable representations of the real orbital motion under the circumstances of tracking situation and the "state of the art" model situation. The precise orbit product for the ERS satellites are the satellite ephemeris (position and velocity vector) including time tag, given in a well-defined reference frame, together with the nominal satellite attitude information and a radial orbit correction. Several orbit solutions are currently distributed: A new set of ORB POD (Precise Orbit Determination - REAPER v2) computed with the most updated model standards for the complete ERS-1 and ERS-2 mission. A previous set of ORB POD (REAPER v1) data already available on the ESA dissemination site since 2014, covering the ERS-1 full mission and the ERS-2 mission up to July 2003. ORB PRC which is the original Precise Orbit dataset computed during the ERS mission operations for ERS-1 and ERS-2. In the new POD dataset (REAPER v2) for the ERS-1 and ERS-2 missions, two different orbit solutions are provided together with the combined solution to be used for processing of the radar altimeter measurements and the determination of geodetic/geophysical products: those computed by DEOS (Delft Institute of Earth Observation and Space Systems), and those generated by ESOC (European Space Operations Centre) using different software (GEODYN and NAPEOS respectively). Careful evaluation of the various solutions of REAPER v2 has shown that the DEOS solution for both ERS-1 and ERS-2 has the best performance and is recommended to be used as reference. See the ERS Orbit Validation Report. For the previous version of the POD data set (REAPER v1), with ERS-2 mission data only up to 2003, three different orbit solutions together with the combined solution are available. These precise orbits for ERS-1 and ERS-2 have been computed at DEOS, ESOC, and GFZ (Deutschen GeoForschungsZentrums) using different software and different altimeter databases. Combined solutions have been created using three individual solutions for each satellite. All orbits were derived using consistent models in the same LPOD2005 terrestrial reference frame. These new orbit solutions show notable improvement with respect to DGME04 orbits (Scharroo and Visser, 1998). Thus, RMS crossover differences of new orbits improved by 4-9 mm. Careful evaluation of the various solutions has shown that the combined solution for both ERS-1 and ERS-2 has the best performance. All POD orbit files (REAPER v1/v2) are available in SP3c format.
Data - EO Sign In Authentication (Open)
GOCE Telemetry
This collection contains all GOCE platform and instruments telemetry. For details see the Packets Description file.
Data - EO Sign In Authentication (Open)
GOCE Thermosphere Data
Thermospheric density and crosswind data products derived from GOCE data. Latest baseline _0200. The GOCE+ Air Density and Wind Retrieval using GOCE Data project produced a dataset of thermospheric density and crosswind data products which were derived from ion thruster activation data from GOCE telemetry. The data was combined with the mission's accelerometer and star camera data products. The products provide data continuty and extend the accelerometer-derived thermosphere density data sets from the CHAMP and GRACE missions. The resulting density and wind observations are made available in the form of time series and grids. These data can be applied in investigations of solar-terrestrial physics, as well as for the improvement and validation of models used in space operations. Funded by ESA through the Support To Science Element (STSE) of ESA's Earth Observation Envelope Programme, supporting the science applications of ESA's Living Planet programme, the project was a partnership between TU Delft, CNES and Hypersonic Technology Göttingen. Dataset history Date Change Reason 18/04/2019 - Time series data v2.0, covering the whole mission - Updated data set user manual - New satellite geometry and aerodynamic model - New vertical wind field - New data for the deorbit phase, (GPS+ACC and GPS-only versions) Updated satellite models and additional data 14/07/2016 - Time series data v1.5, covering the whole mission - Updated data set user manual Removal of noisy data 31/07/2014 - Time series data v1.4, covering the whole mission - Gridded data, now including error estimates - Updated data set user manual; Updated validation report; Updated ATBD Full GOCE dataset available 28/09/2013 Version 1.3 density/winds timeseries and gridded data released. User manual updated to v1.3 Bug fix and other changes 04/09/2013 Version 1.2 density/winds timeseries and gridded data released, with user manual First public data release of thermospheric density/winds data
Data - EO Sign In Authentication (Open)

GOCE TEC and ROTI
GOCE total electron content (TEC) and rate of TEC index (ROTI) data.
Data - EO Sign In Authentication (Open)
GOCE Global Gravity Field Models and Grids
This collection contains gravity gradient and gravity anomalies grids at ground level and at satellite height. In addition it contains the GOCE gravity field models (EGM_GOC_2, EGM_GCF_2) and their covariance matrices (EGM_GVC_2): GOCE Gravity solution GRIDS Gridded Gravity gradients and anomalies at ground level: GO_CONS_GRC_SPW_2__20091101T000000_20111231T235959_0001.TGZ GO_CONS_GRC_SPW_2__20091101T055147_20120731T222822_0001.TGZ GO_CONS_GRC_SPW_2__20091101T055226_20131020T033415_0002.TGZ GO_CONS_GRC_SPW_2__20091009T000000_20131021T000000_0201.TGZ. Latest baseline is: GO_CONS_GRC_SPW_2__20091009T000000_20131021T000000_0201.TGZ. Gridded Gravity gradients and anomalies at satellite height: GO_CONS_GRD_SPW_2__20091101T055147_20100630T180254_0001.TGZ GO_CONS_GRD_SPW_2__20091101T055147_20120731T222822_0001.TGZ GO_CONS_GRD_SPW_2__20091101T055226_20131020T033415_0002.TGZ GO_CONS_GRD_SPW_2__20091009T000000_20131021T000000_0201.TGZ. Latest baseline is: GO_CONS_GRD_SPW_2__20091009T000000_20131021T000000_0201.TGZ. As output from the ESA-funded GOCE+ GeoExplore project, GOCE gravity gradients were combined with heterogeneous other satellite gravity information to derive a combined set of gravity gradients complementing (near)-surface data sets spanning all together scales from global down to 5 km. The data is useful for various geophysical applications and demonstrate their utility to complement additional data sources (e.g., magnetic, seismic) to enhance geophysical modelling and exploration. The GOCE+ GeoExplore project is funded by ESA through the Support To Science Element (STSE) and was undertaken as a collaboration of the Deutsches Geodätisches Forschungsinstitut (DGFI), Munich, DE, the Christian-Albrechts-Universität zu Kiel, the Geological Survey of Norway (NGU), Trondheim, Norway, TNO, the Netherlands and the University of West Bohemia, Plzen, CZ. Read more about gravity gradients and how GOCE delivered them in this Nature article: Satellite gravity gradient grids for geophysics. View images of the GOCE original gravity gradients and gradients with topographic reduction grids. Available data GRIDS File Type Gridded data: full Gravity Gradients, at 225 km and 255 km with and without topographic correction GGG_225 Computed from GOCE/GRACE gradients lower orbit phase February 2010 - October 2013 GGG_255 Computed from GOCE/GRACE gradients nominal orbit phase February 2010 - October 2013 TGG_225 Gravity gradient grids from topography at fixed height of 225/255 km above ellipsoid given in LNOF (Local North Oriented Frame) TGG_225 Gravity gradient grids from topography at fixed height of 225/255 km above ellipsoid given in LNOF (Local North Oriented Frame) MAPS File Type Maps of Gravity Gradients with and without topographic corrections Vij_225km_Patch_n.jpg Maps of grids from lower orbit phase with and without topographic correction from ETOPO1 Along-orbit File Type Full Gravity Gradients, along-orbit, in GRF and TRF reference frames. A detailed description is provided in the data set user manual GGC_GRF Combined gradients from GRACE (long wavelengths) & GOCE (measurement band) in the GRF (Gradiometer Reference Frame) GGC_TRF Combined gradients from GRACE (long wavelengths) & GOCE (measurement band) rotated from GRF to TRF (Terrestrial Reference Frame: North, West, Up) Direct solution First Generation Product: GO_CONS_EGM_GOC_2__20091101T000000_20100110T235959_0002.TGZ Variance/Covariance matrix: GO_CONS_EGM_GVC_2__20091101T000000_20100110T235959_0002.TGZ Second Generation Product: GO_CONS_EGM_GOC_2__20091101T000000_20100630T235959_0002.TGZ Variance/Covariance matrix: GO_CONS_EGM_GVC_2__20091101T000000_20100630T235959_0001.TGZ Third Generation Product: GO_CONS_EGM_GOC_2__20091101T000000_20110419T235959_0001.TGZ Variance/Covariance matrix: GO_CONS_EGM_GVC_2__20091101T000000_20110419T235959_0001.TGZ Coefficients (ICGEM format): GO_CONS_EGM_GCF_2__20091101T000000_20110419T235959_0001.IDF Fourth Generation Product: GO_CONS_EGM_GOC_2__20091101T000000_20120801T060000_0001.TGZ Variance/Covariance matrix: GO_CONS_EGM_GVC_2__20091101T000000_20120801T060000_0002.TGZ Fifth Generation Product: GO_CONS_EGM_GOC_2__20091101T000000_20131020T235959_0002.TG Variance/Covariance matrix: GO_CONS_EGM_GVC_2__20091101T000000_20131020T235959_0001.TGZ Coefficients (ICGEM format): GO_CONS_EGM_GOC_2__20091101T000000_20131020T235959_0001.IDF Sixth Generation Product: GO_CONS_EGM_GOC_2__20091009T000000_20131020T235959_0201.TGZ Variance/Covariance matrix: GO_CONS_EGM_GVC_2__20091009T000000_20131020T235959_0201.TGZ Coefficients (ICGEM format): GO_CONS_EGM_GOC_2__20091009T000000_20131020T235959_0201.IDF Release 6 gravity model validation report. Time-Wise solution First Generation Product: GO_CONS_EGM_GOC_2__20091101T000000_20100111T000000_0002.TGZ Variance/Covariance matrix: GO_CONS_EGM_GVC_2__20091101T000000_20100111T000000_0002.TGZ Second Generation Product: GO_CONS_EGM_GOC_2__20091101T000000_20100705T235500_0002.TGZ Variance/Covariance matrix: GO_CONS_EGM_GVC_2__20091101T000000_20100705T235500_0001.TGZ Third Generation Product: GO_CONS_EGM_GOC_2__20091101T000000_20110430T235959_0001.TGZ Variance/Covariance matrix: GO_CONS_EGM_GVC_2__20091101T000000_20110430T235959_0001.TGZ Coefficients (ICGEM format): GO_CONS_EGM_GCF_2__20091101T000000_20110430T235959_0001.IDF Fourth Generation Product: GO_CONS_EGM_GOC_2__20091101T000000_20120618T235959_0002.TGZ Variance/Covariance matrix: GO_CONS_EGM_GVC_2__20091101T000000_20120618T235959_0001.TGZ Fifth Generation Product: GO_CONS_EGM_GOC_2__20091101T000000_20131021T000000_0002.TGZ Variance/Covariance matrix: GO_CONS_EGM_GVC_2__20091101T000000_20131021T000000_0001.TGZ Coefficients (ICGEM format): GO_CONS_EGM_GOC_2__20091101T000000_20131021T000000_0001.IDF Sixth Generation Product: GO_CONS_EGM_GOC_2__20091009T000000_20131021T000000_0201.TGZ Variance/Covariance matrix: GO_CONS_EGM_GVC_2__20091009T000000_20131021T000000_0202.TGZ Coefficients (ICGEM format): GO_CONS_EGM_GOC_2__20091009T000000_20131021T000000_0201.IDF Combined gravity field GOCE model plus Antarctic and Arctic data (ICGEM format): GO_CONS_EGM_GOC_2__20091009T000000_20160119T235959_0201.IDF Download release 6 gravity model validation report.
Data - EO Sign In Authentication (Open)
GOCE Level 2
This collection contains GOCE level 2 data: Gravity Gradients in the gradiometer reference frame (EGG_NOM_2), in the terrestrial reference frame (EGG_TRF_2), GPS receiver derived precise science orbits (SST_PSO_2) and the non-tidal time variable gravity field potential with respect to a mean value in terms of a spherical harmonic series determined from atmospheric and oceanic mass variations as well as from a GRACE monthly gravity field time series (SST_AUX_2). EGG_NOM_2_: latest baseline: _0203 EGG_TRF_2_: latest baseline _0101 SST_AUX_2_: latest baseline _0001 SST_PSO_2_: latest baseline _0201.
Data - EO Sign In Authentication (Open)

GOCE Level 1
This collection contains the GOCE L1b data of the gradiometer, the star trackers, the GPS receiver, the magnetometers, magnetotorquers and the DFACS data of each accelerometer of the gradiometer. EGG_NOM_1b: latest baseline _0202 SST_NOM_1b: latest baseline _000x (always take the highest number available) ACC_DFx_1b: latest baseline _0001 (x=1:6) MGM_GOx_1b: latest baseline _0001 (x=1:3) MTR_GOC_1b: latest baseline _0001 SST_RIN_1b: latest baseline _000x (always take the highest number available) STR_VC2_1b: latest baseline _000x (always take the highest number available) STR_VC3_1b: latest baseline _000x (always take the highest number available).
Data - External Data (Restrained)
Aura OMI complete NASA dataset
The OMI observations provide the following capabilities and features: A mapping of ozone columns at 13 km x 24 km and profiles at 13 km x 48 km A measurement of key air quality components: NO2, SO2, BrO, HCHO, and aerosol The ability to distinguish between aerosol types, such as smoke, dust and sulfates The ability to measure aerosol absorption capacity in terms of aerosol absorption optical depth or single scattering albedo A measurement of cloud pressure and coverage A mapping of the global distribution and trends in UV-B radiation. The OMI data are available in the following four levels: Level 0, Level 1B, Level 2, and Level 3. Level 0 products are raw sensor counts. Level 0 data are packaged into two-hour "chunks" of observations in the life of the spacecraft (and the OMI aboard it) irrespective of orbital boundaries. They contain orbital swath data. Level 1B processing takes Level 0 data and calibrates, geo-locates and packages the data into orbits. They contain orbital swath data. Level 2 products contain orbital swath data. Level 3 products contain global data that are composited over time (daily or monthly) or over space for small equal angle (latitude longitude) grids covering the whole globe.
Data - Campaigns (Open)

AROMAT-I
The main objective of this AROMAT-I campaign was to test newly developed airborne sensors and to evaluate their capabilities as validation tools for future air quality space borne sensors, in particular TROPOMI.