- All Categories (1269)
- Data (22)
- News (67)
- Missions (2)
- Events (25)
- Tools (18)
- Activities (4)
- Campaigns (4)
- Documents (1127)
DATA
Discover and download the Earth observation data you need from the broad catalogue of missions the European Space Agency operate and support.
Data - EO Sign In Authentication (Open)
SMOS Tropical Cyclone Wind Radii Fixes
The SMOS WRF product is available in Near Real Time to support tropical cyclones (TC) forecasts. It is generated within 4 to 6 hours from sensing from the SMOS L2 swath wind speed products, in the so-called "Fix (F-deck)" format compatible with the US Navy's ATCF (Automated Tropical Cyclone Forecasting) System. The SMOS WRF "fixes" to the best-track forecasts contain: the SMOS 10-min maximum-sustained winds (in knots) and wind radii (in nautical miles) for the 34 kt (17 m/s), 50 kt (25 m/s) and 64 kt (33 m/s) winds per geographical storm quadrants, and for each SMOS pass intercepting a TC in all the active ocean basins.
Data - EO Sign In Authentication (Open)
SMOS - CryoSat L4 Sea Ice Thickness
The SMOS-CryoSat merged Sea Ice Thickness Level 4 product, in NetCDF format, is based on estimates from both the MIRAS and the SIRAL instruments with a significant reduction in the relative uncertainty for the thickness of the thin ice. A weekly averaged preliminary product is generated every day by the Alfred Wegener Institut (AWI) by merging the weekly CryoSat Sea Ice Thickness product and the daily SMOS Sea Ice Thickness retrieval. A final product is provided with a latency of about 3-4 weeks using a different global sea ice concentration product and a reprocessed CryoSat product. All grids are projected onto the 25 km EASE2 Grid based on a polar aspect spherical Lambert azimuthal equal-area projection. The grid dimension is 5400 x 5400 km, equal to a 432 x 432 grid centered on the geographic pole. Coverage is limited to the October-April (winter) period for the Northern Hemisphere, due to the melting season, from year 2010 onwards.
Data - EO Sign In Authentication (Open)
SMOS NRT L2 Swath Wind Speed
SMOS retrieved surface wind speed gridded maps (with a spatial sampling of 1/4 x 1/4 degrees) are available in NetCDF format. Each product contains parts of ascending and descending orbits and it is generated by Ifremer, starting from the SMOS L1B data products, in Near Real Time i.e. within 4 to 6 hours from sensing time. Before using this dataset, please check the read-me-first note available in the Resources section below.
Data - EO Sign In Authentication (Open)
SMOS Soil Freeze and Thaw State
The SMOS Level 3 Freeze and Thaw (F/T) product provides daily information on the soil state in the Northern Hemisphere based on SMOS observations and associated ancillary data. Daily products, in NetCDF format, are generated by the Finnish Meteorological Institute (FMI) and are available from 2010 onwards. The processing algorithm makes use of gridded Level 3 brightness temperatures provided by CATDS. The data is provided in the Equal-Area Scalable Earth Grid (EASE2-Grid), at 25 km x 25 km resolution. For an optimal exploitation of this dataset, please refer to the Resources section below to access Product Specifications, read-me-first notes, etc.
Data - EO Sign In Authentication (Open)
SMOS L3 Daily Wind Speed
SMOS L3WS products are daily composite maps of the collected SMOS L2 swath wind products for a specific day, provided with the same grid than the Level 2 wind data (SMOS L2WS NRT) but separated into ascending and descending passes. This product is available the day after sensing from Ifremer, in NetCDF format. Before using this dataset, please check the read-me-first note available in the Resources section below.
Data - Campaigns (Open)
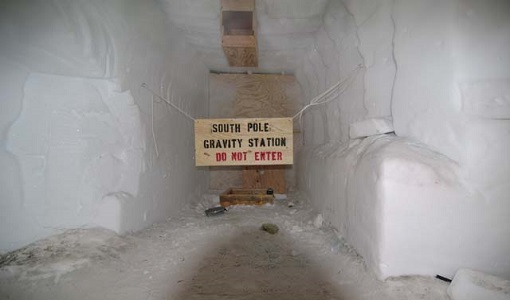
DOMECair (SMOS)
The purpose of this campaign was to assess the merits of the East Antarctic Plateau around Dome C with the Concordia station as a candidate for an Earthly calibration site. It was an airborne campaign in Antarctica supporting SMOS calibration.
Data - Campaigns (Open)
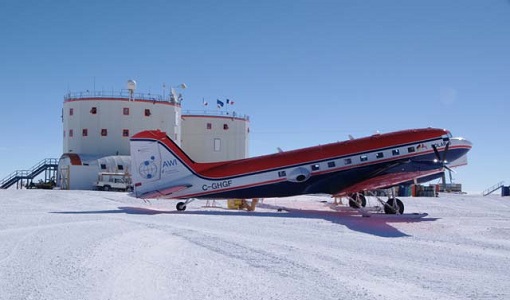
DOMECair (GOCE)
The airborne survey DOMECair 2013 and its instrumentation was designed to obtain calibration and validation data for two different satellite missions of ESA’s Earth Explorer mission, for satellites SMOS and GOCE.
Data - EO Sign In Authentication (Open)

VT GOCE Data
This collection contains the VT GOCE software and associated data set needed to run the software that is used for GOCE data visualisation.
Data - EO Sign In Authentication (Open)
SMOS NRT Data Products
The SMOS Near Real Time products include Level 1 geo-located brightness temperature and Level 2 geo-located soil moisture estimation. The SMOS NRT L1 Light BUFR product contains brightness temperature geo-located on a reduced Gaussian grid (T511/N256), only for "land" pixels but keeping the full angular resolution. The pixels are consolidated in a full orbit dump segment (i.e. around 100 minutes of sensing time) with a maximum size of about 30MB per orbit. Spatial resolution is in the range of 30-50 km. This product is distributed in BUFR format. The SMOS NRT L2 Soil Moisture Neural Network (NN) product provides NRT soil moisture data based on the statistical coefficients estimated by a neural network. It is provided in the SMOS DGG grid and only at the satellite track. It also provides an estimation of the uncertainty of the estimated soil moisture product, and the probability that a soil moisture value is contaminated by Radio Frequency Interference (RFI). This product is distributed in NetCDF format. The L2 data product is also distributed via the EUMETCast Europe Service (DVB), upon registration on the EUMETSAT Earth Observation Portal. The Ku-band DVB reception station must be situated within the service coverage in Europe. SMOS NRT data is also regularly delivered to the UK Met-Office, then made available to operational agencies and research and development institutes via the WMO GTS Network. For an optimal exploitation of the SMOS NRT products please consult the read-me-first notes available in the Resources section below.
Data - EO Sign In Authentication (Open)
SMOS L1 and L2 Science data
SMOS Level 1 data products are designed for scientific and operational users who need to work with calibrated MIRAS instrument measurements, while SMOS Level 2 data products are designed for scientific and operational users who need to work with geo-located soil moisture and sea surface salinity estimation as retrieved from the L1 dataset. Products from the SMOS Data Processing Ground Segment (DPGS) located at the European Space Astronomy Centre (ESAC), belonging to the latest processing baseline, have File Class OPER. Reprocessed SMOS data is tagged as REPR. The Level 1A product comprises all calibrated visibilities between receivers (i.e. the interferometric measurements from the sensor including the redundant visibilities), combined per integration time of 1.2s (snapshot). The snapshots are consolidated in a pole-to-pole product file (50 minutes of sensing time) with a maximum size of about 215MB per half orbit (29 half orbits per day). Access to this products is restricted to SMOS Cal/Val users. The Level 1B product comprises the result of the image reconstruction algorithm applied to the L1A data. As a result, the reconstructed image at L1B is simply the difference between the sensed scene by the sensor and the artificial scene. The brightness temperature image is available in its Fourier component in the antenna polarisation reference frame top of the atmosphere. Images are combined per integration time of 1.2 seconds (snapshot). The removal of foreign sources (Galactic, Direct Sun, Moon) is also included in the reconstruction. Snapshot consolidation is as per L1A, with a maximum product size of about 115MB per half orbit. ESA provides the Artificial Scene Library (ASL) to add the artificial scene in L1B for any user that wants to start from L1B products and derive the sensed scene. The Level 1C product contains multi-angular brightness temperatures in antenna frame (X-pol, Y-pol, T3 and T4) at the top of the atmosphere, geo-located in an equal-area grid system (ISEA 4H9 - Icosahedral Snyder Equal Area projection). The pixels are consolidated in a pole-to-pole product file (50 minutes of sensing time), with a maximum size of about 350MB per half orbit (29 half orbits per day). Spatial resolution is in the range of 30-50 km. For each L1C product there is also a corresponding Browse product containing brightness temperatures interpolated for an incidence angle of 42.5°. Two L1C products are available: Land for soil moisture retrieval and Sea for sea surface salinity retrieval. The Level 2 Soil Moisture (SM) product comprises soil moisture measurements geo-located in an equal-area grid system ISEA 4H9. The product contains not only the retrieved soil moisture, but also a series of ancillary data derived from the processing (nadir optical thickness, surface temperature, roughness parameter, dielectric constant and brightness temperature retrieved at top of atmosphere and on the surface) with the corresponding uncertainties. The pixels are consolidated in a pole-to-pole product file (50 minutes of sensing time), with a maximum size of about 7MB (25MB uncompressed data) per half orbit (29 half orbits per day). This product is available in both Earth Explorer and NetCDF formats. The Level 2 Ocean Salinity (OS) product comprises sea surface salinity measurements geo-located in an equal-area grid system ISEA 4H9. The product contains one single swath-based sea surface salinity retrieved with and without Land-Sea contamination correction, SSS anomaly based on WOA-2009 referred to Land-Sea corrected sea surface salinity, brightness temperature at the top of the atmosphere and at the sea surface with their corresponding uncertainties. The pixels are consolidated in a pole-to-pole product file (50 minutes of sensing time), with a maximum size of about 10MB (25MB uncompressed data) per half orbit (29 half orbits per day). This product is available in both Earth Explorer and NetCDF formats. For an optimal exploitation of the SMOS L1 and L2 datasets, please refer to the Resources section below in order to access Product Specifications, read-me-first notes, etc.
Data - EO Sign In Authentication (Open)
SMOS Auxiliary Data
The Level 2 ECMWF SMOS Auxiliary data product, openly available to all users, contains ECMWF data on the ISEA 4-9 DGG corresponding to SMOS half-orbit. It is used by both the ocean salinity and soil moisture operational processors to store the geophysical parameters from ECMWF forecasts. Access to other SMOS Level 1 and Level 2 "dynamic" and "static" auxiliary datasets is restricted to Cal/Val users. The detailed content of the SMOS Auxiliary Data Files (ADF) is described in the Products Specification documents available in the Resources section below.
Data - EO Sign In Authentication (Open)
SMOS L3 Sea Ice Thickness
The SMOS Level 3 Sea Ice Thickness product, in NetCDF format, provides daily estimations of SMOS-retrieved sea ice thickness (and its uncertainty) at the edge of the Arctic Ocean during the October-April (winter) season, from year 2010 onwards. The sea ice thickness is retrieved from the SMOS L1C product, up to a depth of approximately 0.5-1 m, depending on the ice temperature and salinity. Daily maps, projected on polar stereographic grid of 12.5 km, are generated by the Alfred Wegener Institut (AWI). This product is complementary with sea ice thickness measurements from ESA's CryoSat and Copernicus Sentinel-3 missions.
Data - EO Sign In Authentication (Open)

GOCE TEC and ROTI
GOCE total electron content (TEC) and rate of TEC index (ROTI) data.
Data - EO Sign In Authentication (Open)
GOCE Telemetry
This collection contains all GOCE platform and instruments telemetry. For details see the Packets Description file.
Data - EO Sign In Authentication (Open)
GOCE Thermosphere Data
Thermospheric density and crosswind data products derived from GOCE data. Latest baseline _0200. The GOCE+ Air Density and Wind Retrieval using GOCE Data project produced a dataset of thermospheric density and crosswind data products which were derived from ion thruster activation data from GOCE telemetry. The data was combined with the mission's accelerometer and star camera data products. The products provide data continuty and extend the accelerometer-derived thermosphere density data sets from the CHAMP and GRACE missions. The resulting density and wind observations are made available in the form of time series and grids. These data can be applied in investigations of solar-terrestrial physics, as well as for the improvement and validation of models used in space operations. Funded by ESA through the Support To Science Element (STSE) of ESA's Earth Observation Envelope Programme, supporting the science applications of ESA's Living Planet programme, the project was a partnership between TU Delft, CNES and Hypersonic Technology Göttingen. Dataset history Date Change Reason 18/04/2019 - Time series data v2.0, covering the whole mission - Updated data set user manual - New satellite geometry and aerodynamic model - New vertical wind field - New data for the deorbit phase, (GPS+ACC and GPS-only versions) Updated satellite models and additional data 14/07/2016 - Time series data v1.5, covering the whole mission - Updated data set user manual Removal of noisy data 31/07/2014 - Time series data v1.4, covering the whole mission - Gridded data, now including error estimates - Updated data set user manual; Updated validation report; Updated ATBD Full GOCE dataset available 28/09/2013 Version 1.3 density/winds timeseries and gridded data released. User manual updated to v1.3 Bug fix and other changes 04/09/2013 Version 1.2 density/winds timeseries and gridded data released, with user manual First public data release of thermospheric density/winds data
Data - EO Sign In Authentication (Open)

GOCE Level 1
This collection contains the GOCE L1b data of the gradiometer, the star trackers, the GPS receiver, the magnetometers, magnetotorquers and the DFACS data of each accelerometer of the gradiometer. EGG_NOM_1b: latest baseline _0202 SST_NOM_1b: latest baseline _000x (always take the highest number available) ACC_DFx_1b: latest baseline _0001 (x=1:6) MGM_GOx_1b: latest baseline _0001 (x=1:3) MTR_GOC_1b: latest baseline _0001 SST_RIN_1b: latest baseline _000x (always take the highest number available) STR_VC2_1b: latest baseline _000x (always take the highest number available) STR_VC3_1b: latest baseline _000x (always take the highest number available).
Data - EO Sign In Authentication (Open)
GOCE Level 2
This collection contains GOCE level 2 data: Gravity Gradients in the gradiometer reference frame (EGG_NOM_2), in the terrestrial reference frame (EGG_TRF_2), GPS receiver derived precise science orbits (SST_PSO_2) and the non-tidal time variable gravity field potential with respect to a mean value in terms of a spherical harmonic series determined from atmospheric and oceanic mass variations as well as from a GRACE monthly gravity field time series (SST_AUX_2). EGG_NOM_2_: latest baseline: _0203 EGG_TRF_2_: latest baseline _0101 SST_AUX_2_: latest baseline _0001 SST_PSO_2_: latest baseline _0201.
Data - EO Sign In Authentication (Open)
GOCE Global Gravity Field Models and Grids
This collection contains gravity gradient and gravity anomalies grids at ground level and at satellite height. In addition it contains the GOCE gravity field models (EGM_GOC_2, EGM_GCF_2) and their covariance matrices (EGM_GVC_2): GOCE Gravity solution GRIDS Gridded Gravity gradients and anomalies at ground level: GO_CONS_GRC_SPW_2__20091101T000000_20111231T235959_0001.TGZ GO_CONS_GRC_SPW_2__20091101T055147_20120731T222822_0001.TGZ GO_CONS_GRC_SPW_2__20091101T055226_20131020T033415_0002.TGZ GO_CONS_GRC_SPW_2__20091009T000000_20131021T000000_0201.TGZ. Latest baseline is: GO_CONS_GRC_SPW_2__20091009T000000_20131021T000000_0201.TGZ. Gridded Gravity gradients and anomalies at satellite height: GO_CONS_GRD_SPW_2__20091101T055147_20100630T180254_0001.TGZ GO_CONS_GRD_SPW_2__20091101T055147_20120731T222822_0001.TGZ GO_CONS_GRD_SPW_2__20091101T055226_20131020T033415_0002.TGZ GO_CONS_GRD_SPW_2__20091009T000000_20131021T000000_0201.TGZ. Latest baseline is: GO_CONS_GRD_SPW_2__20091009T000000_20131021T000000_0201.TGZ. As output from the ESA-funded GOCE+ GeoExplore project, GOCE gravity gradients were combined with heterogeneous other satellite gravity information to derive a combined set of gravity gradients complementing (near)-surface data sets spanning all together scales from global down to 5 km. The data is useful for various geophysical applications and demonstrate their utility to complement additional data sources (e.g., magnetic, seismic) to enhance geophysical modelling and exploration. The GOCE+ GeoExplore project is funded by ESA through the Support To Science Element (STSE) and was undertaken as a collaboration of the Deutsches Geodätisches Forschungsinstitut (DGFI), Munich, DE, the Christian-Albrechts-Universität zu Kiel, the Geological Survey of Norway (NGU), Trondheim, Norway, TNO, the Netherlands and the University of West Bohemia, Plzen, CZ. Read more about gravity gradients and how GOCE delivered them in this Nature article: Satellite gravity gradient grids for geophysics. View images of the GOCE original gravity gradients and gradients with topographic reduction grids. Available data GRIDS File Type Gridded data: full Gravity Gradients, at 225 km and 255 km with and without topographic correction GGG_225 Computed from GOCE/GRACE gradients lower orbit phase February 2010 - October 2013 GGG_255 Computed from GOCE/GRACE gradients nominal orbit phase February 2010 - October 2013 TGG_225 Gravity gradient grids from topography at fixed height of 225/255 km above ellipsoid given in LNOF (Local North Oriented Frame) TGG_225 Gravity gradient grids from topography at fixed height of 225/255 km above ellipsoid given in LNOF (Local North Oriented Frame) MAPS File Type Maps of Gravity Gradients with and without topographic corrections Vij_225km_Patch_n.jpg Maps of grids from lower orbit phase with and without topographic correction from ETOPO1 Along-orbit File Type Full Gravity Gradients, along-orbit, in GRF and TRF reference frames. A detailed description is provided in the data set user manual GGC_GRF Combined gradients from GRACE (long wavelengths) & GOCE (measurement band) in the GRF (Gradiometer Reference Frame) GGC_TRF Combined gradients from GRACE (long wavelengths) & GOCE (measurement band) rotated from GRF to TRF (Terrestrial Reference Frame: North, West, Up) Direct solution First Generation Product: GO_CONS_EGM_GOC_2__20091101T000000_20100110T235959_0002.TGZ Variance/Covariance matrix: GO_CONS_EGM_GVC_2__20091101T000000_20100110T235959_0002.TGZ Second Generation Product: GO_CONS_EGM_GOC_2__20091101T000000_20100630T235959_0002.TGZ Variance/Covariance matrix: GO_CONS_EGM_GVC_2__20091101T000000_20100630T235959_0001.TGZ Third Generation Product: GO_CONS_EGM_GOC_2__20091101T000000_20110419T235959_0001.TGZ Variance/Covariance matrix: GO_CONS_EGM_GVC_2__20091101T000000_20110419T235959_0001.TGZ Coefficients (ICGEM format): GO_CONS_EGM_GCF_2__20091101T000000_20110419T235959_0001.IDF Fourth Generation Product: GO_CONS_EGM_GOC_2__20091101T000000_20120801T060000_0001.TGZ Variance/Covariance matrix: GO_CONS_EGM_GVC_2__20091101T000000_20120801T060000_0002.TGZ Fifth Generation Product: GO_CONS_EGM_GOC_2__20091101T000000_20131020T235959_0002.TG Variance/Covariance matrix: GO_CONS_EGM_GVC_2__20091101T000000_20131020T235959_0001.TGZ Coefficients (ICGEM format): GO_CONS_EGM_GOC_2__20091101T000000_20131020T235959_0001.IDF Sixth Generation Product: GO_CONS_EGM_GOC_2__20091009T000000_20131020T235959_0201.TGZ Variance/Covariance matrix: GO_CONS_EGM_GVC_2__20091009T000000_20131020T235959_0201.TGZ Coefficients (ICGEM format): GO_CONS_EGM_GOC_2__20091009T000000_20131020T235959_0201.IDF Release 6 gravity model validation report. Time-Wise solution First Generation Product: GO_CONS_EGM_GOC_2__20091101T000000_20100111T000000_0002.TGZ Variance/Covariance matrix: GO_CONS_EGM_GVC_2__20091101T000000_20100111T000000_0002.TGZ Second Generation Product: GO_CONS_EGM_GOC_2__20091101T000000_20100705T235500_0002.TGZ Variance/Covariance matrix: GO_CONS_EGM_GVC_2__20091101T000000_20100705T235500_0001.TGZ Third Generation Product: GO_CONS_EGM_GOC_2__20091101T000000_20110430T235959_0001.TGZ Variance/Covariance matrix: GO_CONS_EGM_GVC_2__20091101T000000_20110430T235959_0001.TGZ Coefficients (ICGEM format): GO_CONS_EGM_GCF_2__20091101T000000_20110430T235959_0001.IDF Fourth Generation Product: GO_CONS_EGM_GOC_2__20091101T000000_20120618T235959_0002.TGZ Variance/Covariance matrix: GO_CONS_EGM_GVC_2__20091101T000000_20120618T235959_0001.TGZ Fifth Generation Product: GO_CONS_EGM_GOC_2__20091101T000000_20131021T000000_0002.TGZ Variance/Covariance matrix: GO_CONS_EGM_GVC_2__20091101T000000_20131021T000000_0001.TGZ Coefficients (ICGEM format): GO_CONS_EGM_GOC_2__20091101T000000_20131021T000000_0001.IDF Sixth Generation Product: GO_CONS_EGM_GOC_2__20091009T000000_20131021T000000_0201.TGZ Variance/Covariance matrix: GO_CONS_EGM_GVC_2__20091009T000000_20131021T000000_0202.TGZ Coefficients (ICGEM format): GO_CONS_EGM_GOC_2__20091009T000000_20131021T000000_0201.IDF Combined gravity field GOCE model plus Antarctic and Arctic data (ICGEM format): GO_CONS_EGM_GOC_2__20091009T000000_20160119T235959_0201.IDF Download release 6 gravity model validation report.
Data - External Data (Restrained)

ADAM Surface Reflectance Database v4.0
ADAM enables generating typical monthly variations of the global Earth surface reflectance at 0.1° spatial resolution (Plate Carree projection) and over the spectral range 240-4000 nm. The ADAM product is made of gridded monthly mean climatologies over land and ocean surfaces, and of a companion API toolkit that enables the calculation of hyperspectral (at 1 nm resolution over the whole 240-4000 nm spectral range) and multidirectional reflectances (i.e. in any illumination/viewing geometry) depending on user choices. The ADAM climatologies that feed the ADAM calculation tools are: For ocean: Monthly chlorophyll concentration derived from SeaWiFS-OrbView-2 (1999-2009); it is used to compute the water column reflectance (which shows large spectral variations in the visible, but is insignificant in the near and mid infrared). Monthly wind speed derived from SeaWinds-QuikSCAT-(1999-2009); it is used to calculate the ocean glint reflectance. For land: Monthly normalized surface reflectances in the 7 MODIS narrow spectral bands derived from FondsdeSol processing chain of MOD09A1 products (derived from Aqua and Terra observations), on which relies the modelling of the hyperspectral/multidirectional surface (soil/vegetation/snow) reflectance. Uncertainty variance-covariance matrix for the 7 spectral bands associated to the normalized surface reflectance. For sea-ice: Sea ice pixels (masked in the original MOD09A1 products) have been accounted for by a gap-filling approach relying on the spatial-temporal distribution of sea ice coverage provided by the CryoClim climatology for year 2005.
Data - Campaigns (Open)
THERMOPOLIS
The THERMOPOLIS 2009 campaign mainly served the DUE “Urban Heat islands (UHI) and Urban Thermography (UT) Project”