- Learn & Discover
- Heritage data trains neural ne...
Heritage data trains neural networks to detect urban sprawl
27 Sep 2022
Using data from non-operational ESA remote sensing missions, researchers have trained a network of artificial neurons to recognise how cities change over decades. They hope this will help city planners reduce the impact that urbanisation has on the environment.
Over half of global citizens live in urban areas and our cities are expanding more rapidly than ever.
Monitoring the changing footprint of urban areas is essential to ensure that infrastructure development doesn’t negatively impact the environment or create urban sprawl.
A research project based at the national supercomputing centre of the Czech Republic, IT4Innovations - VSB Technical University of Ostrava, in collaboration with the University of Leeds in the UK, has used long time series of Earth observation (EO) data to successfully train neural network models to detect urban change.
This application of trained neural networks for urban change detection originated from a case-study for demonstration purposes in the ESA funded Blockchain ENabled DEep Learning for Space Data (BLENDED) project.
The models leverage “deep-temporal” data, meaning hundreds, or up to thousands of synthetic aperture radar (SAR) and optical multispectral observations were used to train the network in a fully automated process.
Data from the non-operational European Remote Sensing Satellites (ERS-1 and ERS-2) accessed via ESA’s Heritage Space programme, were used, as well as data from the Landsat 5 Thematic Mapper (TM) and the Copernicus Sentinel missions.
Vast heritage data archive
Lead researcher Georg Zitzlsberger, from IT4Innovations, VSB Technical University of Ostrava, says: “Using long-term historical data from ERS was essential in providing the model – in the time period 1991-2011 - with sufficiently vast amounts of temporal data to train the network in urban change detection.”
The ERS-1/2 product used for observations was Level 1 SAR precision image product 1477, accessible for free from the ESA data dissemination systems.
The ESA SNAP tool was used for pre-processing the ERS data, so they were properly aligned with the optical observations.
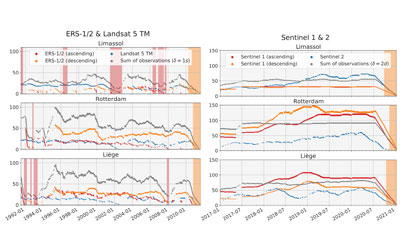
For the period 1991-2011, the project paired the SAR data from ERS-1/2 with optical data from Landsat 5 TM. Additionally, a second network with the same architecture was trained using SAR and optical data from Copernicus Sentinel-1 and 2, in the period 2017 to the present day.
Both models cover a range of over two and a half decades. Since they’ve been trained identically, they can help monitor both current and past urban changes.
Combining optical and SAR data
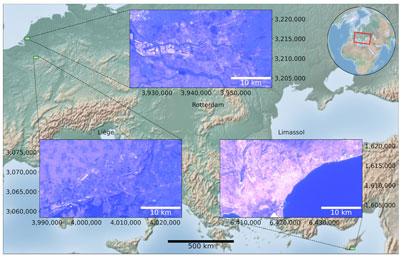
For each model, three different urban sites were used – Limassol (Cyprus), Rotterdam (Netherlands) and Liège (Belgium) – of at least 500 square kilometres in size. The first two were used for training, the latter for evaluation purposes.
“These sites were selected to represent different challenges in training a common neural network due to atmospheric effects, different geographies, and observation coverage,” says Zitzlsberger.
To combine the benefit of both remote sensing types, the network models are comprised of ensembles of optical- and SAR-specialised sub-networks.
Zitzlsberger adds, “The idea was to work with multi-type data - to combine SAR with optical. SAR has a higher spatial resolution – the ERS datasets had a spatial resolution in the order of 12.5 metres/pixel - while the Landsat 5 optical data provides up to 30 metres/pixel.
“Using radar meant we could also avoid the atmospheric problems of optical data and compensate to some extent for outages - when no data is available - as happened for Landsat 5 TM from 2002 to 2003 due to sensor issues.
Futureproofing for wider use
“Thanks to the free availability of historic EO data, such as ERS-1/2, modern methods can be designed for and applied to previous sensor generations. This opens up new possibilities, such as automatic historic analysis, as in the example of a train track construction near the city of Liège (2000-2010).”
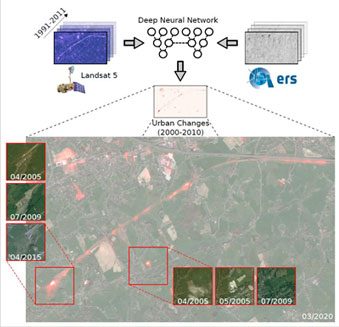
In this example the deep neural network could identify areas that were temporarily impacted by the construction. The processing highlights the variances so it could point out hotspots of the construction.
The next step in the research is to make the model customisable, so users may select which urban changes are of interest. For example, a user can decide to classify an area as urban only if it has concrete and not exposed soil.
The current implementation and trained models are available publicly to enable others to utilise fully automated continuous urban monitoring.
The applications are numerous – from effectively monitoring urban sprawl trends - to tracking the environmental impact of rapid urban construction or simply identifying new settlements.
References:
Zitzlsberger, G. et al. “Neural Network-Based Urban Change Monitoring with Deep-Temporal Multispectral and SAR Remote Sensing Data” Remote Sens. 2021, 13(15), 3000; https://doi.org/10.3390/rs13153000