SMOS Quality Control Reports are available in different varieties covering quality monitoring of science and calibration products, verification and validation of reprocessed products, providing monthly overviews of the health of MIRAS instrument, and any anomalies that may affect the quality of data acquired.
MIRAS anomalies and mission impact - Download a technical note describing the anomalies that have occurred since MIRAS became operational, and may impact the quality of data acquired.
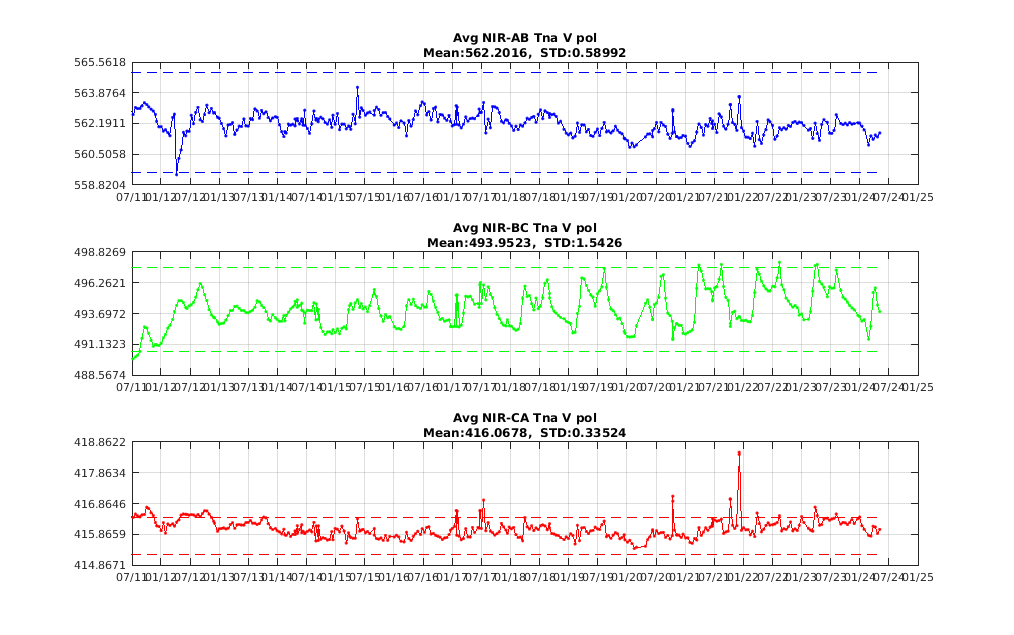
Download chart Noise Injection Radiometers (NIRs) internal diode noise temperature (Tna) for vertical polarisation receiver (V) evolution since the beginning of the mission for the three NIR unit: AB (blue), BC (green) and CA (red). At the beginning of the mission Tna has evolved differently among the three NIR units until October 2014 when warm-NIR calibration was introduced. In this configuration the Sun is located slightly above the instrument horizon, improving NIR thermal stability and calibration accuracy noticeably. The unit CA has shown to be more stable, since beginning of the mission.
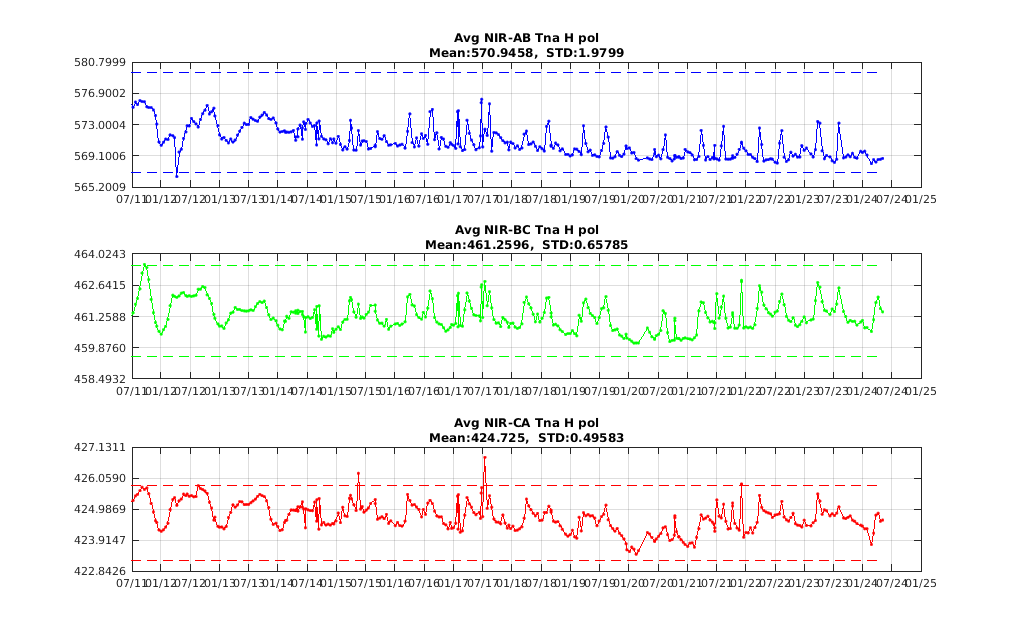
Download chart Noise Injection Radiometers (NIRs) internal diode noise temperature (Tna) for horizontal polarisation receiver (H) evolution since the beginning of the mission for the three NIR unit: AB (blue), BC (green) and CA (red). At the beginning of the mission Tna has evolved differently among the three NIR units until October 2014 when warm-NIR calibration was introduced. In this configuration the Sun is located slightly above the instrument horizon, improving NIR thermal stability and calibration accuracy noticeably. The unit CA has shown to be more stable, since beginning of the mission.
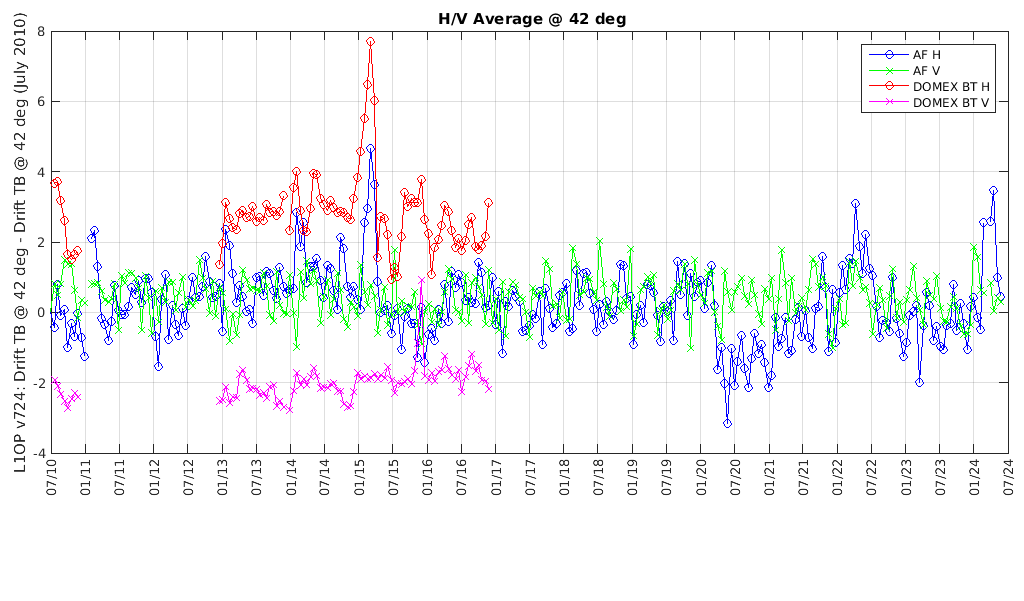
Download chart L-band Brightness Temperature evolution over Concordia Station (Dome-C Antarctica). SMOS measurements at 42 incidence angle averaged every 18 days at surface horizontal polarisation (blue line) and at surface vertical polarisation (green line). In-situ DOMEX measurements at 42 incidence angle averaged over the same period at horizontal polarisation (red line) and at vertical polarisation (purple line). Reference value for July 2010 is subtracted. SMOS brightness temperature evolution in vertical polarisation is very well correlated with in-situ measurements, stability, since the beginning of the mission, is within about 1K. The brightness temperature in horizontal polarisation is less stable and impacted by geophysical condition at surface level as confirmed by DOMEX measurement evolution. In particular, the drift in horizontal polarisation around beginning of 2015 was due to a change on surface geophysical condition due to snow accumulation since November 2014 and rapidly evolution of snow density on 22 March 2015 when a strong wind event has rapidly changed the surface condition and surface emissivity around Dome-C. Differences in vertical and horizontal polarisation top of atmosphere absolute value between SMOS and DOMEX measurements are under investigation.
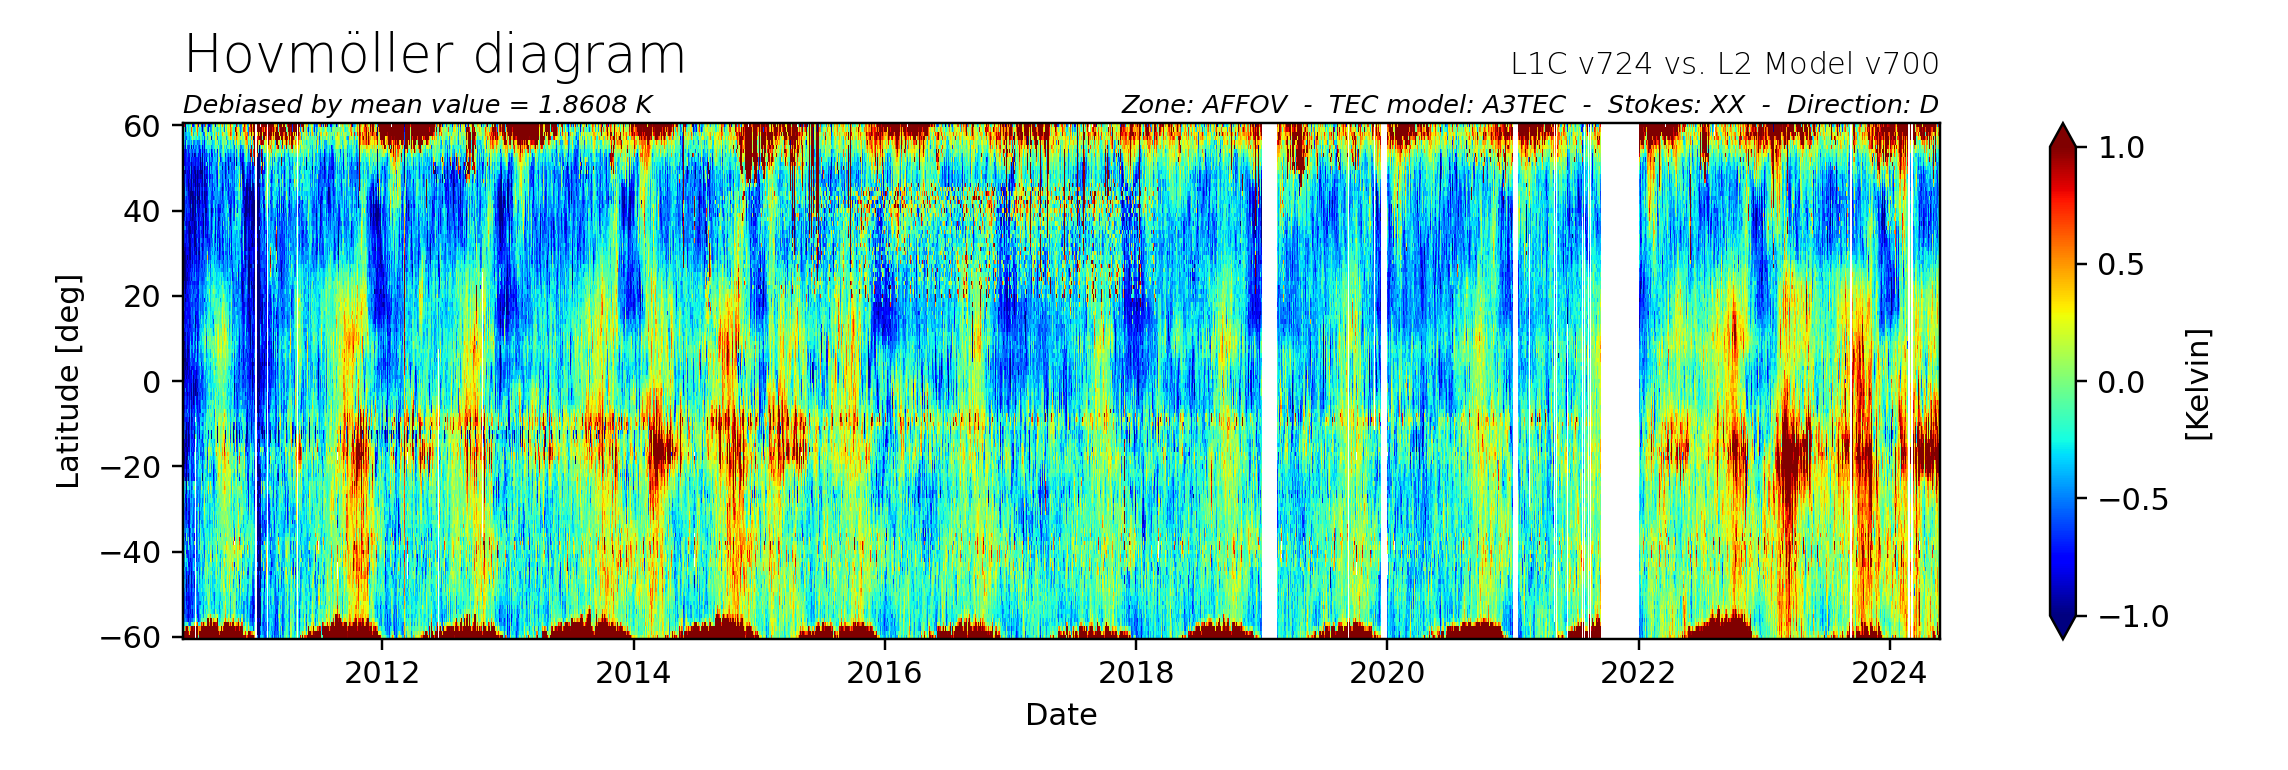
Download chart Hovmoller plot for L-band brightness temperature differences between SMOS measurements and ocean forward model over Pacific Ocean (between 160 and 220 degree longitude) for ascending orbit direction and horizontal polarisation at antenna frame since June 2010. In-situ Analysis System (ISAS) Objective Analysis (OA) observatios were used in the ocean forward model to reduce the geophysical contribution in the differences. The straight blue line below the equator visible till December 2013 was due to Radio Frequency Interference (RFI) contamination around 180 deg longitude. Noise due to RFI is also present in years 2015 -2017 between latitude 0 deg. and 20 deg.
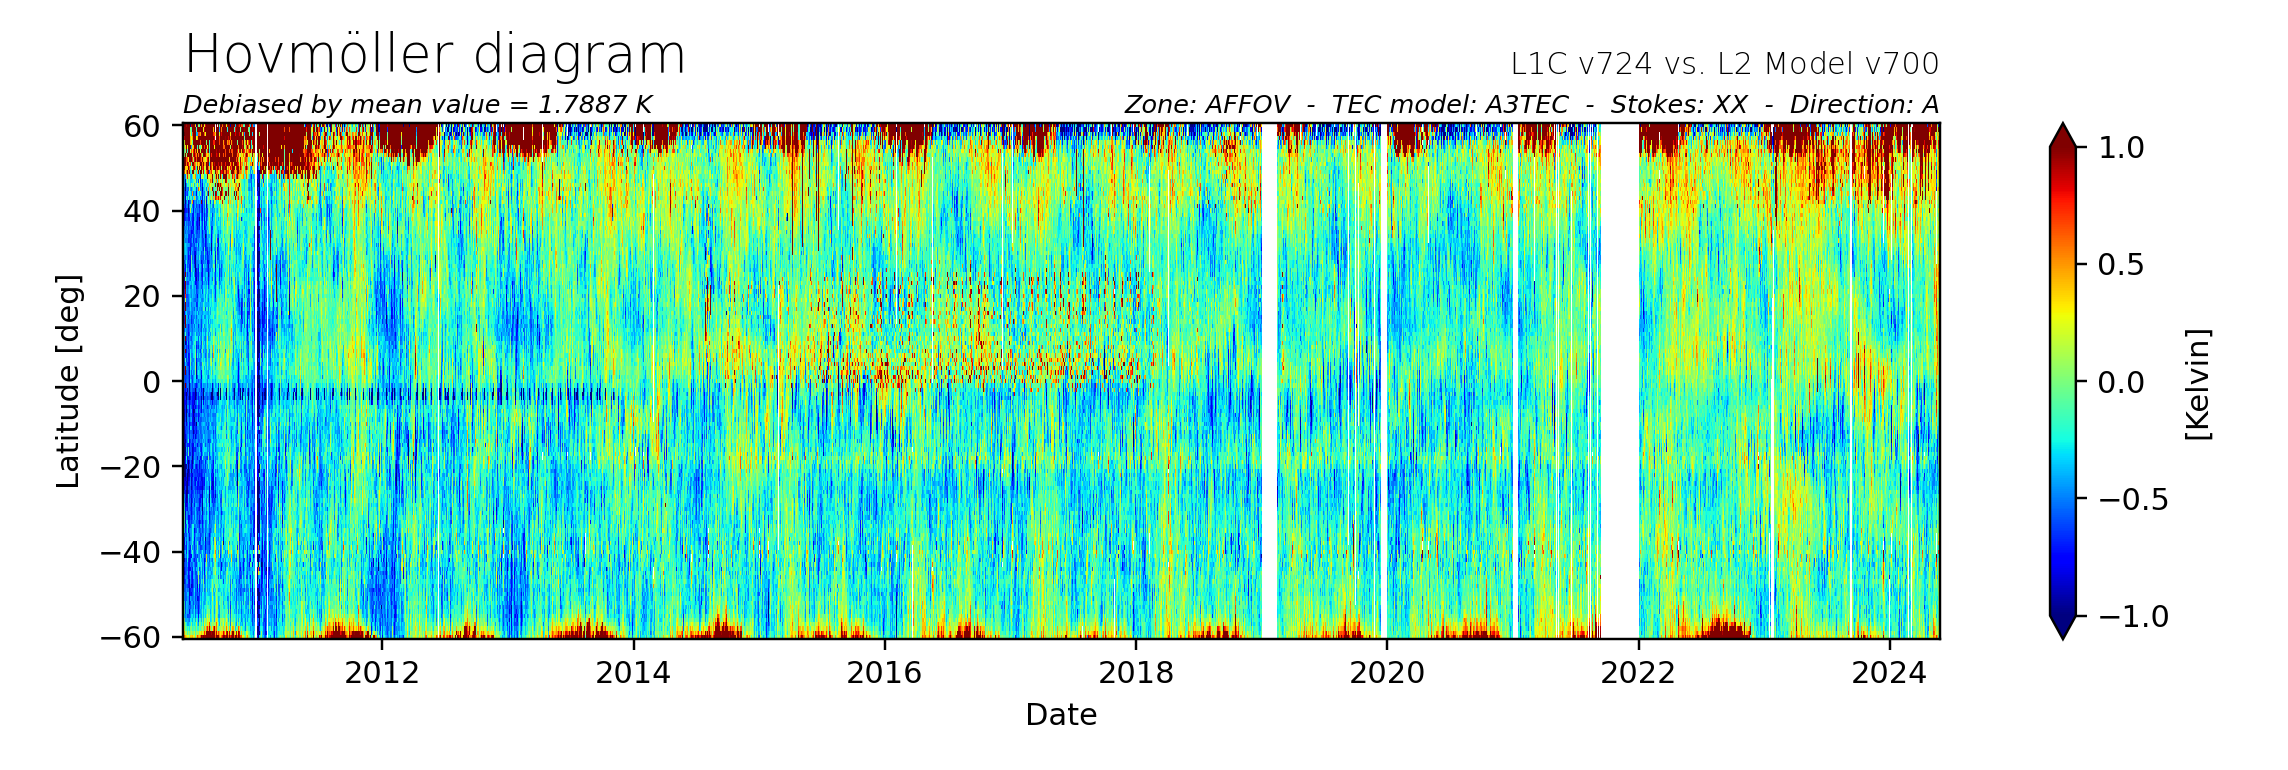
Download chart Hovmoller plot for L-band brightness temperature differences between SMOS measurements and ocean forward model over Pacific Ocean (between 160 and 220 degree longitude) for descending orbit direction and horizontal polarisation at antenna frame since June 2010. In-situ Analysis System (ISAS) Objective Analysis (OA) observatios were used in the ocean forward model to reduce the geophysical contribution in the differences. Radio Frequency Interference (RFI) contamination is present in years 2016 -2017 between latitude 20 deg. and 40 deg.
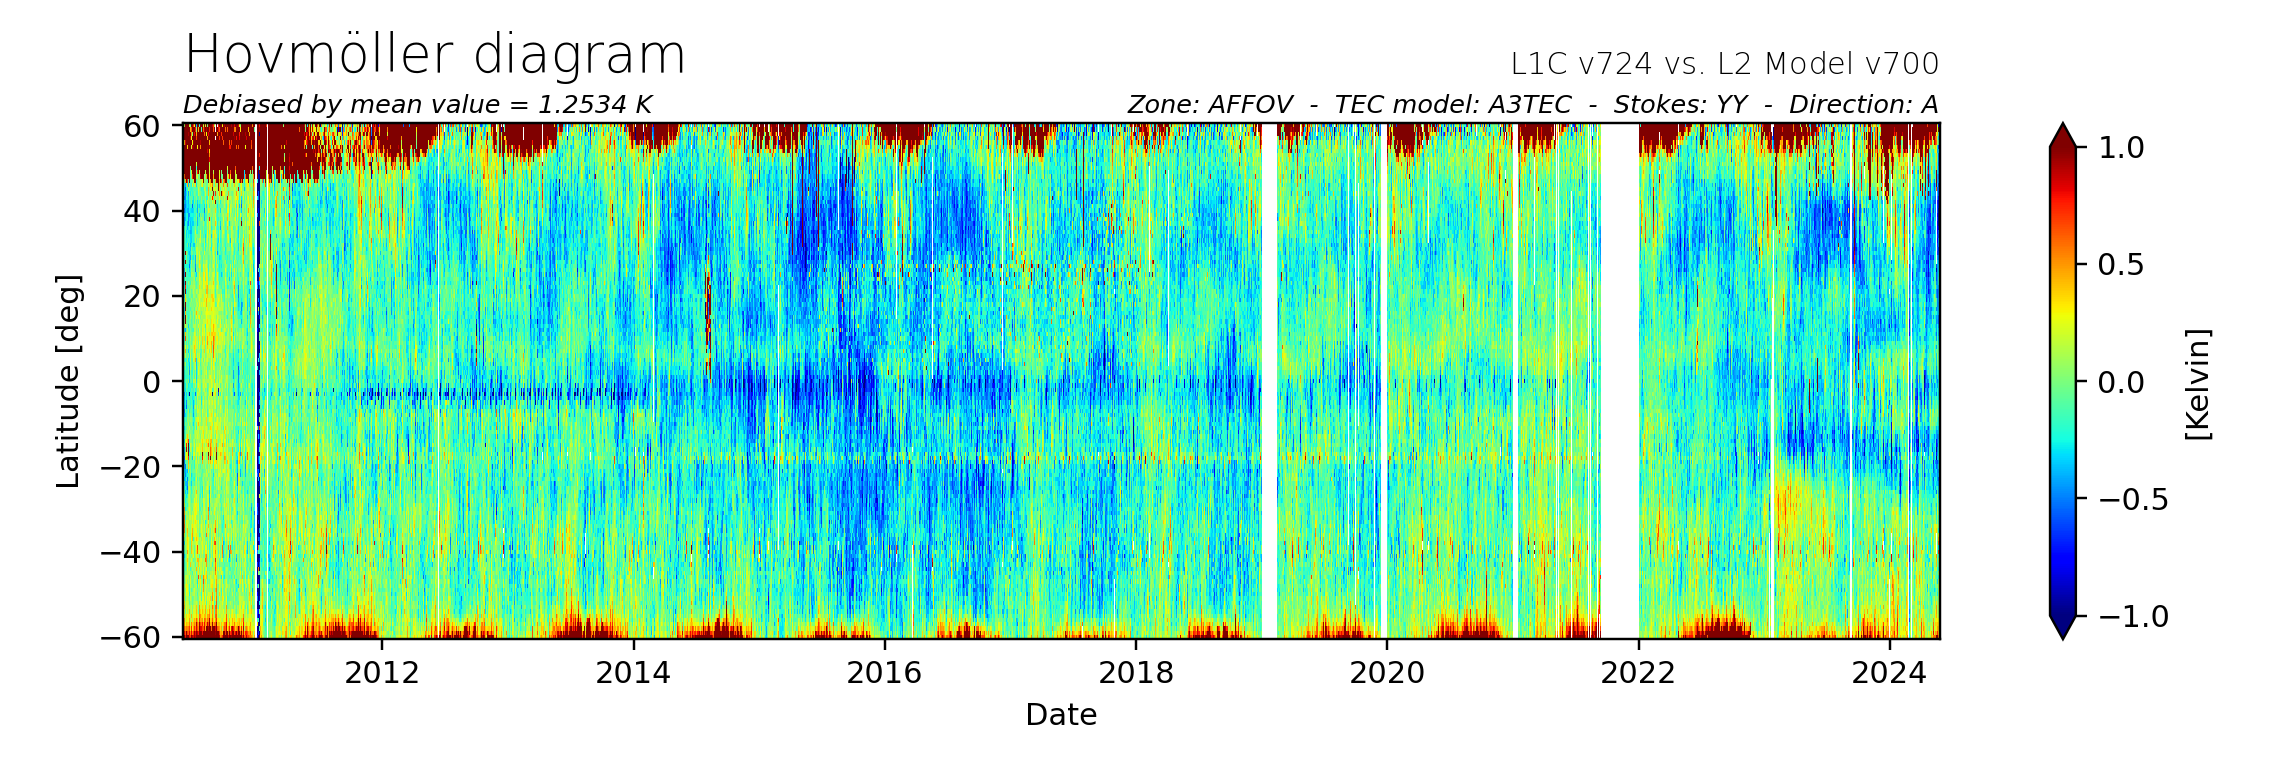
Download chart Hovmoller plot for L-band brightness temperature differences between SMOS measurements and ocean forward model over Pacific Ocean (between 160 and 220 degree longitude) for ascending orbit direction and vertical polarisation at antenna frame since June 2010. In-situ Analysis System (ISAS) Objective Analysis (OA) observatios were used in the ocean forward model to reduce the geophysical contribution in the differences. The straight blue line below the equator visible till December 2013 was due to Radio Frequency Interference (RFI) contamination around 180 deg longitude.
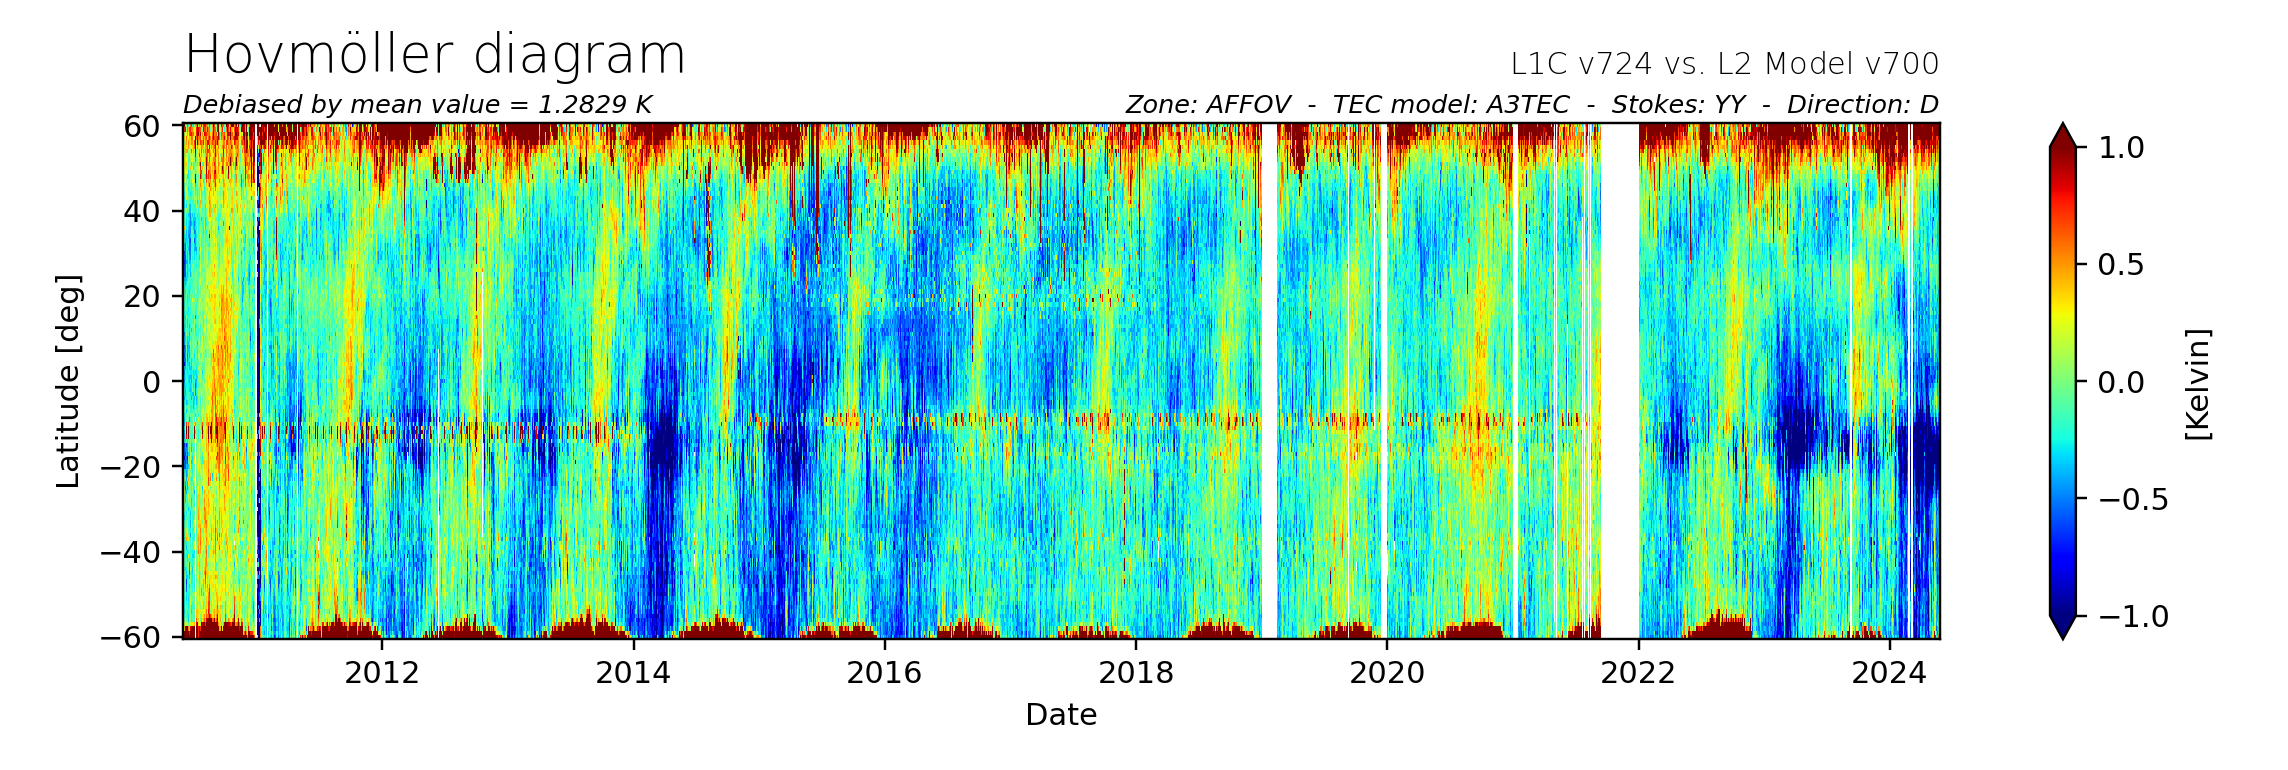
Download chart Hovmoller plot for L-band brightness temperature differences between SMOS measurements and ocean forward model over Pacific Ocean (between 160 and 220 degree longitude) for descending orbit direction and vertical polarisation at antenna frame since June 2010. In-situ Analysis System (ISAS) Objective Analysis (OA) observatios were used in the ocean forward model to reduce the geophysical contribution in the differences.
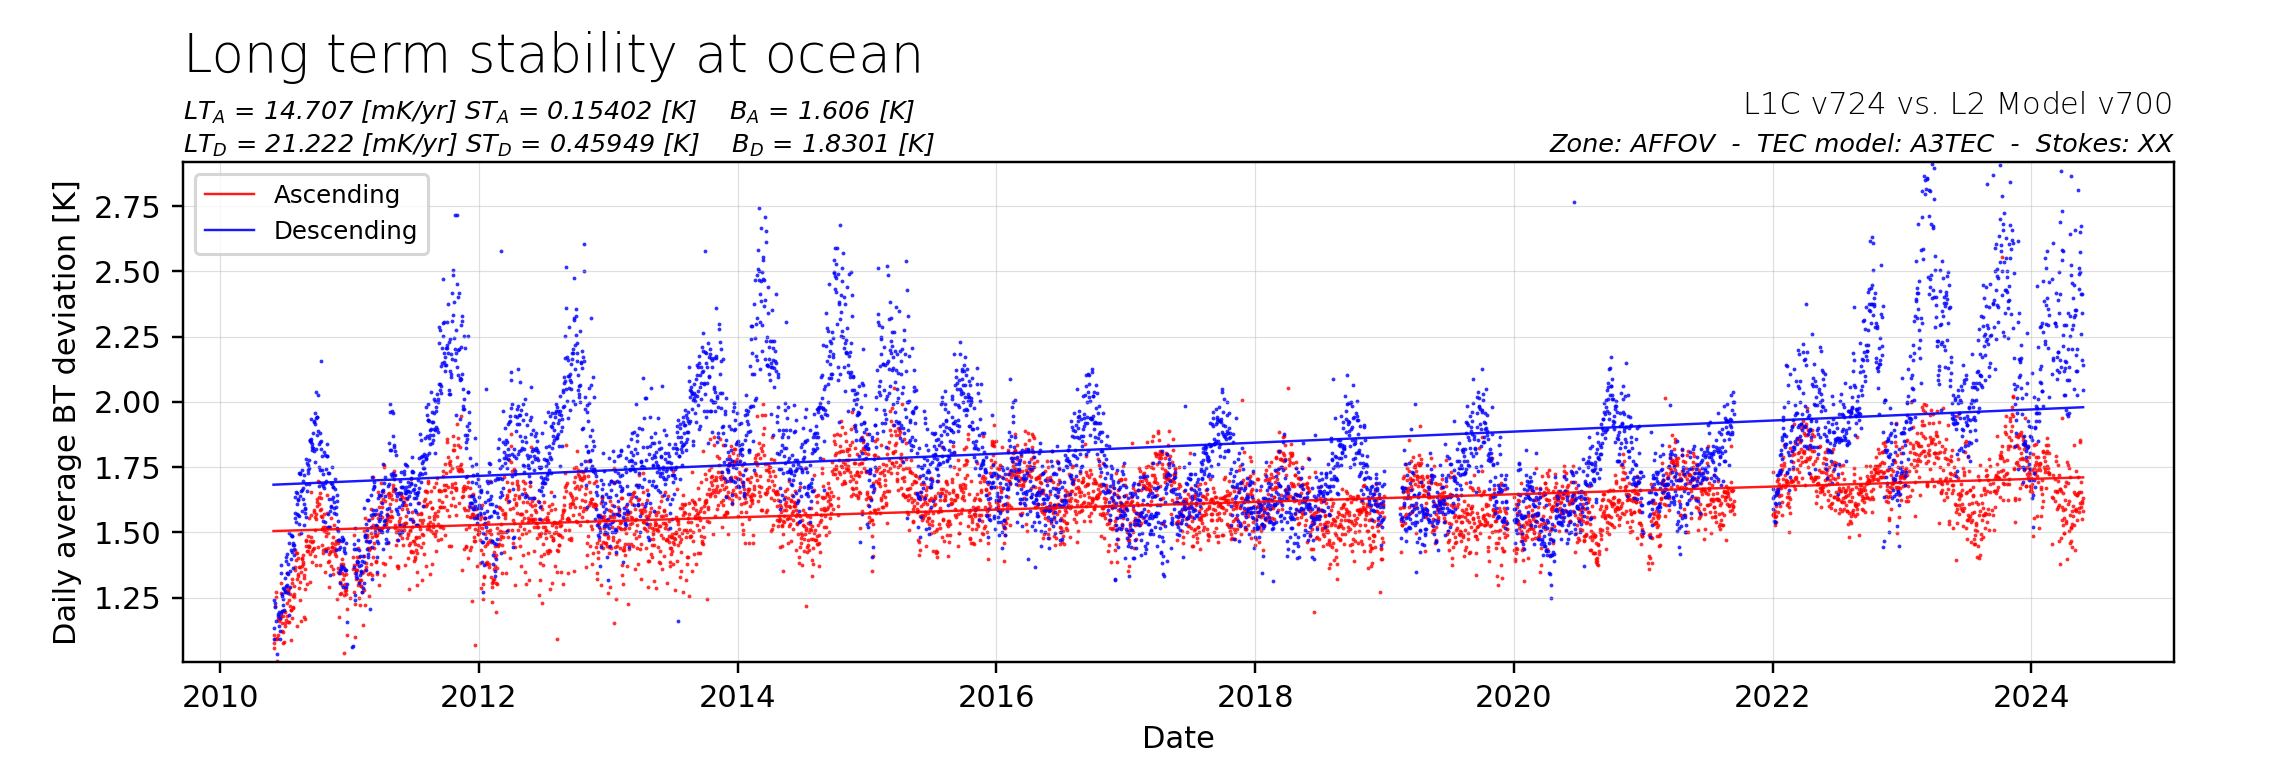
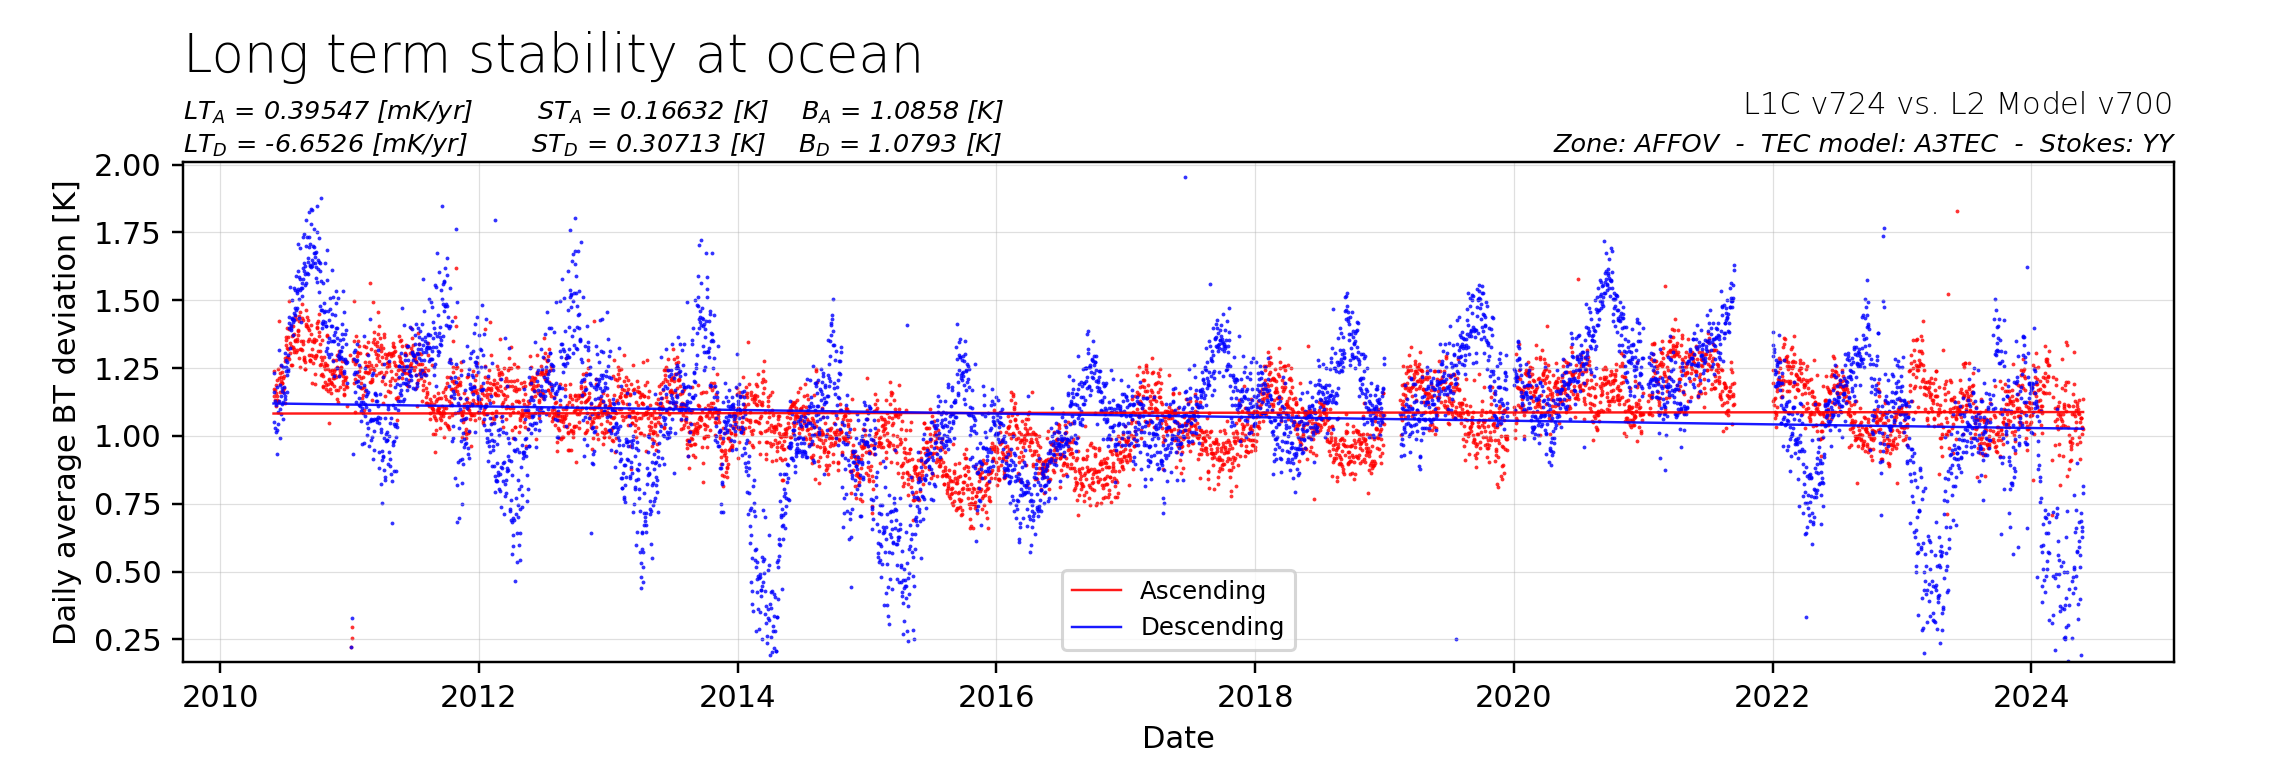
Download chart Evolution of the L-band brightness temperature differences between SMOS measurements and ocean forward model over Pacific Ocean (area between 160, 220 degree longitude and -60, +60 degree latitude) for horizontal and vertical polarisation at antenna frame since June 2010 for ascending orbit direction. In-situ Analysis System (ISAS) Objective Analysis (OA) observatios were used in the ocean forward model to reduce the geophysical contribution in the differences.
Download chart Evolution of the L-band brightness temperature differences between SMOS measurements and ocean forward model over Pacific Ocean (area between 160, 220 degree longitude and -60, +60 degree latitude) for horizontal and vertical polarisation at antenna frame since June 2010 for descending orbit direction. In-situ Analysis System (ISAS) Objective Analysis (OA) observatios were used in the ocean forward model to reduce the geophysical contribution in the differences.
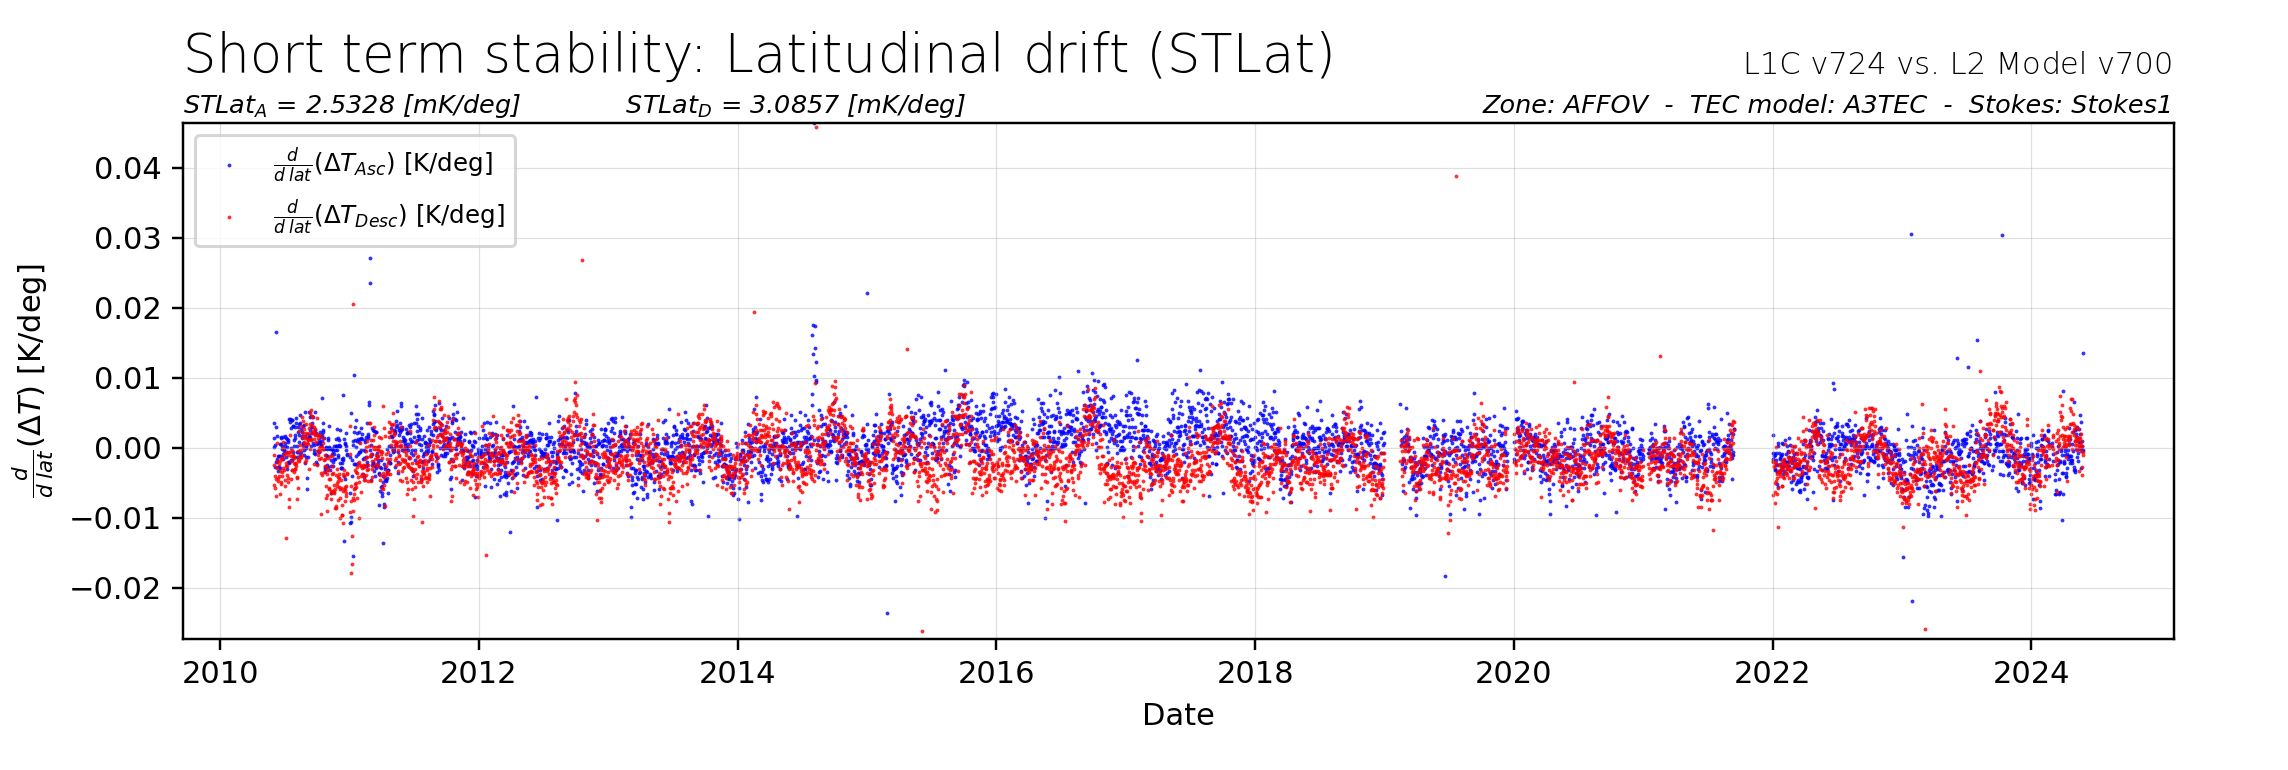
Download chart Evolution of the L-band brightness temperature differences between SMOS measurements at descending and ascending orbit direction over Pacific Ocean (area between 160, 220 degree longitude and -50, +20 degree latitude) for first Stokes since June 2010.
M. Martín-Neira, R.Oliva, I. Corbella, F. Torres, N. Duffo, I. Duránc, J. Kainulainend, J. Closa, A. Zurita, F. Cabot, A. Khazaal, E. Anterrieu, J. Barbosa, G. Lopes, J. Tenerelli, R. Díez-García, J. Fauste, F. Martín-Porqueras, V. González-Gambau, A. Turiel, S. Delwart, R. Crapolicchio, M. Suess; SMOS instrument performance and calibration after six years in orbit; Remote Sensing of Environment 180 (2016) 19–39
Weekly maps of good quality sea surface salinity retrieved from SMOS measurements and corrected for land-sea contamination for ascending orbit direction are available in MP4 format. Lack of data in the maps is mainly due to contamination from Radio Frequency Interference (RFI) coming from land sites or ships and presence of sea-ice. In the descending file, Seasonal lack of good retrieval in the Northern Hemisphere is present during the period from November to February.
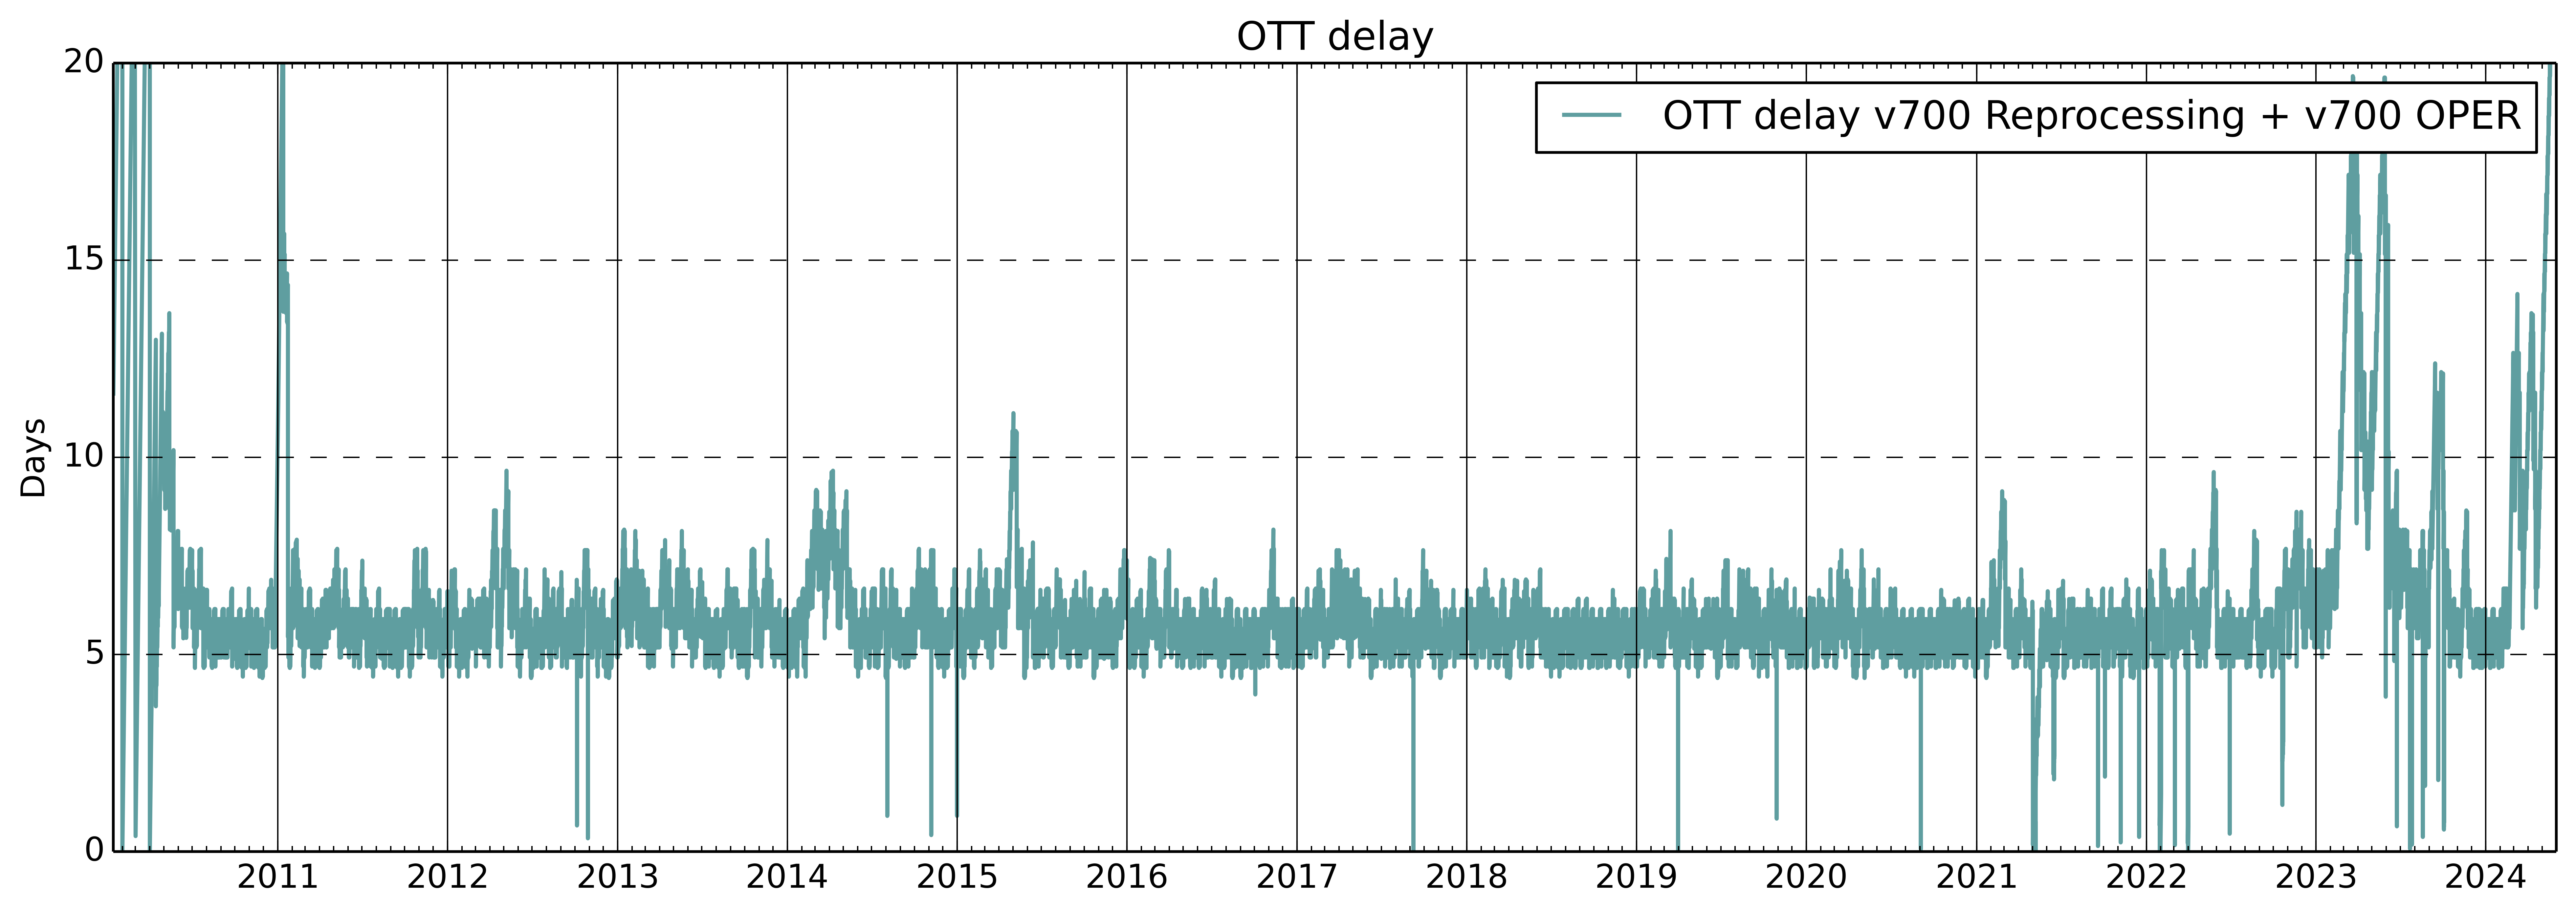
Download chart Ocean Target Transformation (OTT) correction is computed daily by using about 10 previous orbits acquired over selected area and an ocean forward model. The OTT it is used to remove spatial biases in the brightness temperature images and it is needed to retrieve sea surface salinity. The plot shows the OTT latency time defined as the differences between the mean acquisition time of 10 orbits and the sensing time of the data acquisition processed with the OTT. Nominal latency time is about 6 days, periods with higher latency time indicates lack of data as in January 2011 due to on board execution of the instrument electrical stability test, or data rejection due to Radio Frequency Interference corrupted measurement as for example in April 2014.
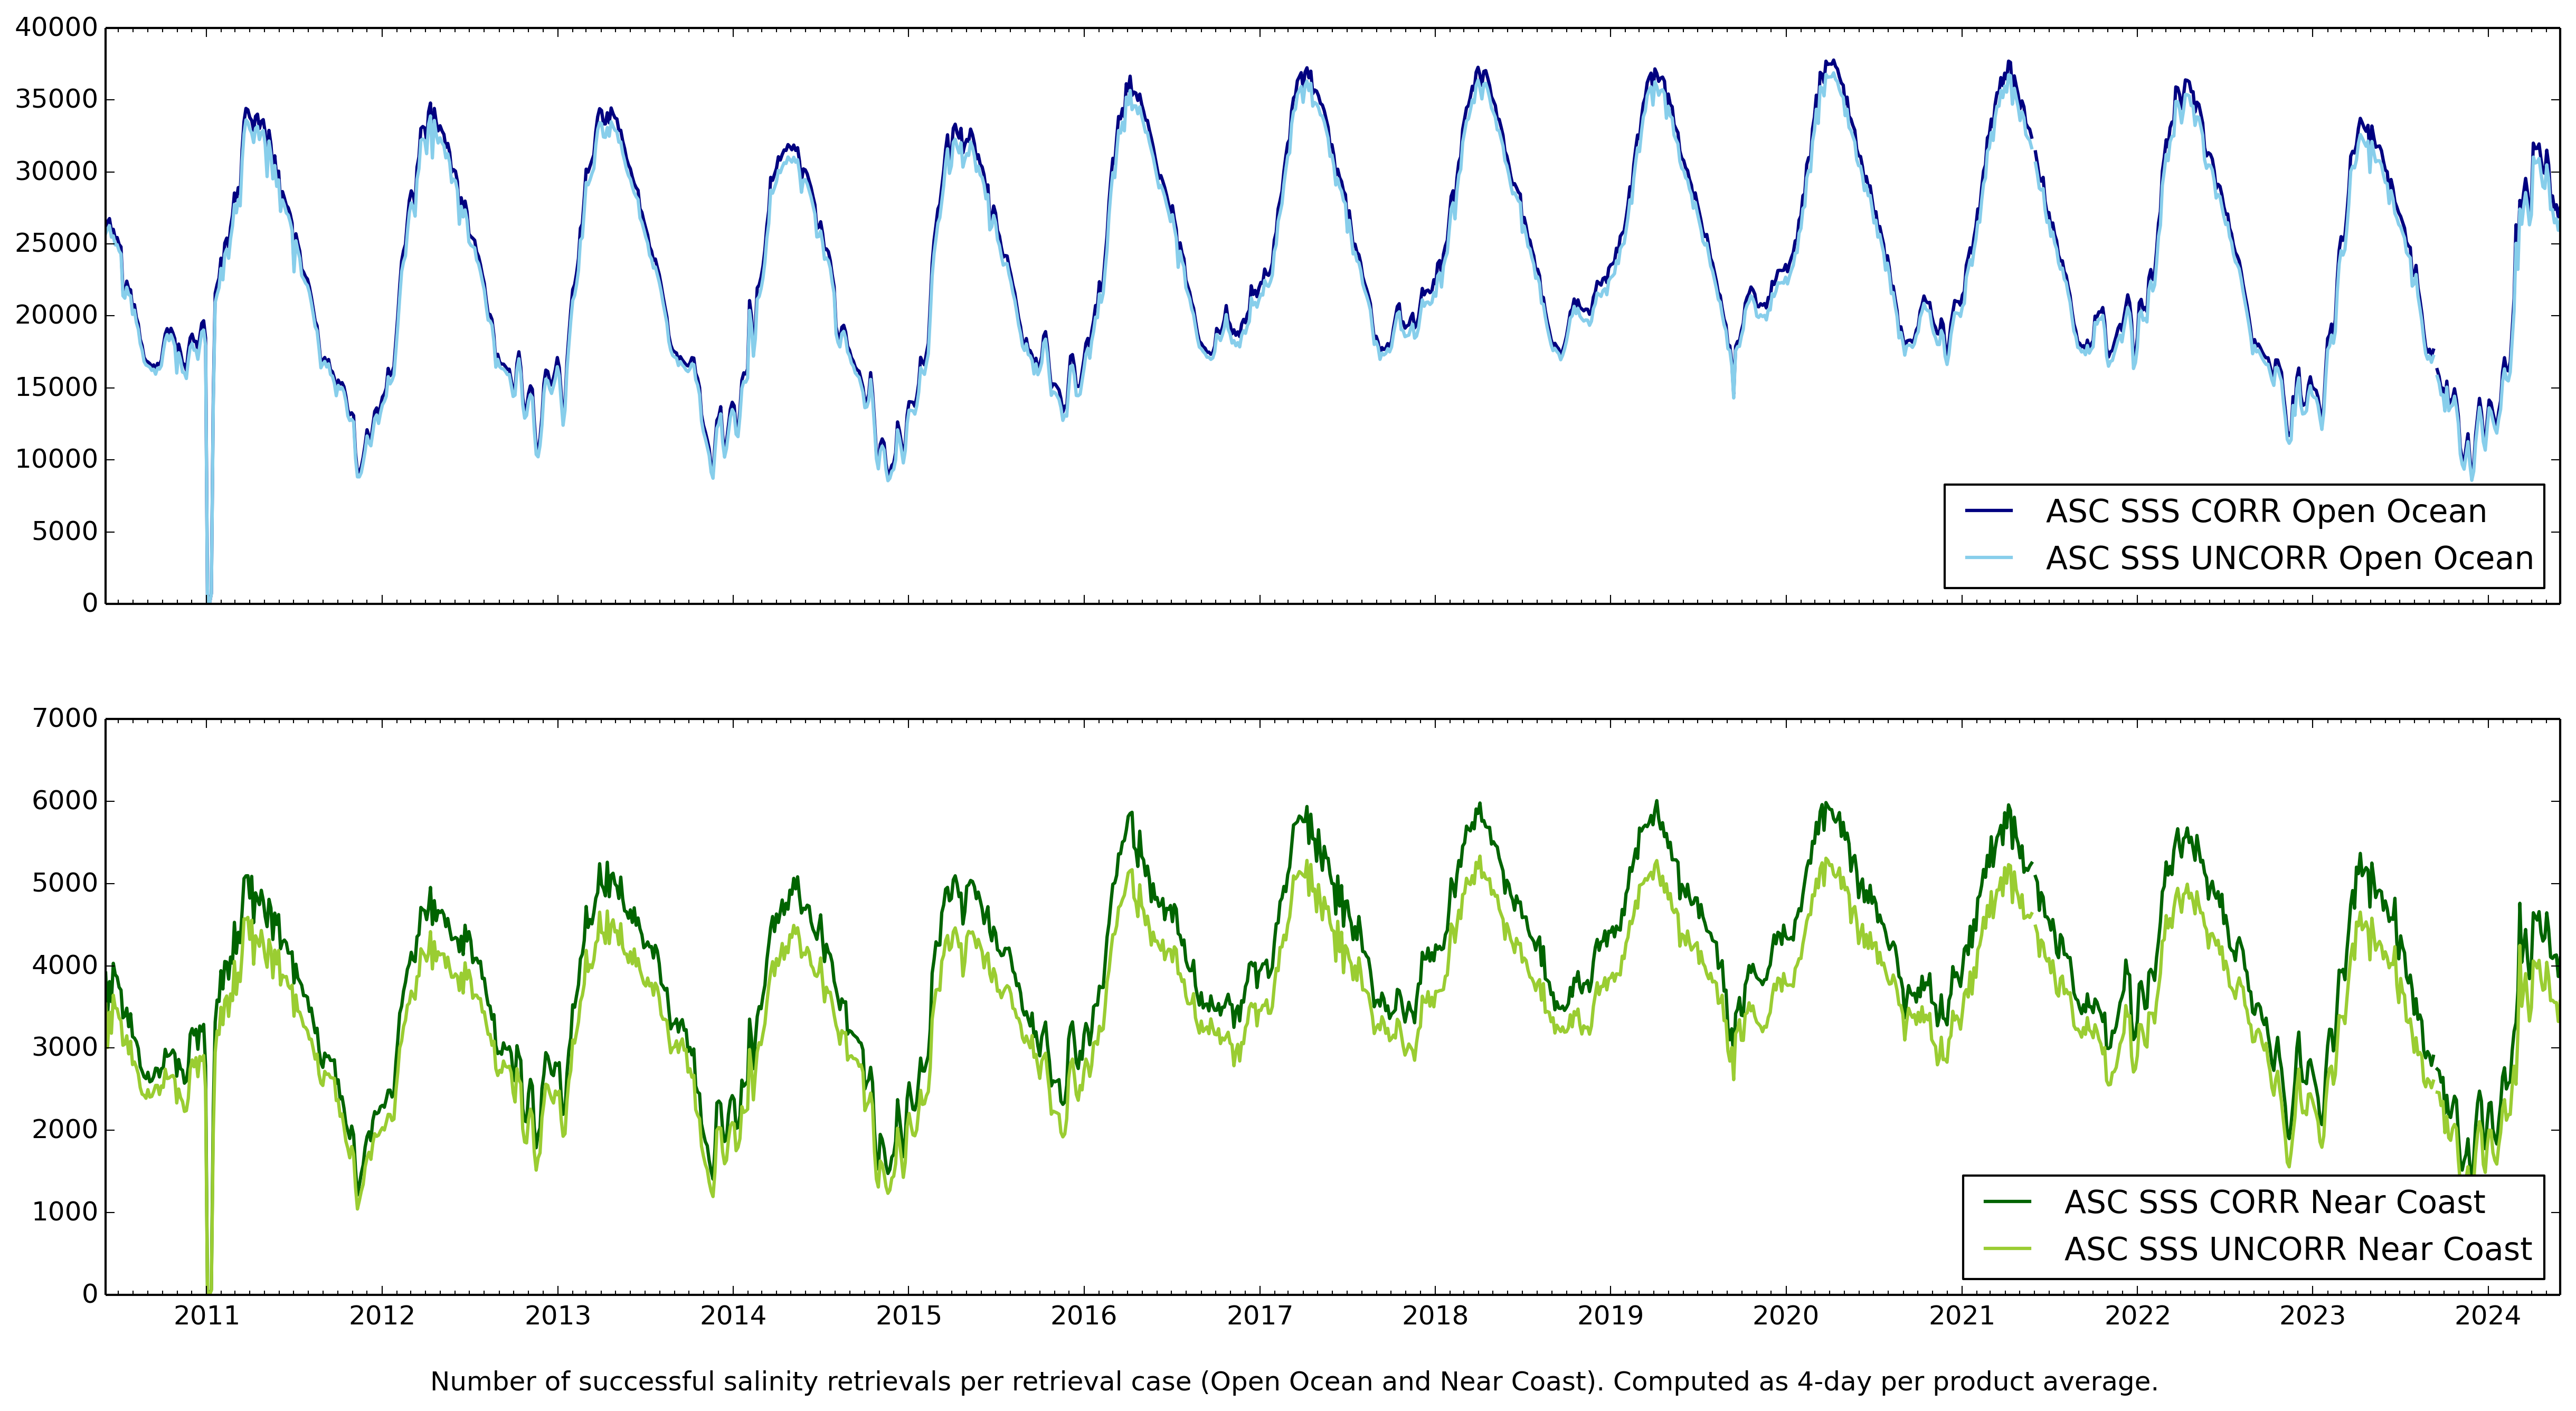
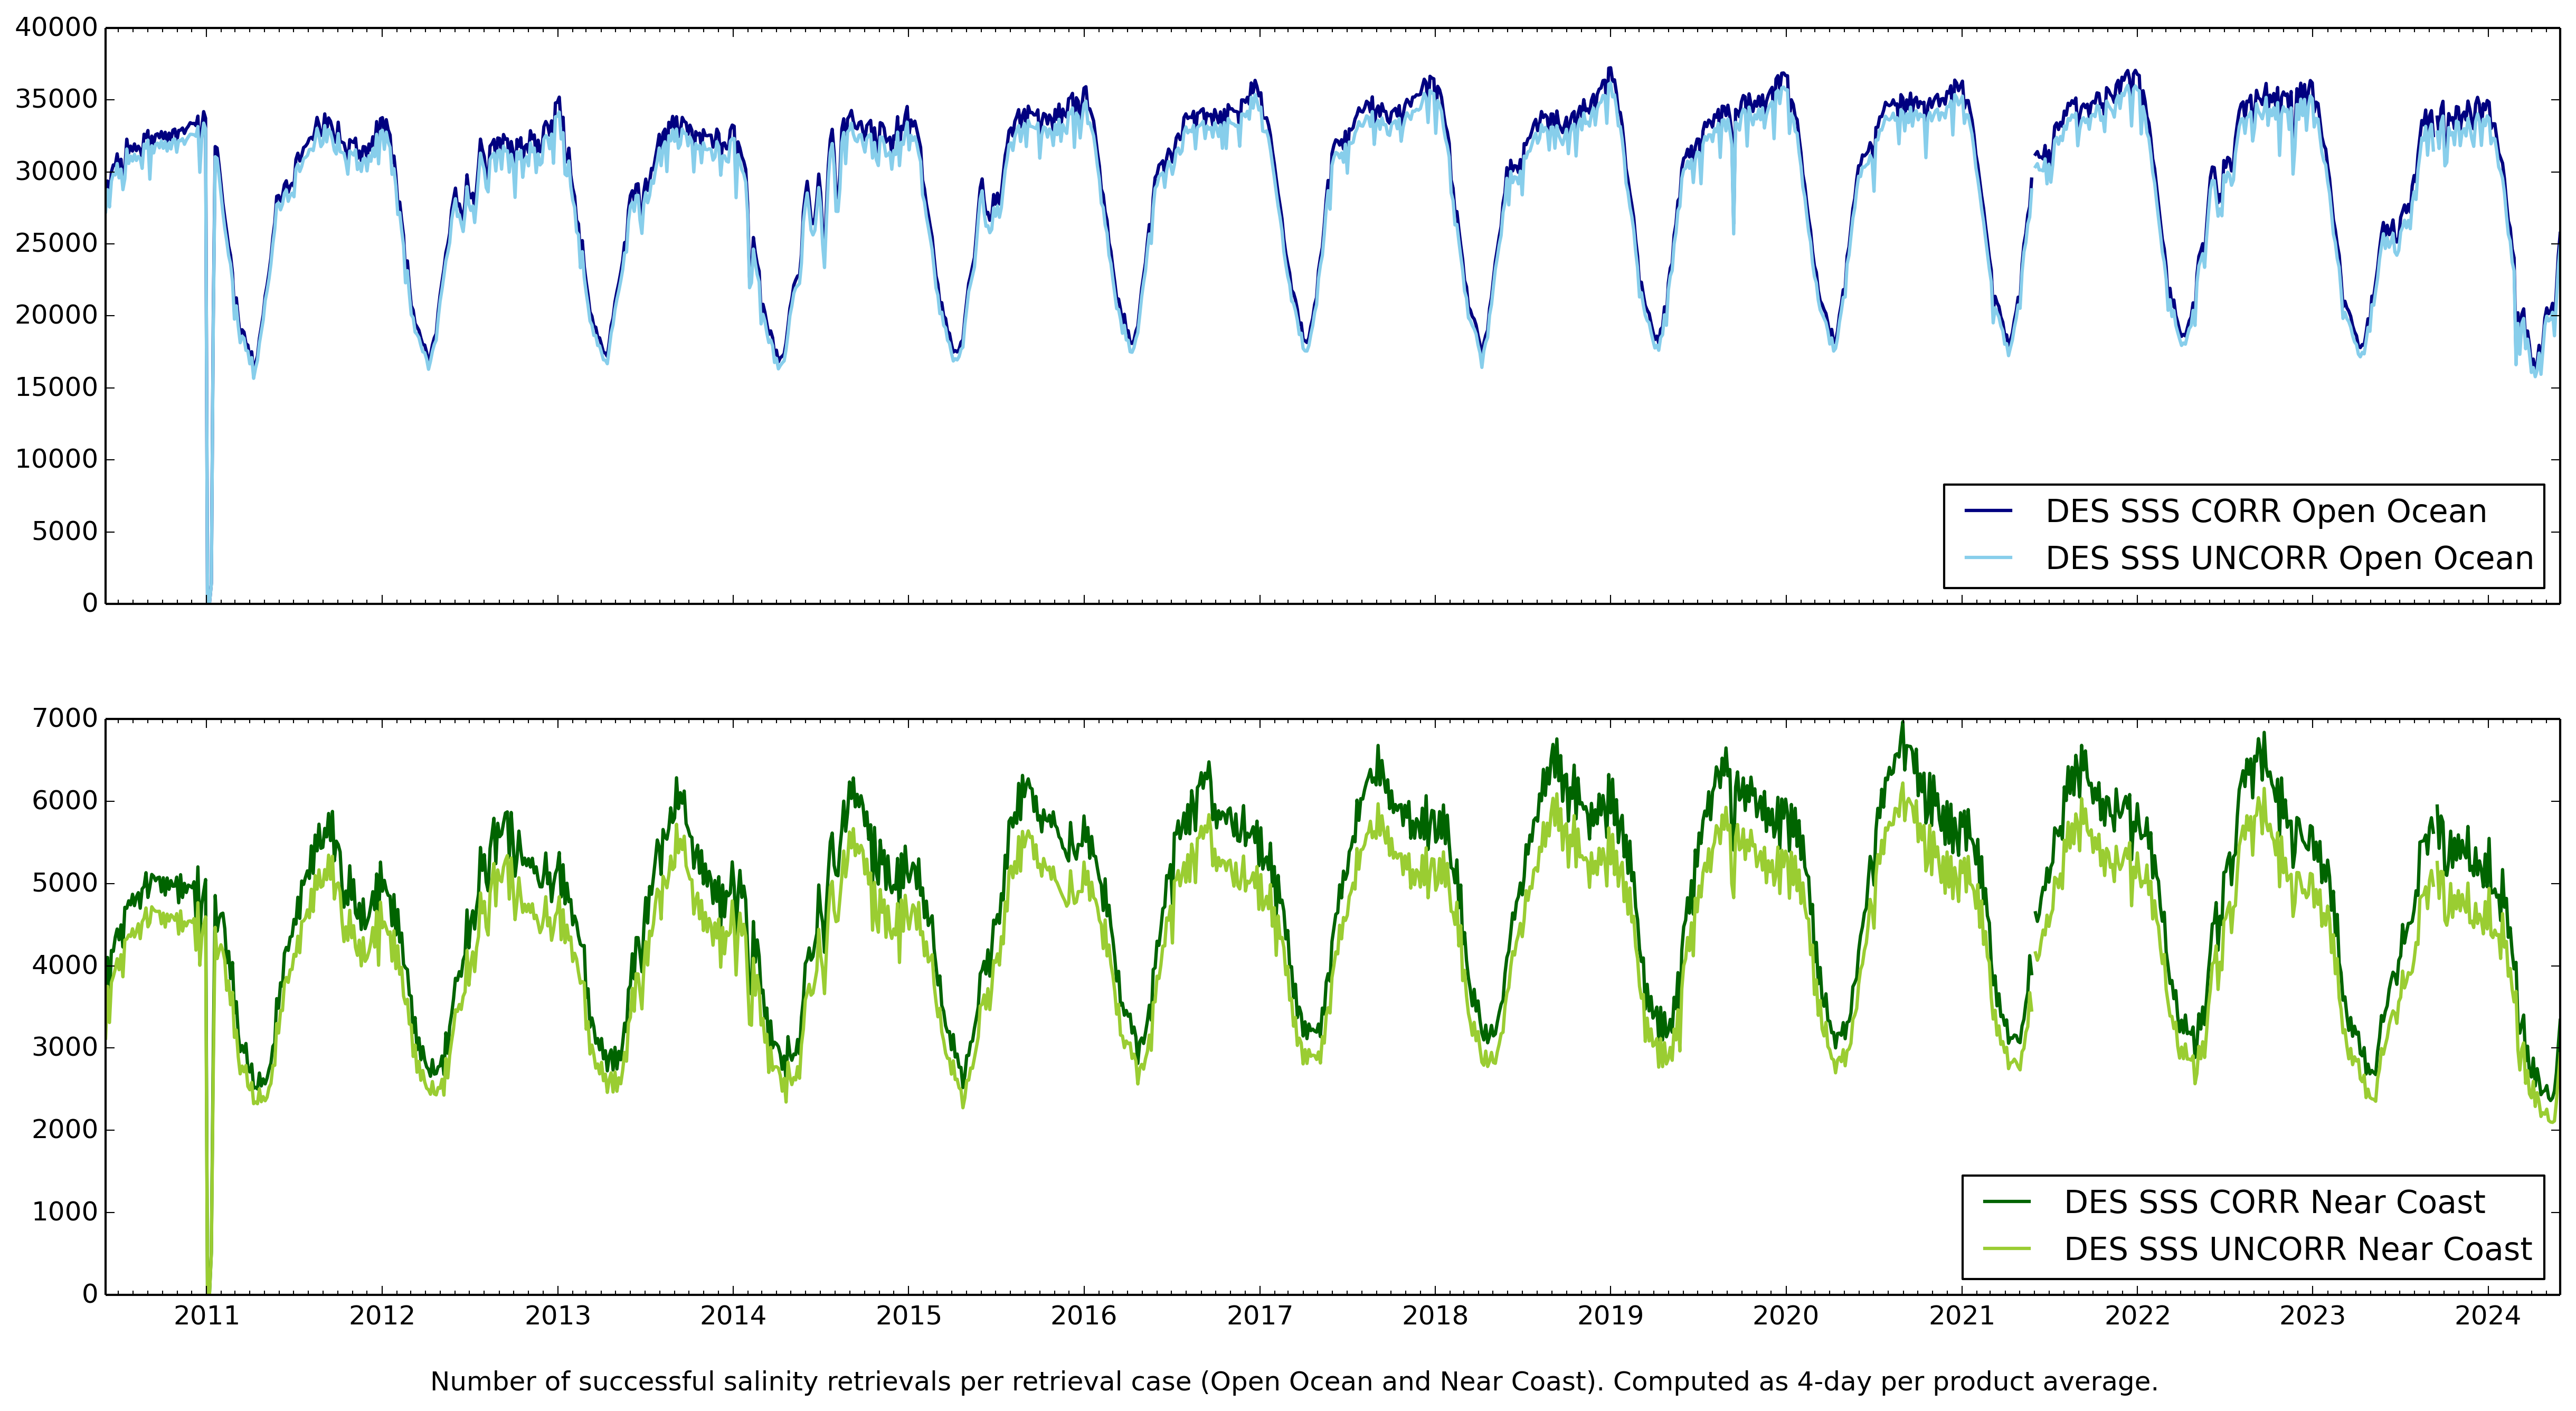
Download chart Evolution of the number of grid points with good quality sea surface salinity retrieved from SMOS measurements corrected for land-sea contamination and uncorrected since June 2010. Ascending orbit direction. Upper plot all grid points over ocean, bottom plot only for ocean grid points near the coast line (< 800 km).
Download chart Evolution of the number of grid points with good quality sea surface salinity retrieved from SMOS measurements corrected for land-sea contamination and uncorrected since June 2010. Descending orbit direction. Upper plot all grid points over ocean, bottom plot only for ocean grid points near the coast line (< 800 km).
Weekly maps of soil moisture retrieved from SMOS measurements for ascending and descending orbit directions are available in MP4 format. Lack of data in the maps is mainly due to contamination from Radio Frequency Interference (RFI) or specific surface condition like presence of snow, frozen soil, strong land topography.
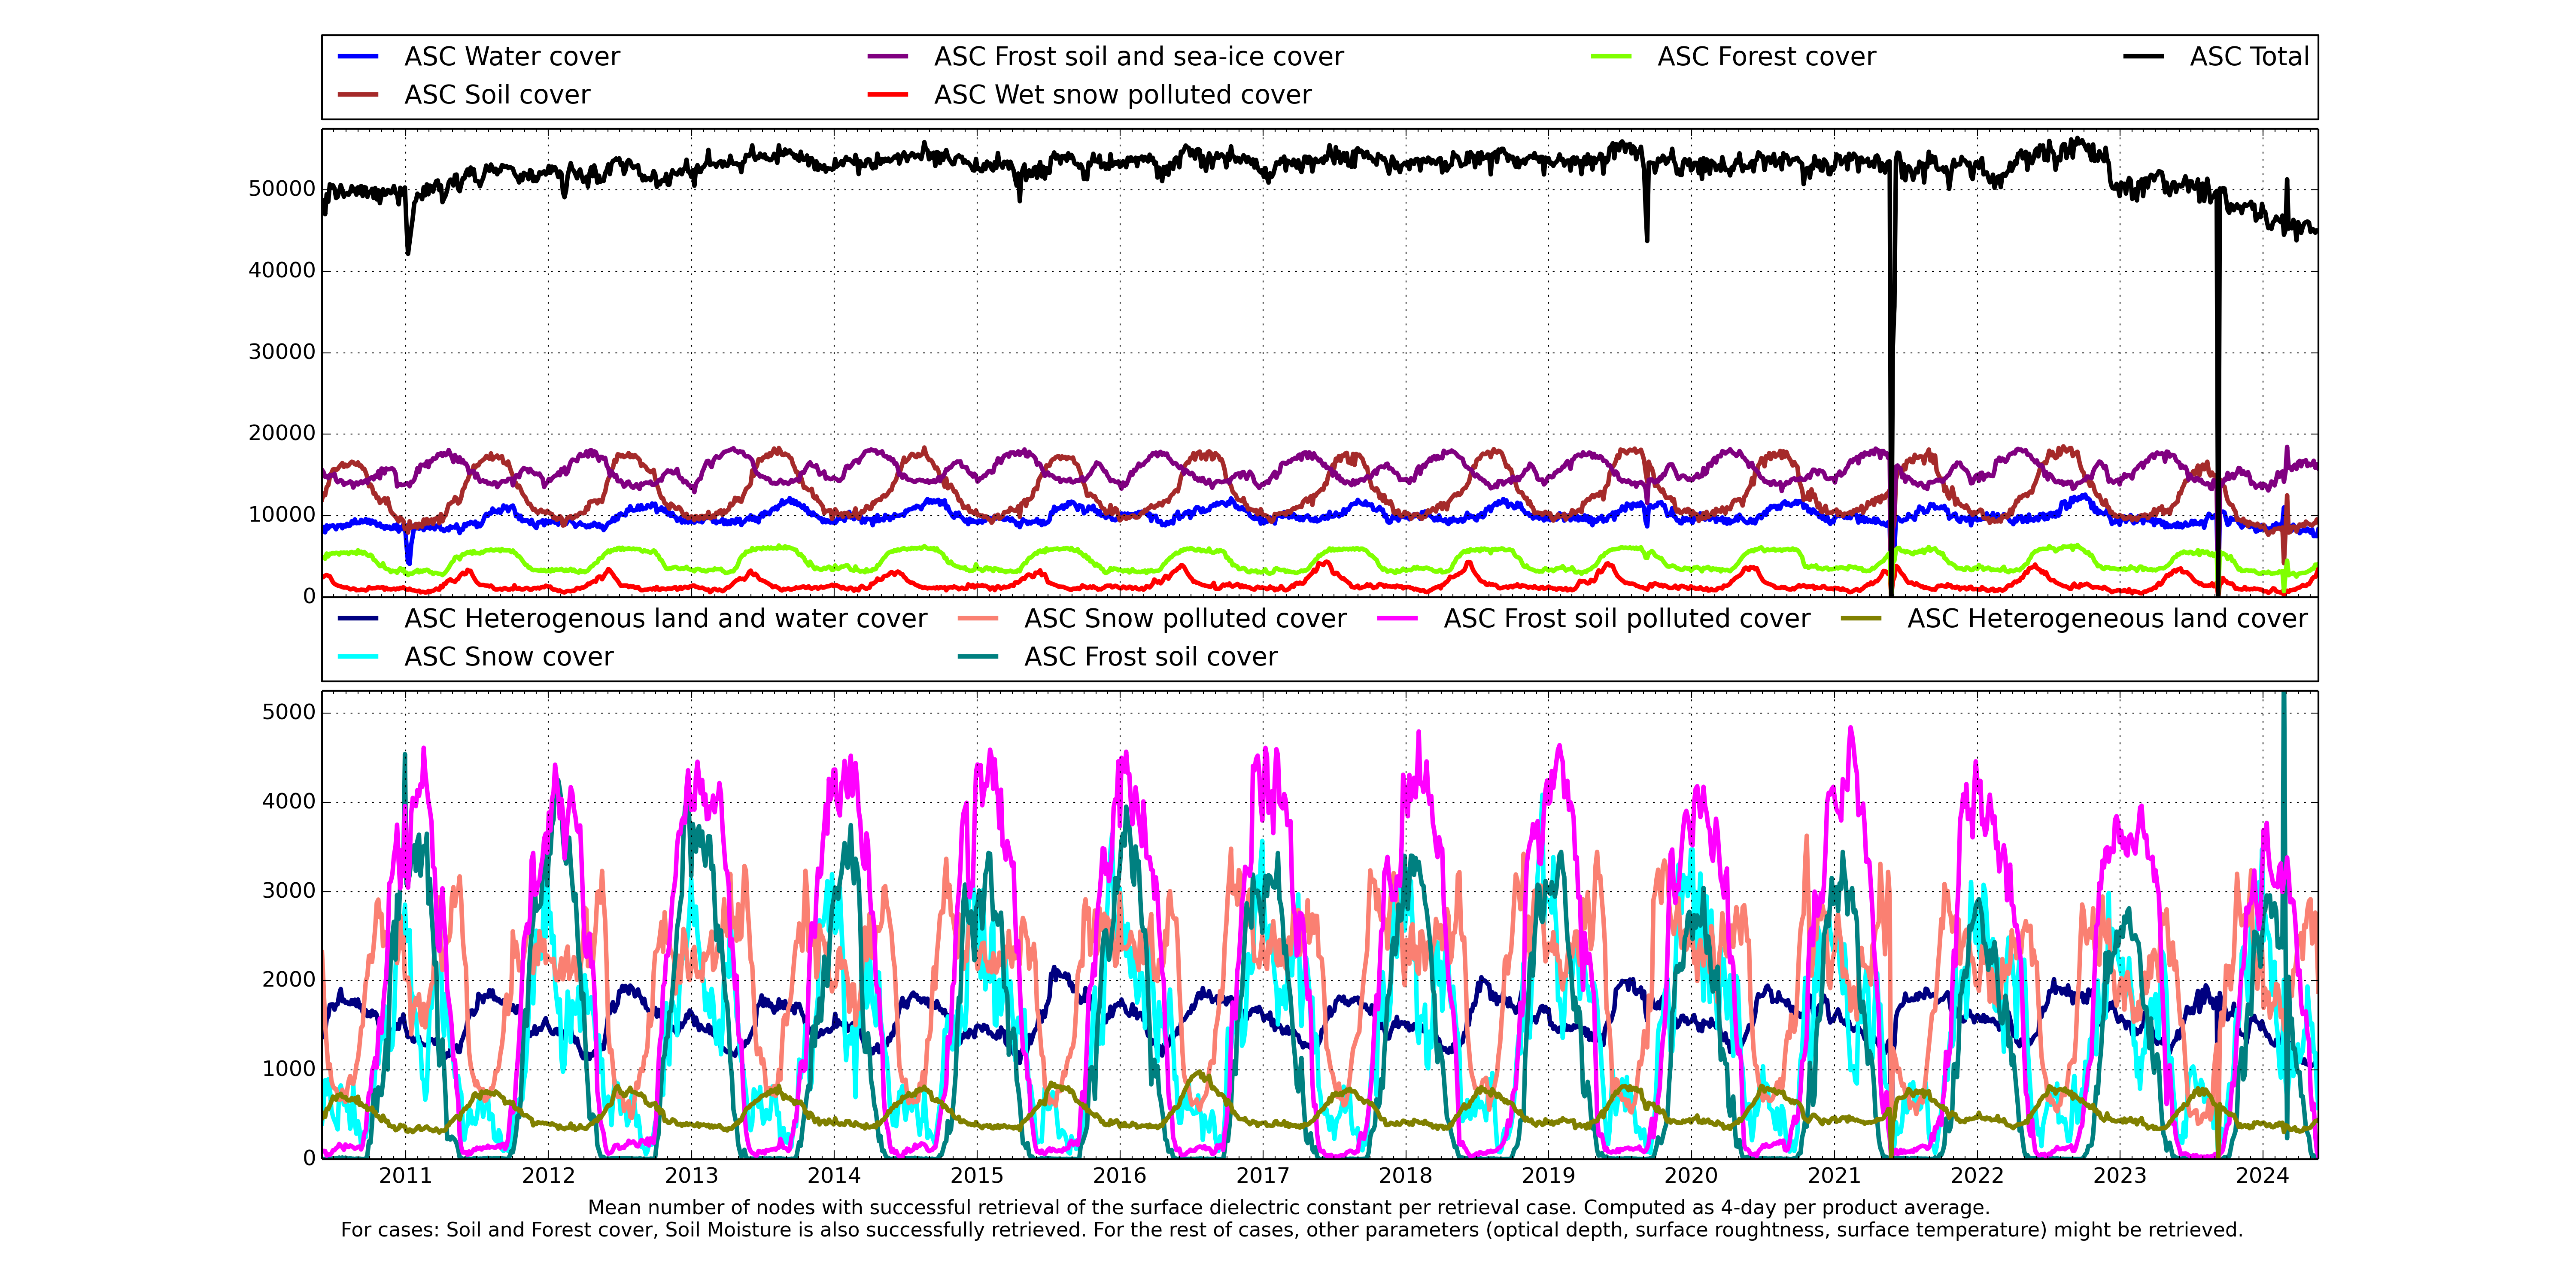
Download chart Evolution of number of successful retrieval of the surface dielectric constant per retrieval case for ascending orbit direction since June 2010. For cases: Soil and Forest cover soil moisture parameter is also successfully retrieved. For all others retrieval cases additional parameters like optical depth or surface roughness, surface temperature might be retrieved.
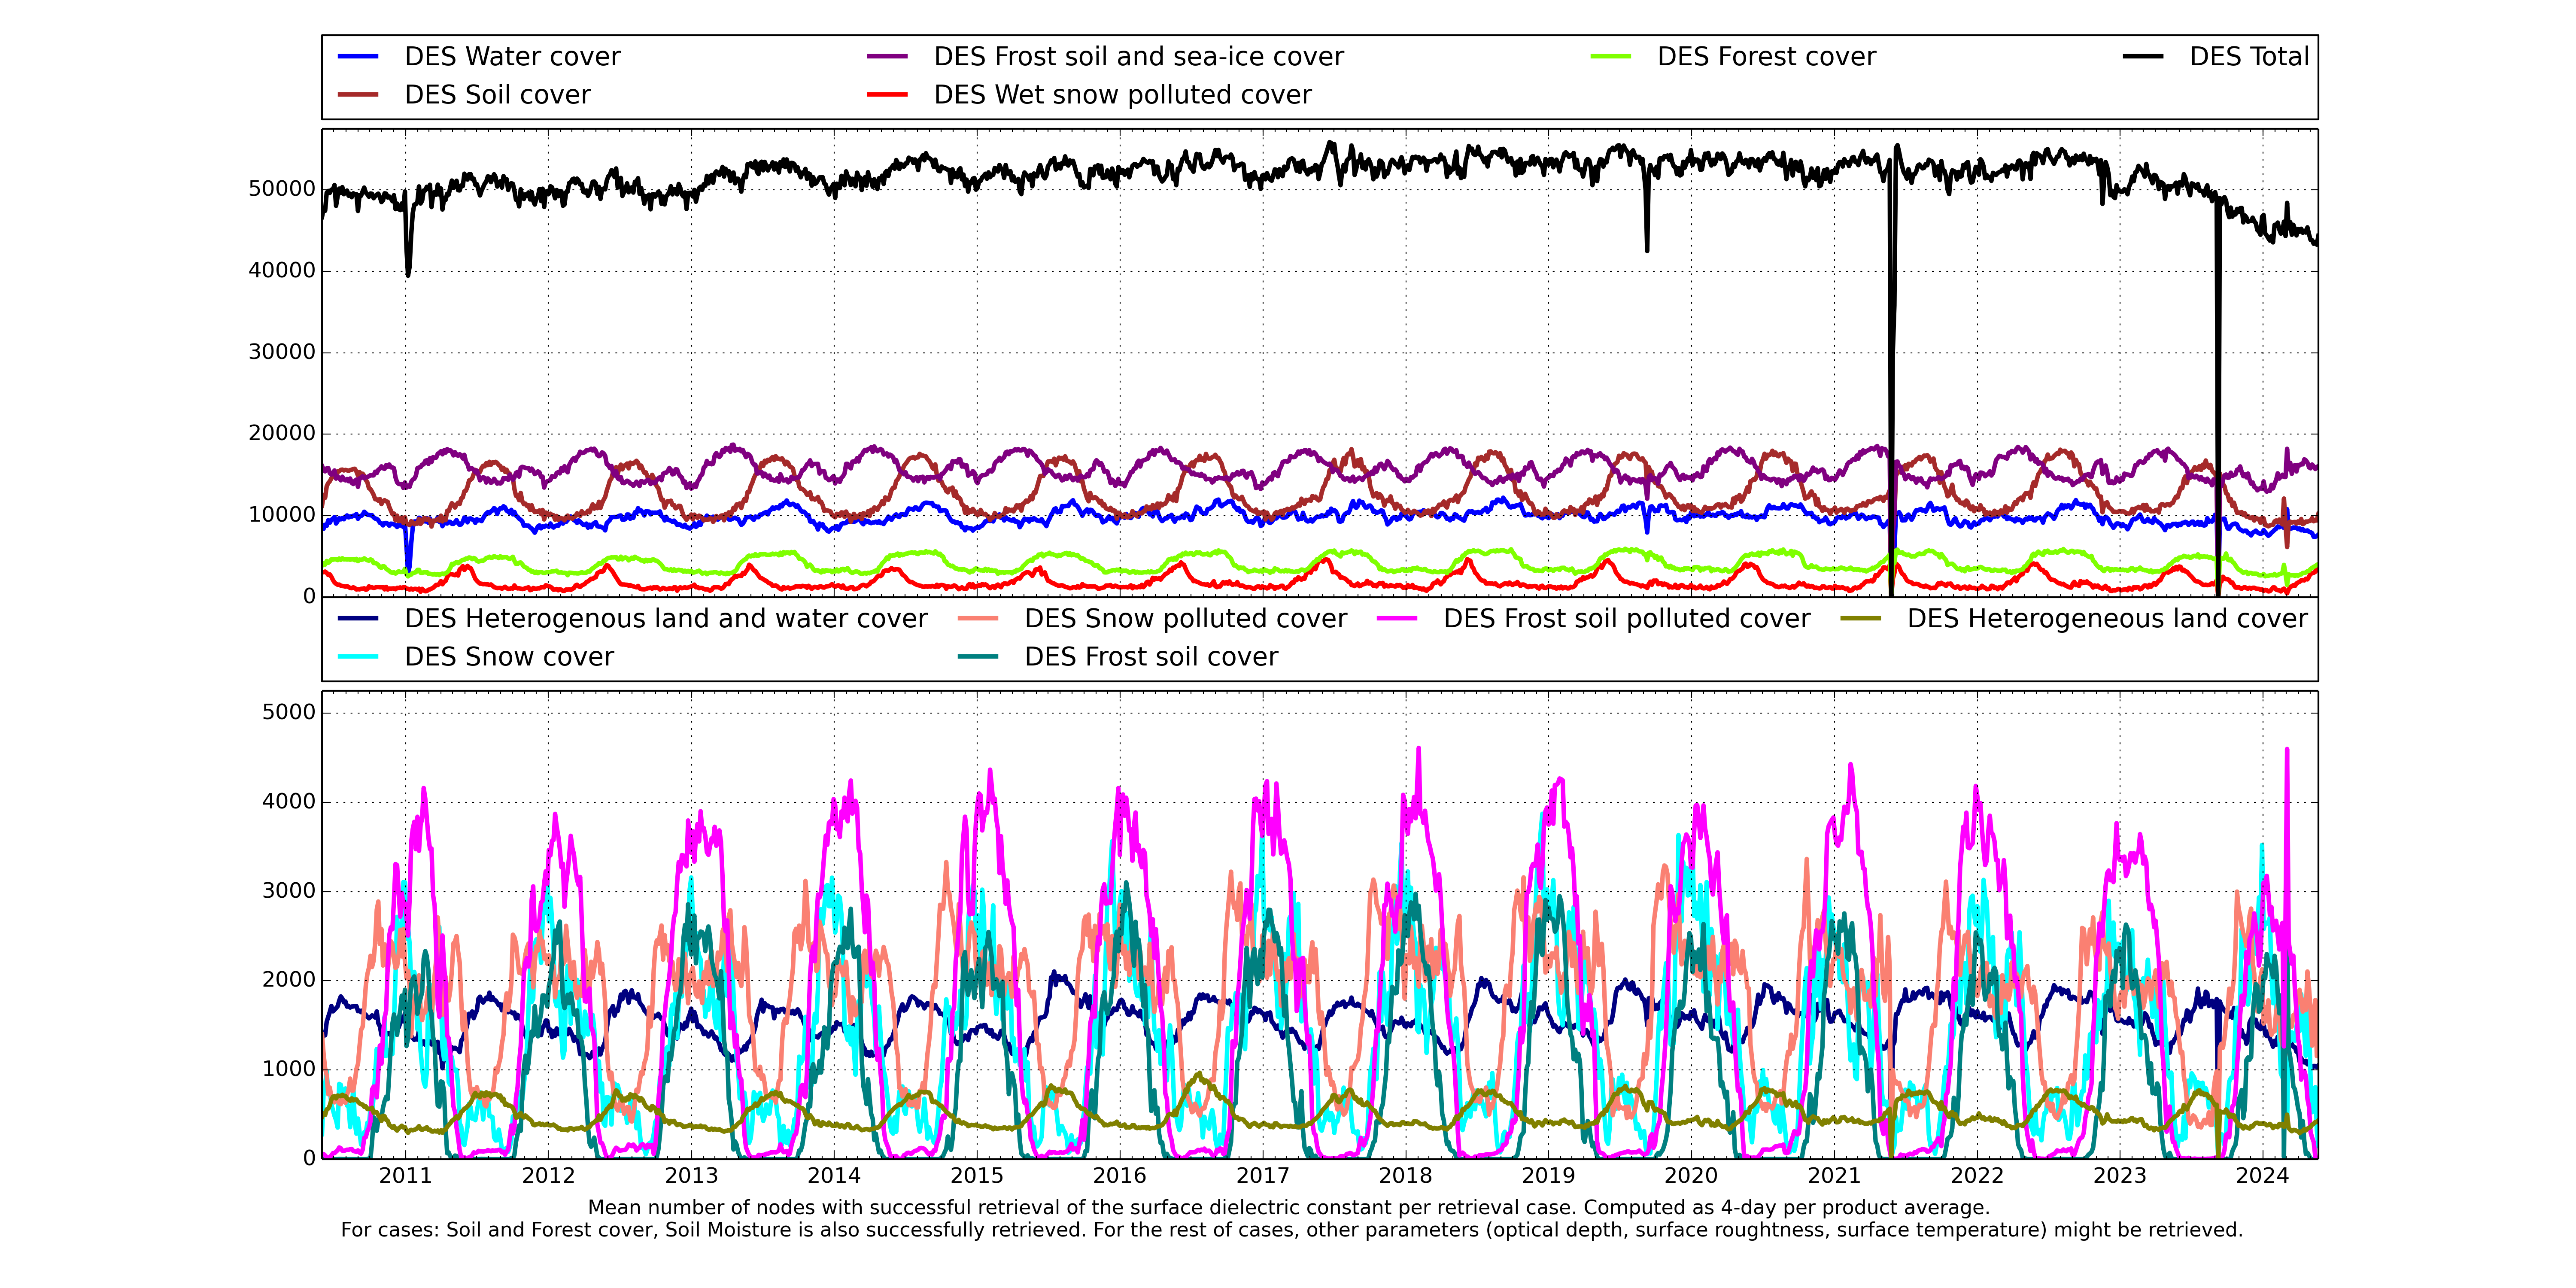
Download chart Evolution of number of successful retrieval of the surface dielectric constant per retrieval case for descending orbit direction since June 2010. For cases: Soil and Forest cover soil moisture parameter is also successfully retrieved. For all others retrieval cases additional parameters like optical depth or surface roughness, surface temperature might be retrieved.
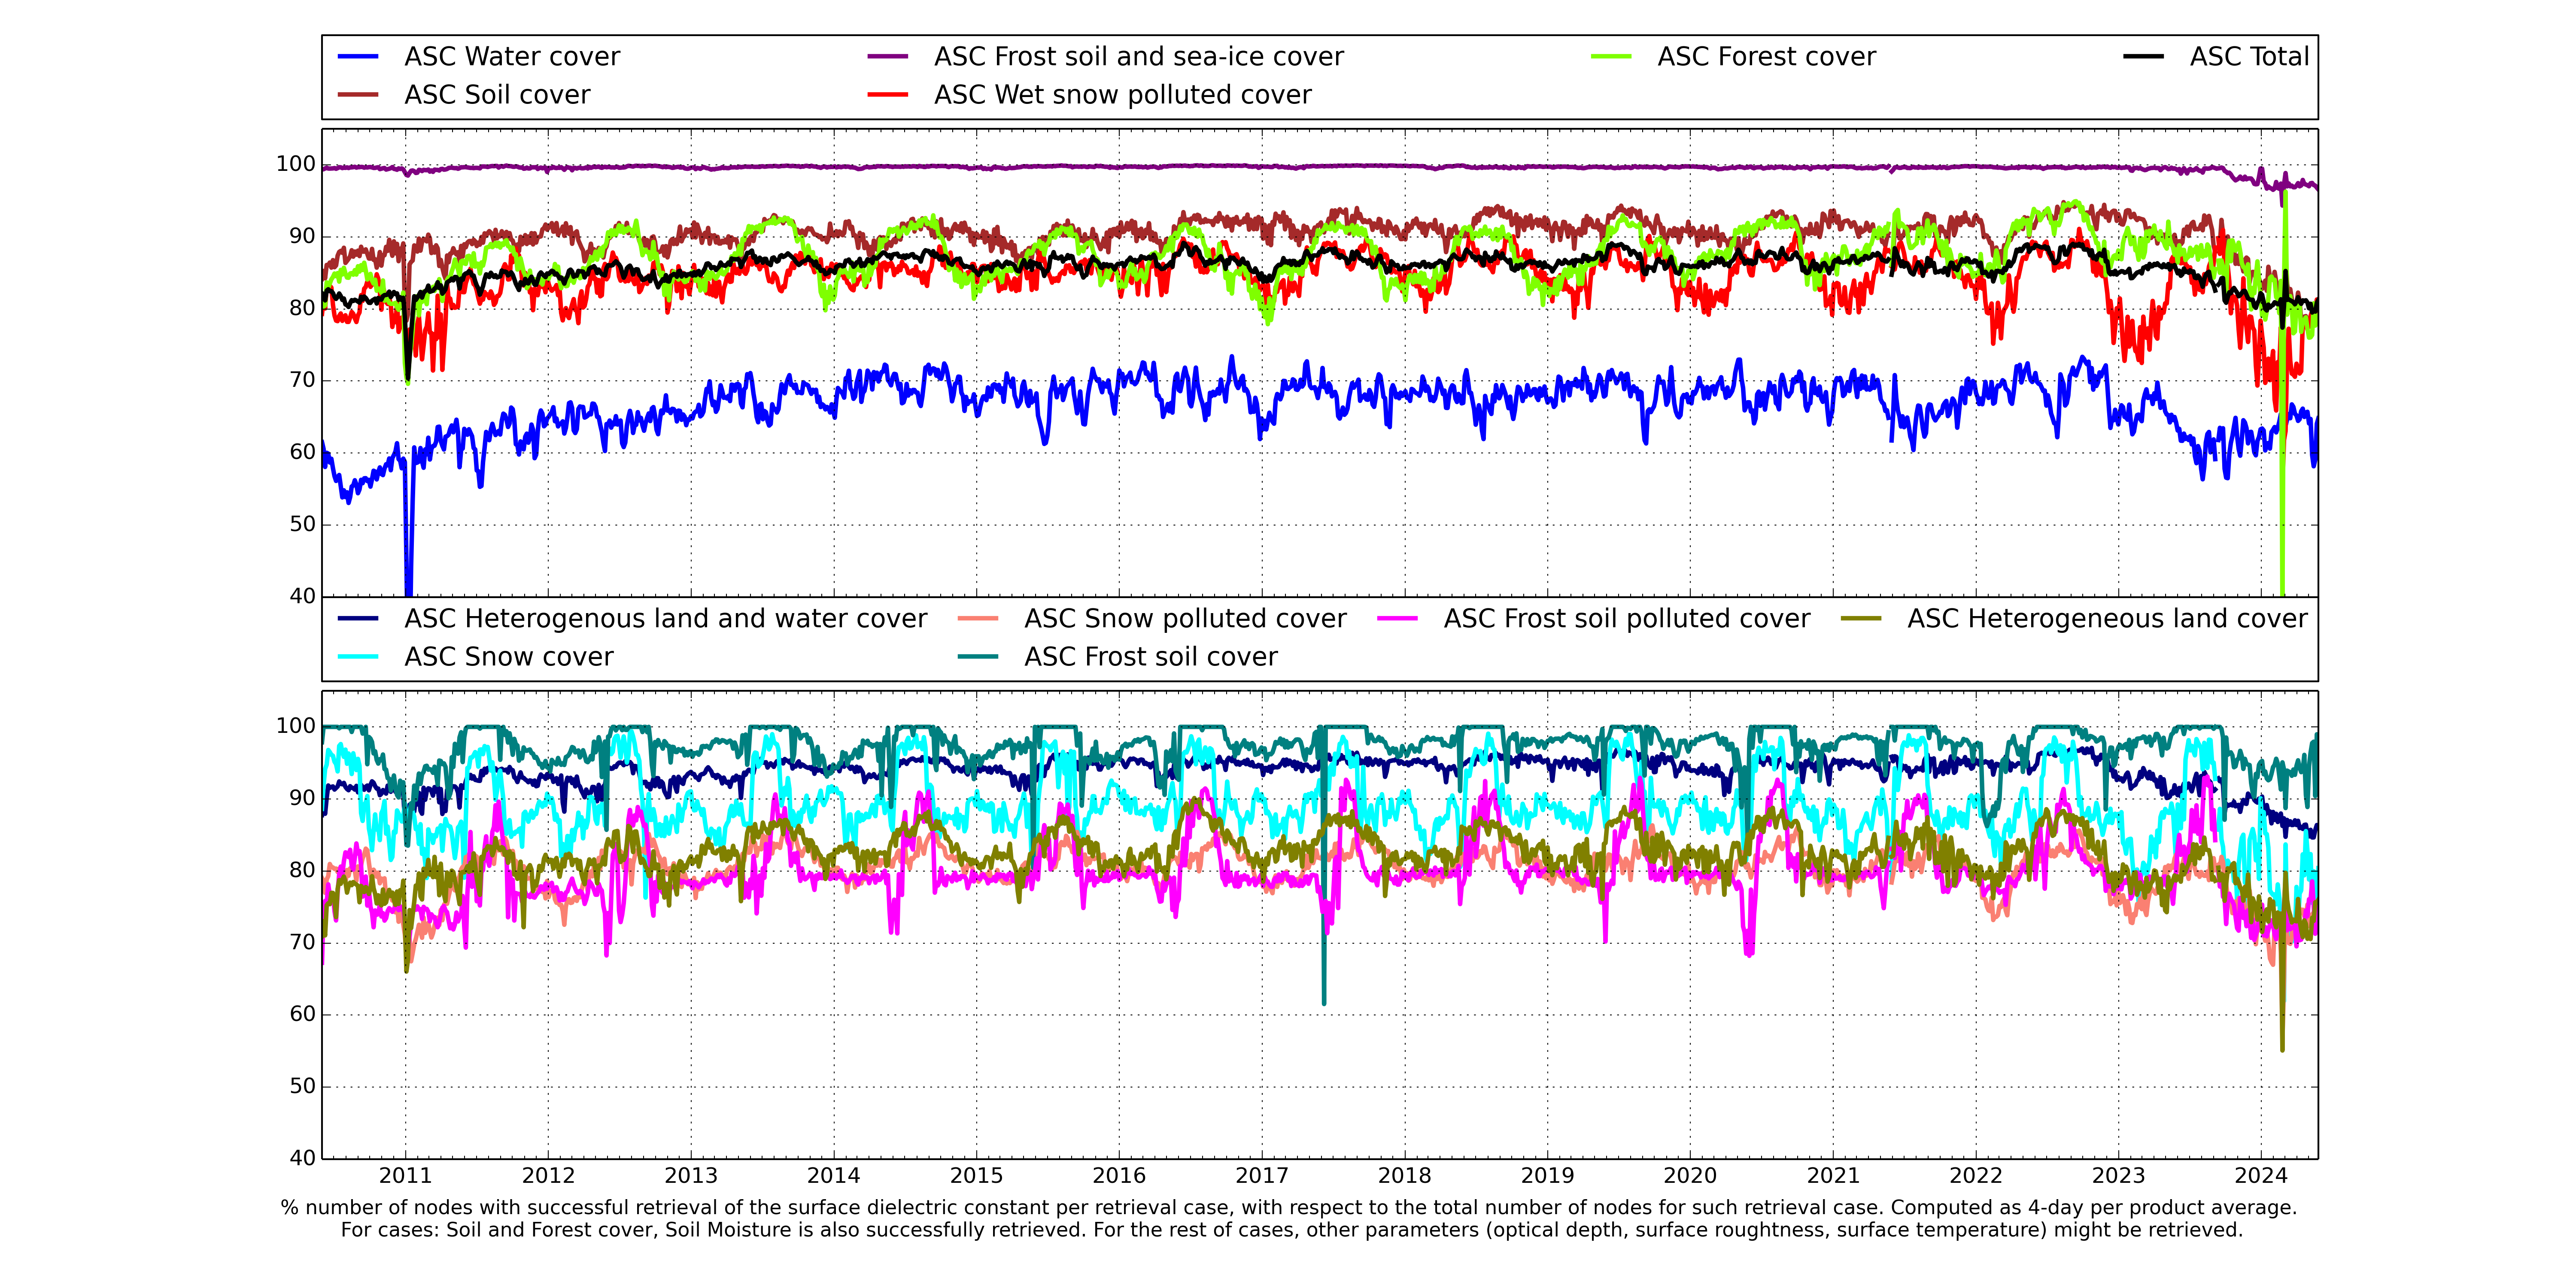
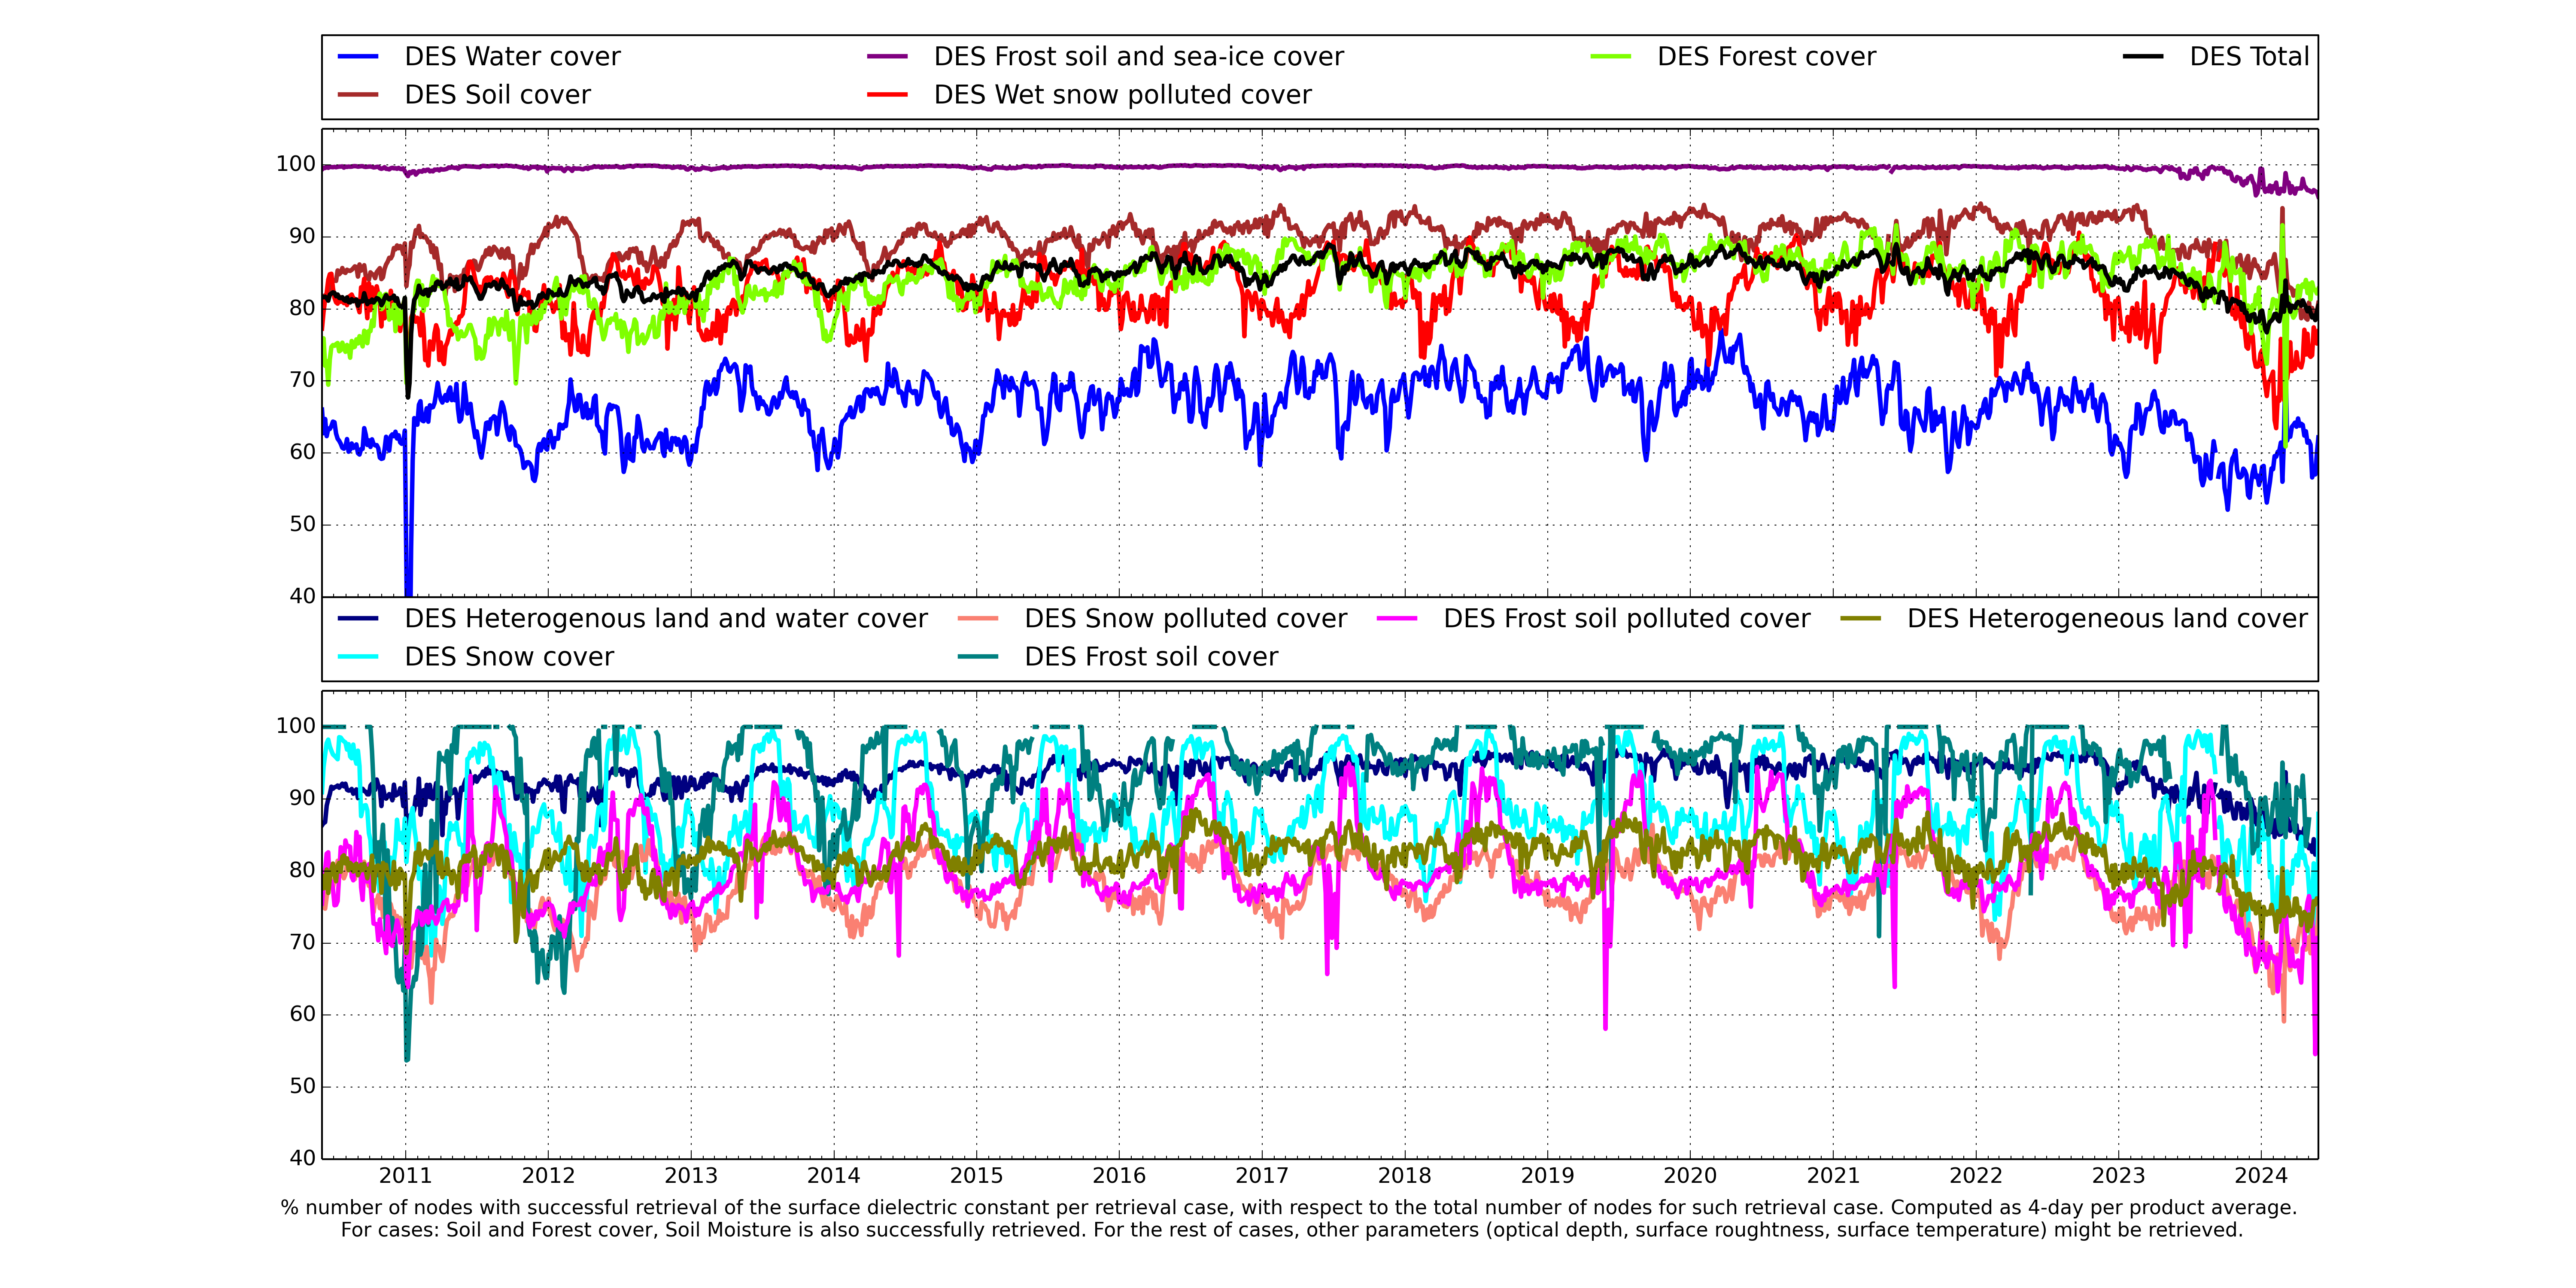
Download chart Evolution of percentage of successful retrieval of the surface dielectric constant per retrieval case for ascending orbit direction since June 2010. For cases: Soil and Forest cover soil moisture parameter is also successfully retrieved. For all others retrieval cases additional parameters like optical depth or surface roughness, surface temperature might be retrieved.
Download chart Evolution of percentage of successful retrieval of the surface dielectric constant per retrieval case for descending orbit direction since June 2010. For cases: Soil and Forest cover soil moisture parameter is also successfully retrieved. For all others retrieval cases additional parameters like optical depth or surface roughness, surface temperature might be retrieved.