- All Categories (21193)
- Data (29)
- News (76)
- Missions (9)
- Events (34)
- Tools (16)
- Activities (9)
- Campaigns (5)
- Documents (21015)
DATA
Discover and download the Earth observation data you need from the broad catalogue of missions the European Space Agency operate and support.
Data - Fast Registration with immediate access (Open)
TanSat AGCS and CAPI products
The Atmospheric Carbon-dioxide Grating Spectrometer (ACGS) instrument is pushbroom spectrometer operating in NIR and SWIR bands which allows the measuring of CO2 mole fraction. The available ACGS products have a temporal coverage between March 2017 and January 2020 (not all days included in the time frame): L1A DS: Sample Dark Calibration sample product L1A GL: Sample Glint Sample products L1A LS: Sample Lamp Calibration sample product L1A ND: Principal-Plane Nadir Sample product L1A ZS: Sample Z-Axis Solar Calibration Sample L1B CAL DS: Sample Dark Calibration product L1B CAL LS: Sample Lamp Calibration product L1B CAL ZS: Sample Z-Axis Solar Calibration product L1B SCI GL: Sample Glint Science product L1B SCI ND: Principal-Plane Nadir Science product. The Cloud Aerosol Polarization Imager (CAPI) is a pushbroom radiometer in VIS, NIR and SWIR bands for the observation of aerosols and clouds optical properties. The CAPI products are available in a time range from July 2019 and January 2020 (not all days included in the time frame): L1A ND: Principal-Plane Nadir product L1B ND 1000M: Principal-Plane Nadir products at 1000 m resolution (1375 nm, 1640 nm) L1B ND 250M: Principal-Plane Nadir products at 250 m resolution (380 nm, 670 nm, 870 nm) L1B ND GEOQK: Principal-Plane Nadir georeferenced at 250 m resolution L1B ND GEO1K: Principal-Plane Nadir georeferenced at 1000 m resolution L1B ND OBC: Principal-Plane Nadir on-board calibrator product L2 ND CLM: Principal-Plane Nadir cloud flag product.
Data - Fast Registration with immediate access (Open)
GOSAT-2 TANSO FTS-2 and CAI-2 full archive and new products
The TANSO-FTS-2 (Thermal And Near infrared Sensor for carbon Observation - Fourier Transform Spectrometer-2) instrument is an high-resolution 5-bands (NIR and TIR) spectrometer which allows the observation of reflective and emissive radiative energy from Earth's surface and the atmosphere for the measurement of atmospheric chemistry and greenhouse gases. The TANSO-CAI-2 (Thermal And Near infrared Sensor for carbon Observation - Cloud and Aerosol Imager-2) instrument is a push-broom radiometer in the spectral ranges of ultraviolet (UV), visible (VIS), Near Infrared (NIR) and SWIR (5 bands observe in the forward direction and 5 in backwards direction, with LOS tilted of 20 degrees) for the observation of aerosols and clouds optical properties and for monitoring of air pollution. The GOSAT-2 available products are: FTS-2 Level 1A products contain interferogram data observed by FTS-2, together with geometric information of observation points and various telemetry. In addition, data from an optical camera (CAM) near the observation time are also stored. Two different products for day and night observations. Common data contain common information for SWIR/TIR including CAM data; SWIR data contain information from SWIR band; TIR data contain information from TIR band FTS-2 level 1B products contain spectrum data, which are generated by Fourier transformation and other corrections to raw interferogram data in L1A. The sampled CAM data near the observation time are also stored. Two different products for day and night observations. Common data contain common information for SWIR/TIR including CAM data; SWIR products for SWIR spectrum data before and after sensitivity correction; TIR products for TIR spectrum data after sensitivity correction using blackbody and deep space calibration data and after correction of finite field of view FTS-2 NearRealTime products: FTS-2 data are first processed with predicted orbit file and made immediately available: NRT product does not include monitor camera image, best-estimate pointing-location, and target point classification but is available on the ESA server 5 hours after sensing. After a few days (usually 3 days), data is reprocessed with definitive orbit file and sent as consolidated product FTS-2 Level 2 products: Column-averaged Dry-air Mole Fraction" products store column-averaged dry-air mole fraction of atmospheric gases retrieved by using Band 1-3 spectral radiance data in TANSO-FTS-2 L1B; "Chlorophyll Fluorescence and Proxy Method (FTS-2_02_SWPR)" products store solar induced chlorophyll fluorescence data retrieved from Band 1 spectral radiance data in L1B Product as well as column-averaged dry-air mole fraction of atmospheric gases retrieved from Band 2 and 3 spectral radiance data in L1B Product. Both products are obtained by using the fill-physic maximum a posteriori (MAP) method and under the assumption of of clear-sky condition CAI-2 Level 1A products contain uncorrected image data of TANSO-CAI-2, which is stored as digital number together with telemetry of geometric information at observation point, orbit and attitude data, temperature, etc. One scene is defined as a satellite revolution data starting from ascending node to the next ascending node. Common data contain common information for both Forward looking and Backward looking; FWD products contain information for Forward looking bands, from 1 to 5; BWD products contain information for Backward looking bands, from 6 to 10 CAI-2 Level 1B products contain spectral radiance data per pixel converted from TANSO-CAI-2 L1A Products. Band-to-band registration of each forward- and backward- viewing band is applied; ortho-correction is performed to observation location data based on an earth ellipsoid model using digital elevation model data CAI-2 Level 2 products: Cloud Discrimination Products stores clear-sky confidence levels per pixel, which are calculated by combining the results of threshold tests for multiple features such as reflectance ratio and Normalized Difference Vegetation Index (NDVI), obtained from spectral radiance data in GOSAT-2 TANSO-CAI-2 L1B Product. This product also stores cloud status bit data, in which results of individual threshold tests and quality flags are summarized. The full ESA archive and newly acquired/systematically processed GOSAT2 FTS-2 and CAI-2 products are (ESA collection name versus JAXA product name): FTS-2 L1A Common day (FTS-2_1A_COMMON_DAY) FTS-2 L1A Common night (FTS-2_1A_COMMON_NIGHT) FTS-2 L1A SWIR day (FTS-2_1A_SWIR_DAY) FTS-2 L1A TIR day (FTS-2_1A_TIR_DAY) FTS-2 L1A TIR night (FTS-2_1A_TIR_NIGHT) FTS-2 L1B Common day (FTS-2_1B_COMMON_DAY) FTS-2 L1B Common night (FTS-2_1B_COMMON_NIGHT) FTS-2 L1B SWIR day (FTS-2_1B_SWIR_DAY) FTS-2 L1B TIR day (FTS-2_1B_TIR_DAY) FTS-2 L1B TIR night (FTS-2_1B_TIR_NIGHT) FTS-2 L2 Column-averaged Dry-air Mole Fraction (FTS-2_0) FTS-2 L2 Chlorophyll Fluorescence and Proxy Method (FTS-2_02_SWPR) CAI-2 L1A Common (CAI-2_1A_COMMON) CAI-2 L1A Forward viewing (CAI-2_1A_FWD) CAI-2 L1A Backward viewing (CAI-2_1A_BWD) CAI-2 L1B (CAI-2_1B).
Data - Announcement of Opportunity (Restrained)

Announcement of Opportunity for G-POD
ESA is offering all scientists the possibility to perform bulk processing and/or validation of their own algorithms exploiting the large ESA Earth-observation archive.
Data - EO Sign In Authentication (Open)
SMOS Tropical Cyclone Wind Radii Fixes
The SMOS WRF product is available in Near Real Time to support tropical cyclones (TC) forecasts. It is generated within 4 to 6 hours from sensing from the SMOS L2 swath wind speed products, in the so-called "Fix (F-deck)" format compatible with the US Navy's ATCF (Automated Tropical Cyclone Forecasting) System. The SMOS WRF "fixes" to the best-track forecasts contain: the SMOS 10-min maximum-sustained winds (in knots) and wind radii (in nautical miles) for the 34 kt (17 m/s), 50 kt (25 m/s) and 64 kt (33 m/s) winds per geographical storm quadrants, and for each SMOS pass intercepting a TC in all the active ocean basins.
Data - EO Sign In Authentication (Open)
SMOS - CryoSat L4 Sea Ice Thickness
The SMOS-CryoSat merged Sea Ice Thickness Level 4 product, in NetCDF format, is based on estimates from both the MIRAS and the SIRAL instruments with a significant reduction in the relative uncertainty for the thickness of the thin ice. A weekly averaged preliminary product is generated every day by the Alfred Wegener Institut (AWI) by merging the weekly CryoSat Sea Ice Thickness product and the daily SMOS Sea Ice Thickness retrieval. A final product is provided with a latency of about 3-4 weeks using a different global sea ice concentration product and a reprocessed CryoSat product. All grids are projected onto the 25 km EASE2 Grid based on a polar aspect spherical Lambert azimuthal equal-area projection. The grid dimension is 5400 x 5400 km, equal to a 432 x 432 grid centered on the geographic pole. Coverage is limited to the October-April (winter) period for the Northern Hemisphere, due to the melting season, from year 2010 onwards.
Data - EO Sign In Authentication (Open)
SMOS NRT L2 Swath Wind Speed
SMOS retrieved surface wind speed gridded maps (with a spatial sampling of 1/4 x 1/4 degrees) are available in NetCDF format. Each product contains parts of ascending and descending orbits and it is generated by Ifremer, starting from the SMOS L1B data products, in Near Real Time i.e. within 4 to 6 hours from sensing time. Before using this dataset, please check the read-me-first note available in the Resources section below.
Data - EO Sign In Authentication (Open)
SMOS Soil Freeze and Thaw State
The SMOS Level 3 Freeze and Thaw (F/T) product provides daily information on the soil state in the Northern Hemisphere based on SMOS observations and associated ancillary data. Daily products, in NetCDF format, are generated by the Finnish Meteorological Institute (FMI) and are available from 2010 onwards. The processing algorithm makes use of gridded Level 3 brightness temperatures provided by CATDS. The data is provided in the Equal-Area Scalable Earth Grid (EASE2-Grid), at 25 km x 25 km resolution. For an optimal exploitation of this dataset, please refer to the Resources section below to access Product Specifications, read-me-first notes, etc.
Data - EO Sign In Authentication (Open)
SMOS L3 Daily Wind Speed
SMOS L3WS products are daily composite maps of the collected SMOS L2 swath wind products for a specific day, provided with the same grid than the Level 2 wind data (SMOS L2WS NRT) but separated into ascending and descending passes. This product is available the day after sensing from Ifremer, in NetCDF format. Before using this dataset, please check the read-me-first note available in the Resources section below.
Data - Campaigns (Open)
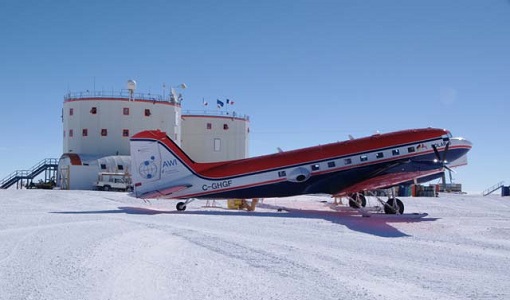
DOMECair (SMOS)
The purpose of this campaign was to assess the merits of the East Antarctic Plateau around Dome C with the Concordia station as a candidate for an Earthly calibration site. It was an airborne campaign in Antarctica supporting SMOS calibration.
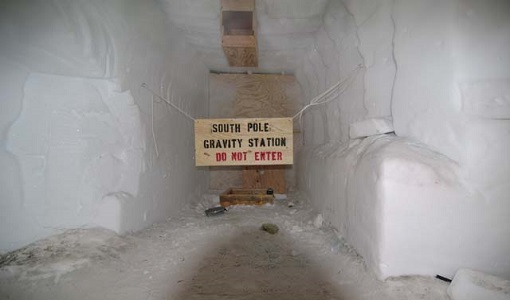
Data - Campaigns (Open)
DOMECair (GOCE)
The airborne survey DOMECair 2013 and its instrumentation was designed to obtain calibration and validation data for two different satellite missions of ESA’s Earth Explorer mission, for satellites SMOS and GOCE.
Data - EO Sign In Authentication (Open)
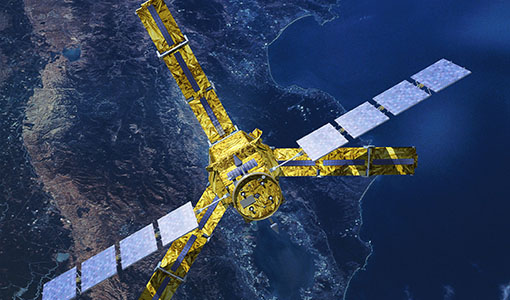
SMOS L1 and L2 Science data
SMOS Level 1 data products are designed for scientific and operational users who need to work with calibrated MIRAS instrument measurements, while SMOS Level 2 data products are designed for scientific and operational users who need to work with geo-located soil moisture and sea surface salinity estimation as retrieved from the L1 dataset. Products from the SMOS Data Processing Ground Segment (DPGS) located at the European Space Astronomy Centre (ESAC), belonging to the latest processing baseline, have File Class OPER. Reprocessed SMOS data is tagged as REPR. The Level 1A product comprises all calibrated visibilities between receivers (i.e. the interferometric measurements from the sensor including the redundant visibilities), combined per integration time of 1.2s (snapshot). The snapshots are consolidated in a pole-to-pole product file (50 minutes of sensing time) with a maximum size of about 215MB per half orbit (29 half orbits per day). Access to this products is restricted to SMOS Cal/Val users. The Level 1B product comprises the result of the image reconstruction algorithm applied to the L1A data. As a result, the reconstructed image at L1B is simply the difference between the sensed scene by the sensor and the artificial scene. The brightness temperature image is available in its Fourier component in the antenna polarisation reference frame top of the atmosphere. Images are combined per integration time of 1.2 seconds (snapshot). The removal of foreign sources (Galactic, Direct Sun, Moon) is also included in the reconstruction. Snapshot consolidation is as per L1A, with a maximum product size of about 115MB per half orbit. ESA provides the Artificial Scene Library (ASL) to add the artificial scene in L1B for any user that wants to start from L1B products and derive the sensed scene. The Level 1C product contains multi-angular brightness temperatures in antenna frame (X-pol, Y-pol, T3 and T4) at the top of the atmosphere, geo-located in an equal-area grid system (ISEA 4H9 - Icosahedral Snyder Equal Area projection). The pixels are consolidated in a pole-to-pole product file (50 minutes of sensing time), with a maximum size of about 350MB per half orbit (29 half orbits per day). Spatial resolution is in the range of 30-50 km. For each L1C product there is also a corresponding Browse product containing brightness temperatures interpolated for an incidence angle of 42.5°. Two L1C products are available: Land for soil moisture retrieval and Sea for sea surface salinity retrieval. The Level 2 Soil Moisture (SM) product comprises soil moisture measurements geo-located in an equal-area grid system ISEA 4H9. The product contains not only the retrieved soil moisture, but also a series of ancillary data derived from the processing (nadir optical thickness, surface temperature, roughness parameter, dielectric constant and brightness temperature retrieved at top of atmosphere and on the surface) with the corresponding uncertainties. The pixels are consolidated in a pole-to-pole product file (50 minutes of sensing time), with a maximum size of about 7MB (25MB uncompressed data) per half orbit (29 half orbits per day). This product is available in both Earth Explorer and NetCDF formats. The Level 2 Ocean Salinity (OS) product comprises sea surface salinity measurements geo-located in an equal-area grid system ISEA 4H9. The product contains one single swath-based sea surface salinity retrieved with and without Land-Sea contamination correction, SSS anomaly based on WOA-2009 referred to Land-Sea corrected sea surface salinity, brightness temperature at the top of the atmosphere and at the sea surface with their corresponding uncertainties. The pixels are consolidated in a pole-to-pole product file (50 minutes of sensing time), with a maximum size of about 10MB (25MB uncompressed data) per half orbit (29 half orbits per day). This product is available in both Earth Explorer and NetCDF formats. For an optimal exploitation of the SMOS L1 and L2 datasets, please refer to the Resources section below in order to access Product Specifications, read-me-first notes, etc.
Data - EO Sign In Authentication (Open)
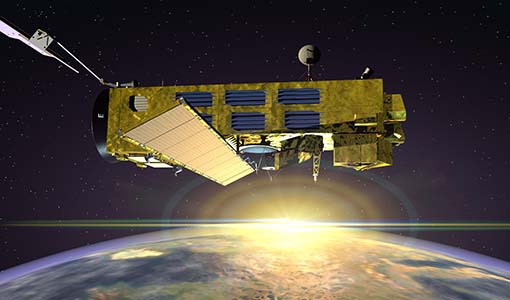
SMOS NRT Data Products
The SMOS Near Real Time products include Level 1 geo-located brightness temperature and Level 2 geo-located soil moisture estimation. The SMOS NRT L1 Light BUFR product contains brightness temperature geo-located on a reduced Gaussian grid (T511/N256), only for "land" pixels but keeping the full angular resolution. The pixels are consolidated in a full orbit dump segment (i.e. around 100 minutes of sensing time) with a maximum size of about 30MB per orbit. Spatial resolution is in the range of 30-50 km. This product is distributed in BUFR format. The SMOS NRT L2 Soil Moisture Neural Network (NN) product provides NRT soil moisture data based on the statistical coefficients estimated by a neural network. It is provided in the SMOS DGG grid and only at the satellite track. It also provides an estimation of the uncertainty of the estimated soil moisture product, and the probability that a soil moisture value is contaminated by Radio Frequency Interference (RFI). This product is distributed in NetCDF format. The L2 data product is also distributed via the EUMETCast Europe Service (DVB), upon registration on the EUMETSAT Earth Observation Portal. The Ku-band DVB reception station must be situated within the service coverage in Europe. SMOS NRT data is also regularly delivered to the UK Met-Office, then made available to operational agencies and research and development institutes via the WMO GTS Network. For an optimal exploitation of the SMOS NRT products please consult the read-me-first notes available in the Resources section below.
Data - External Data (Restrained)

SciSat-1: ACE-FTS and MAESTRO
SCISAT-1 data aim at monitoring and analysing the chemical processes that control the distribution of ozone in the upper troposphere and stratosphere. It provides acquisitions from the two instruments MAESTRO and ACE-FTS. MAESTRO: Measurement of Aerosol Extinction in the Stratosphere and Troposphere Retrieved by Occultation. Dual-channel optical spectrometer in the spectral region of 285-1030 nm. The objective is to measure ozone, nitrogen dioxide and aerosol/cloud extinction (solar occultation measurements of atmospheric attenuation during satellite sunrise and sunset with the primary objective of assessing the stratospheric ozone budget). Solar occultation spectra are being used for retrieving vertical profiles of temperature and pressure, aerosols, and trace gases (O3, NO2, H2O, OClO, and BrO) involved in middle atmosphere ozone distribution. The use of two overlapping spectrometers (280 - 550 nm, 500 - 1030 nm) improves the stray-light performance. The spectral resolution is about 1-2 nm. ACE-FTS: Fourier Transform Spectrometer. The objective is to measure the vertical distribution of atmospheric trace gases, in particular of the regional polar O3 budget, as well as pressure and temperature (derived from CO2 lines). The instrument is an adapted version of the classical sweeping Michelson interferometer, using an optimised optical layout. The ACE-FTS measurements are recorded every 2 s. This corresponds to a measurement spacing of 2-6 km which decreases at lower altitudes due to refraction. The typical altitude spacing changes with the orbital beta angle. For historical reasons, the retrieved results are interpolated onto a 1 km "grid" using a piecewise quadratic method. For ACE-FTS version 1.0, the results were reported only on the interpolated grid (every 1 km from 0.5 to 149.5 km). For versions 2.2, both the "retrieval" grid and the "1 km" grid profiles are available. SCISAT-1 collection provides ACE-FTS and MAESTRO Level 2 Data. As of today, ACE-FTS products are available in version 4.1, while MAESTRO products are available in version 3.13.
Data - Fast Registration with immediate access (Open)
Envisat SCIAMACHY Total column densities and stratospheric profiles [SCI_OL__2P]
The data product provides global column distributions and stratospheric profiles of various trace gases. Total column densities of O3, NO2, OClO, H2O, SO2, BrO, CO, HCHO, CHOCHO and CH4 are retrieved from Nadir measurements. Additional cloud parameters (fractional cloud coverage, cloud-top height, cloud optical thickness) and an aerosol absorption indicator are enclosed. Stratospheric profiles of O3, NO2, and BrO are derived from limb measurements and with flagging information for cloud-types. Tropospheric NO2 columns are retrieved combining limb and nadir measurements. The latest Level 2 dataset is Version 6.01.
Data - Fast Registration with immediate access (Open)
Envisat SCIAMACHY Geo-located atmospheric spectra [SCI_NL__1P]
This data product covers geo-located, radiometrically and spectrally calibrated limb and nadir radiance spectra for Nadir, Limb, and Occultation measurements with additional monitoring and calibration measurements. The Level 1b product is the lowest level of SCIAMACHY data delivered to the users. The instrument Instantaneous Field of View (IFoV) is approximately 0.045 deg (scan direction) x 1.8 deg (flight direction). This corresponds to a ground pixel size of 25 km x 0.6 km at the sub-satellite point (nadir) and of 103 km x 2.6 km at the Earth's horizon (limb). Nadir measurements have a maximum swath width of 960 km (in scan direction) and a typical footprint of 30 km (along track) x 60 km (across track). Limb measurements have a tangent height range spanning from 0 to 100 km with 3 km vertical resolution. Azimuth scans are performed for constant elevation angle, typically 34 elevation steps per limb scan. Maximum azimuth range is +/- 44 deg relative to S/C velocity (Note that the azimuth range is adjusted to observe the same atmospheric volume as for nadir measurements within five minutes). The radiometric resolution is 16 bits, with a spectral resolution of 0.24 nm to 1.5 nm, depending on the spectral range. The Sun normalized radiometric accuracy is 2 to 3% in unpolarized light, and 3 to 4% in polarized light. The relative radiometric accuracy is less than 1% and the spectral accuracy spans form 0.005 nm to 0.035 nm. Individual measurements from dedicated monitoring states include: Sun over diffuser Subsolar calibration Spectral lamp measurements White light source measurements Elevation mirror monitoring (Sun/Moon) ADC calibration Level 1b products are corrected for degradation applying a scan mirror model and m-factors. The latest Level 1b dataset is version 8.0X.
Data - EO Sign In Authentication (Open)
SMOS Auxiliary Data
The Level 2 ECMWF SMOS Auxiliary data product, openly available to all users, contains ECMWF data on the ISEA 4-9 DGG corresponding to SMOS half-orbit. It is used by both the ocean salinity and soil moisture operational processors to store the geophysical parameters from ECMWF forecasts. Access to other SMOS Level 1 and Level 2 "dynamic" and "static" auxiliary datasets is restricted to Cal/Val users. The detailed content of the SMOS Auxiliary Data Files (ADF) is described in the Products Specification documents available in the Resources section below.
Data - EO Sign In Authentication (Open)
SMOS L3 Sea Ice Thickness
The SMOS Level 3 Sea Ice Thickness product, in NetCDF format, provides daily estimations of SMOS-retrieved sea ice thickness (and its uncertainty) at the edge of the Arctic Ocean during the October-April (winter) season, from year 2010 onwards. The sea ice thickness is retrieved from the SMOS L1C product, up to a depth of approximately 0.5-1 m, depending on the ice temperature and salinity. Daily maps, projected on polar stereographic grid of 12.5 km, are generated by the Alfred Wegener Institut (AWI). This product is complementary with sea ice thickness measurements from ESA's CryoSat and Copernicus Sentinel-3 missions.
Data - Fast Registration with immediate access (Open)
GOSAT TANSO FTS and CAI full archive and new products
The TANSO-FTS instrument on-board GOSAT satellite features high optical throughput, fine spectral resolution, and a wide spectral coverage (from VIS to TIR in four bands). The reflective radiative energy is covered by the VIS and SWIR (Shortwave Infrared) ranges, while the emissive portion of radiation from Earth's surface and the atmosphere is covered by the MWIR (Midwave Infrared) and TIR (Thermal Infrared) ranges. These spectra include the absorption lines of greenhouse gases such as carbon dioxide (CO2) and methane (CH4). The TANSO-CAI instrument on-board GOSAT satellite is a radiometer in the spectral ranges of ultraviolet (UV), visible, and SWIR to correct cloud and aerosol interference. The imager has continuous spatial coverage, a wider field of view, and higher spatial resolution than the FTS in order to detect the aerosol spatial distribution and cloud coverage. Using the multispectral bands, the spectral characteristics of the aerosol scattering can be retrieved together with optical thickness. In addition, the UV-band range observations provide the aerosol data over land. With the FTS spectra, imager data, and the retrieval algorithm to remove cloud and aerosol contamination, the column density of the gases can be the column density of the gases can be retrieved with an accuracy of 1%. The full ESA archive and newly acquired/systematically processed GOSAT FTS and CAI products are available in the following processing levels: FTS Observation mode 1 L1B, day (FTS_OB1D_1) FTS Observation mode 1 L1B, night (FTS_OB1N_1) FTS Special Observation L1B, day (FTS_SPOD_1) FTS Special Observation L1B, night (FTS_SPON_1) FTS L2 CO2 profile, TIR (FTS_P01T_2) FTS L2 CH4 profile, TIR (FTS_P02T_2) FTS L2 CH4 column amount, SWIR (FTS_C02S_2) FTS L2 CO2 column amount, SWIR (FTS_C01S_2) FTS L2 H2O column amount, SWIR (FTS_C03S_2) FTS L3 global CO2 distribution, SWIR (FTS_C01S_3) FTS L3 global CH4 distribution, SWIR (FTS_C02S_3) FTS L4A global CO2 flux, annual in text format (FTS_F01M4A) FTS L4A global CO2 flux, annual in netCDF format (FTS_F03M4A) FTS L4A global CO2 distribution (FTS_P01M4B) FTS L4A global CH4 flux, annual in text format (FTS_F02M4A) FTS L4A global CH4 flux, annual in netCDF format (FTS_F04M4A) FTS L4A global CH4 distribution (FTS_P02M4B) CAI L1B data (CAI_TRB0_1) CAI L1B+ (CAI_TRBP_1) CAI L2 cloud flag (CAI_CLDM_2) CAI L3 global reflect. distrib. clear sky (CAI_TRCF_3) CAI L3 global radiance distrib. all pixels (CAI_TRCL_3) CAI L3 global NDVI (CAI_NDVI_3). All products are made available as soon as processed and received from JAXA. To satisfy NearRealTime requirements, ESA also provides access to the FTS L1X products, which are the NRT version of FTS L1B products. The main difference between L1X and L1B is that L1X does not include CAM data, best-estimate pointing-location, and target point classification, but most of all the L1X products are available on the ESA server between 2 and 5 hours after acquisition. The L1X products remains on the FTP server for 5 days, the time for the corresponding L1B to be available. A document describing the differences between L1X and L1B products is listed in the available resources. For more details on products, please refer to below product specifications.
Data - Fast Registration with immediate access (Open)
Envisat GOMOS Level 1b - Limb spectra [GOM_LIM_1P]
This data product describes localised calibrated upper and lower background limb spectra (flat-field corrected, with and without stray light). Coverage is as follows: Elevation range: C25+62 deg to +68 deg Azimuth range: +90 deg to +190 deg (with respect to the flight direction). The file size is Mbytes per occultation, depending on the duration of the occultation.
Data - Fast Registration with immediate access (Open)
Envisat GOMOS Level 2 - Atmospheric constituents profiles [GOM_NL__2P]
This data product describes atmospheric constituents profiles. In particular the vertical and line density profiles of ozone, NO2, NO3, O2, H2O, air, aerosols, temperature, turbulence. Coverage is as follows: Elevation range: +62 deg to +68 deg Azimuth range: +90 deg to +190 deg (with respect to the flight direction). The file size is 1 Mbyte per occultation, depending on the duration of the occultation.