- Learn & Discover
- How ESA uses space data to exp...
How ESA uses space data to explore deep Earth
18 May 2022

As anthropogenic activities continue to unbalance our environment, scientists strive to fully understand the intricate interactions within Earth’s system.
One root constituent of Earth’s system is “solid Earth”, meaning the inner core, the (liquid) outer core, the lower and upper mantle and the crust. This Earth Online Thematic article showcases the many ESA missions helping scientists better understand how solid Earth and its processes affect the planet’s changing environment.
The processes deep inside Earth’s core and crust and on its surface are critical to understanding Earth’s system as a whole. Many of ESA’s Earth observation satellites reveal key information about the structure of these internal layers and their interactions with each other and the cryosphere, hydrosphere, atmosphere and ionosphere.
Processes within solid Earth directly impact our environment. Sea-level changes are influenced by surface motions of solid Earth, such as regional ice melt and rebound of Earth’s surface following de-glaciation. In January, the powerful Hunga Tonga eruption served as a painful reminder how the tectonics of Earth’s strong outer layer (lithosphere) can impact our growing population.
Melting sea ice causes land lift
Using ground-breaking space technologies, the Earth Explorer family of research missions have long contributed to monitoring solid Earth. The first Earth Explorer, the Gravity Field and Steady-State Ocean Circulation Explorer (GOCE), used a state-of-the-art gradiometer to form a detailed global model of Earth’s gravity field and geoid.
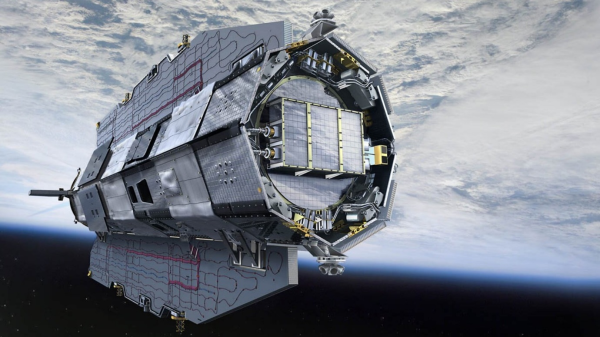
GOCE’s data, now delivered through ESA’s Heritage Space Programme, provide new insights into the physics of Earth’s interior, such as the geodynamics associated with the lithosphere and mantle composition. The data also further our knowledge of Earth’s surface movements, such as land uplift caused by the melting of thick ice sheets. More recently, scientists have combined GOCE data with surface measurements to generate a new model of Earth’s crust and upper mantle.
What is the geoid?
The geoid is a model depicting what Earth would look like if the sea level extended fully around the world, influenced only by the planet’s gravity. The model is used to measure the elevation of Earth’s surface.
Swarm maps core dynamics
The swirling, conducting iron in Earth’s liquid outer core create powerful electric currents, which in turn generate a magnetic field stretching far out into space. Earth’s magnetic field and magnetosphere shield life from the high-energy particles in cosmic rays and protect the atmosphere from direct exposure to the solar wind. ESA’s Swarm mission is an operational Earth Explorer tasked with mapping Earth’s magnetic field, studying core dynamics, space weather and radiation hazards.
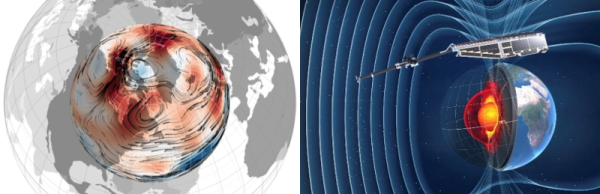
The 4D-Earth Swarm project aims to map the base state within Earth’s outer core and better understand the core dynamics driving Earth’s dynamo, by examining the rapid changes in the geomagnetic field as recorded by the three Swarm satellites.
Recent research using data from Swarm are also helping improve scientists’ understanding of a large region of reduced magnetic field, known as the ‘South Atlantic Anomaly’. Swarm’s global maps of the magnetic field contribute to research on how the iron in the core moves, helping explain why the north magnetic pole is drifting steadily towards Siberia.
Radar measures tectonic activity
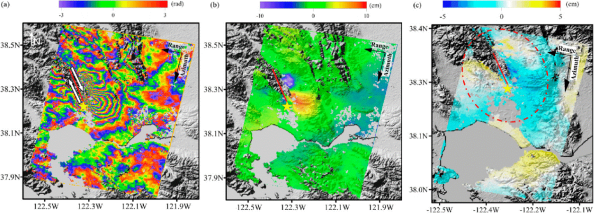
The tectonics of the Earth’s strong outer layer, the lithosphere, cause processes that have major impacts on humankind. Scientists use satellite radar data to analyse the movement of Earth’s surface during earthquakes.
By combining synthetic aperture radar (SAR) images of the same area before and after an earthquake, the phase change for the radar waves can create an interferogram. This technique, known as SAR Interferometry (InSAR), can be used to map surface deformations and analyse earthquakes.
What was the first InSAR satellite?
SAR Interferometry was first employed with the ERS-1 satellite, which pioneered use of satellites for this field. ERS-1 put the theory into practical effect for the first time when it was used to measure changes in surface deformation following an earthquake in 1992.
While the InSAR technique has made great progress using Copernicus Sentinel-1 imagery, it can also leverage the large amount of data acquired by non-operational ESA radar satellites of the Heritage Space Programme, such as ERS and Envisat. Radar missions whose data are provided via ESA’s Third Party Missions programme, such as COSMO-SkyMed and TerraSAR-X and Tandem-X, allow for frequent SAR measurements and can be valuable for tracking tectonic activity, which causes permanent changes in surface elevation.
These changes must be understood before adequate protective measures and medium- to long-term planning can be undertaken.