- News & Events
- Quality Reports Advanced Searc...
Quality Reports Advanced Search Portal takes off
29 Apr 2021
The Quality Reports Advanced Search (QRAS) Portal is a system that provides a set of functionalities for searching, filtering, visualising and downloading of Earth Observation reports data, from multiple missions—it just opened, enabling the management of some 50 reports daily.
The QRAS Portal system provides EO reports data from multiple missions, including Earth Explorers (for instance Aeolus, SMOS, CryoSat), Heritage Missions (ERS-1/2, and Envisat) and Third Party Missions (for instance Landsat).
The primary objectives of the QRAS Portal Lite Version are: to provide a single point of entry for accessing Quality Control Reports for all missions; the standardisation of reports type and filename for all missions reports; to provide a clear and modern user interface, which is responsive and user friendly; to provide a smart way to search and filter Quality Control Reports and to present the reports in a list view (and a calendar view in the full version). Users will be able to filter quality control reports by mission, instrument, calendar type, level and product type.
Quality Control Reports are documents generated daily, monthly or yearly, which contain three main sets of information:
- dataset completeness, checking that each data product type are completely processed (Level 1 or Level 2 products) or acquired by the stations (Level 0), and no data are missing
- data quality, that the instruments and the software used to process the data are working correctly
- scientific data stability, that during the instrument life the scientific content of the data provided are not degraded
Daily reports are more used by QC Teams, to monitor continuously the instrument and processing health, and to promptly identify any deviation (in instrument performance, processing correctness, or missing data).
The aim of the monthly and yearly reports is to supervise data quality and stability during the whole mission and instrument life and provide this information to QC Teams, data experts and scientists. These documents also are dedicated to the identification of any sign of instrument degradation, or to keep track of instrument unavailability.
The portal was generated from the need to help users find their way through the myriad of reports produced over the years, by the various live and heritage missions. The increasing attention to Earth observation by experts, as well as the broadening of the target audience to which Earth observation data are addressed, makes the project an excellent collection point for information regarding data availability, anomalies and product unavailability.
Users who in the past needed to consult reports from different missions, found it difficult to navigate through various sites to find the types of reports that were of interest to them. The different access points to the reports, the non-standardised nomenclature of the files, which differed according to the missions, made it difficult and time-consuming to find one's way around.
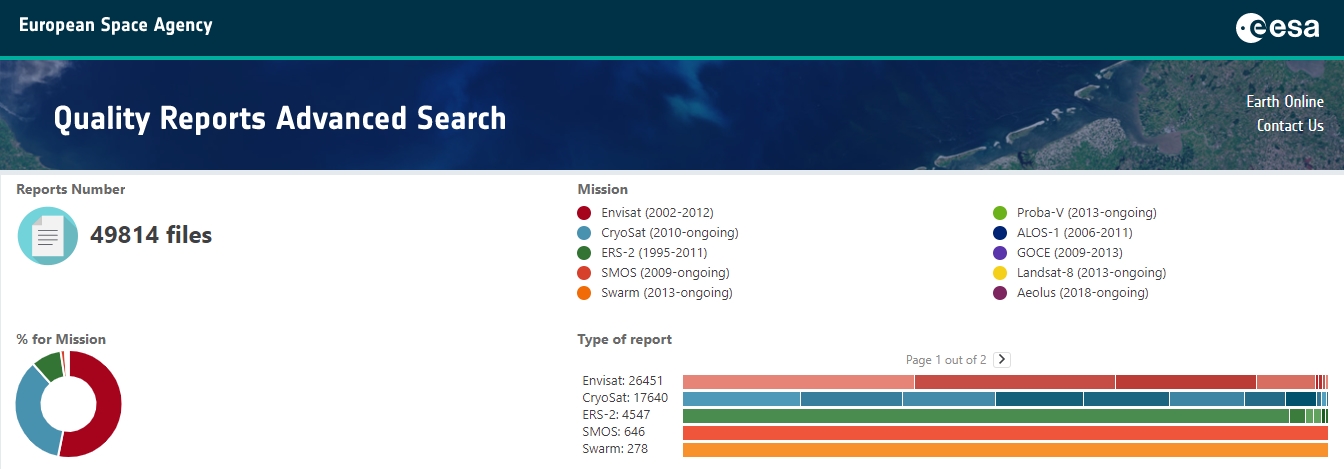
QRAS is the solution for the need to group and make available in a quick, easy and intuitive way the reports of the various live and heritage missions. The portal consists of a dashboard that shows in a simple and immediate way the number of reports available, the mission to which it belongs, the type of report and its details.
Each mission is associated with a reference colour, to help identify at a glance the availability of reports for a given mission. A different gradient of the same colour identifies the different types of reports available for the same mission.
For instance, if a user would like the latest reports regarding the CryoSat mission, they would just select the mission on the left navigation menu, and then, selecting one specific type of report, for example Intermediate Ocaen Product (IOP), the user could visualise all the IOP reports produced in the selected month. The system by default will show the reports for the current month, but the user can easily choose a different type of visualisation, on a yearly, monthly, or weekly basis. The user can also decide how to order them, either alphabetically or chronologically.
Watch the QRAS video tutorial.
The QRAS Portal hosts heritage and live mission reports, where live mission ones are uploaded and updated on a daily basis, and over 100 daily reports are expected on a monthly basis.
The QRAS Portal (Lite version) contains over 40,000 reports.