earth online
  • News
  • New paper “Swarm Langmuir prob...

New paper “Swarm Langmuir probes' data quality validation and future improvements” published

24 Mar 2022

The paper Swarm Langmuir probes' data quality validation and future improvementsby F. Catapano et al. has been published in the Geoscientific Instrumentation, Methods and Data Systems (GI) journal in March 2022.

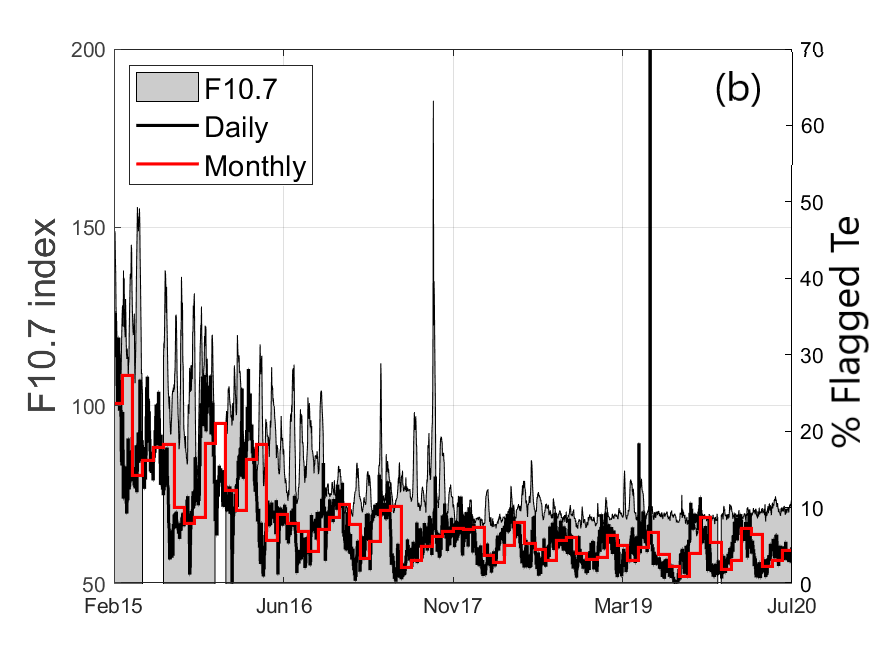
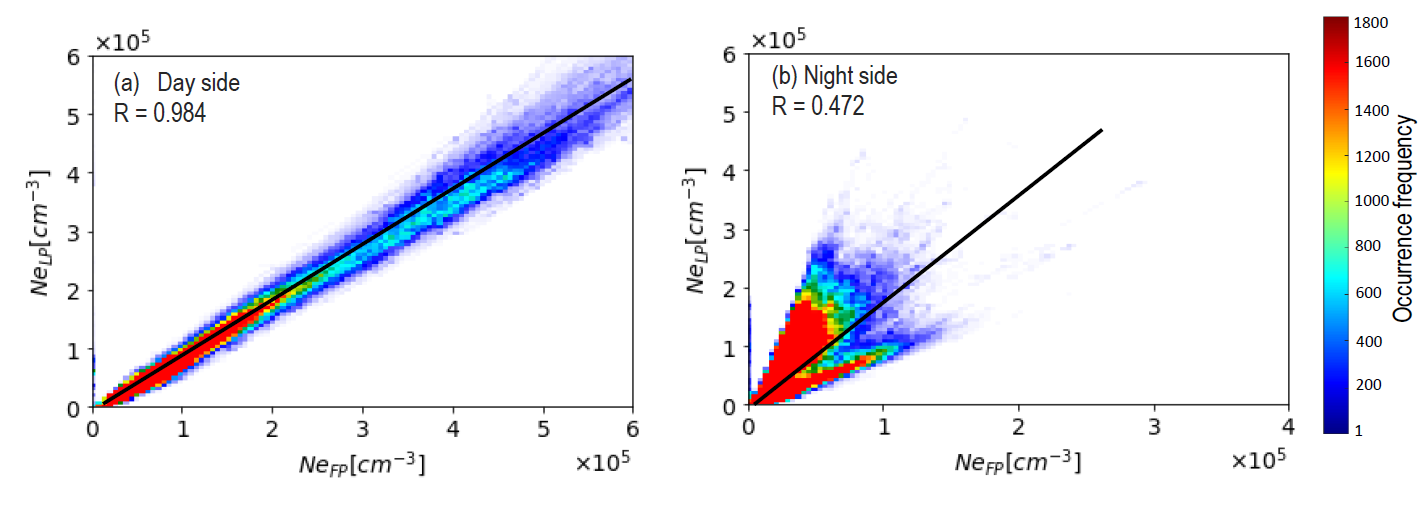
This paper presents the data quality analysis of the Swarm Langmuir Probes’ measurements. Short and long data segments are studied to investigate the impact of the solar activity and the main ionospheric plasma parameters. Based on the outcomes from quality control and validation activities conducted by ESA, as well as scientific analysis and feedback provided by the user community, the Swarm products are regularly upgraded. Discussions in the paper include:

  • The data quality improvements introduced with the latest baseline
  • The roadmap to further improvements to be included in future baselines


Daily (black lines) and monthly (red lines) percentage of invalid measurements (right axis) of (a) plasma density and (b) electron temperature measured by Swarm C from February 2015 to July 2020. The grey area in the panels represents the F10.7 index (left axis) in solar flux units in the same interval of time. Daily (black lines) and monthly (red lines) percentage of invalid measurements (right axis) of (a) plasma density and (b) electron temperature measured by Swarm C from February 2015 to July 2020. The grey area in the panels represents the F10.7 index (left axis) in solar flux units in the same interval of time
Daily (black lines) and monthly (red lines) percentage of invalid measurements (right axis) of (a) plasma density and (b) electron temperature measured by Swarm C from February 2015 to July 2020. The grey area in the panels represents the F10.7 index (left axis) in solar flux units in the same interval of time.
Comparison of the plasma density derived from the LP and FP on the (a) day side and the (b) night side as measured by Swarm C in February 2020. The black lines represent the linear fit obtained for the two data sets.
Tweet