- News
- Satellites reveal changes to E...
Satellites reveal changes to Earth’s icy zones
16 Aug 2022
ESA’s Earth observation activities are helping scientists investigate the influence of climate change on widespread ice-losses across the planet.
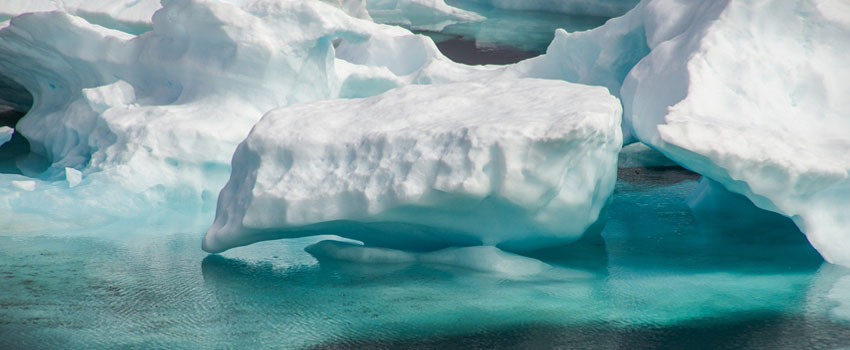
The frozen parts of the world – including sea ice, ice sheets and glaciers, as well as snow, permafrost and frozen water bodies – are known collectively as the cryosphere.
Earth’s polar regions are an important part of the cryosphere, but it also comprises of snowy and icy places between the two poles.
These ice-covered areas are a key part of the climate jigsaw, being an important indicator of the long-term changes impacting the planet.
In addition, ice-losses around the world driven by warming global temperatures have impacts that are felt across each of Earth’s systems.
The bright white surface of frozen water reflects a large portion of incoming solar radiation back to space, playing a vital role in global temperature regulation. Some parts of the cryosphere – such as glaciers and icesheets – also influence sea levels by storing huge amounts of water for long periods of time.
Why is it important to monitor changes in the cryosphere?
The cryosphere is a key part of Earth’s climate system, being a sensitive and informative indicator of climate change. By studying these snow and ice covered areas, scientists are improving their understanding of the long-term environmental changes impacting the planet. This is helping to guide policy that aims to reduce the impacts of the climate crisis.
ESA’s ice-monitoring mission
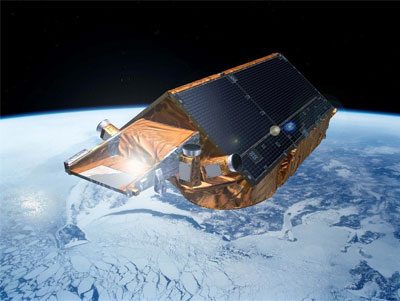
In 2010, ESA launched its first mission dedicated to the study of ice.
During its 12 years in polar orbit, CryoSat – which is part of ESA’s Earth Explorer programme – has continued to deliver detailed insight into Earth’s frozen zones.
The satellite’s altimeter returns readings of ice height by timing how long it takes for radar waves to bounce back to the satellite from the ice surface. For ice floating in the polar oceans, ice thickness is inferred by measuring the height of the ice above the water.
Data from CryoSat have contributed to numerous scientific publications.
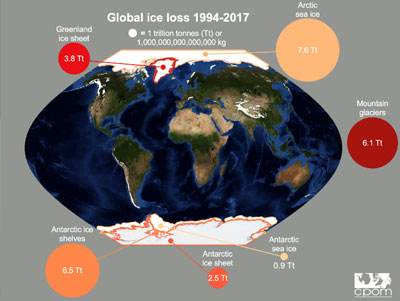
In 2020, an international team of scientists completed a global assessment using Earth observation data, revealing that Greenland and Antarctica are losing ice six times faster than in the 1990s.
Last year, research completed by a UK team further demonstrated that ice losses around the world are accelerating, driven mainly by steep rises in losses from the polar icesheets in Antarctica and Greenland.
Other Earth Explorer missions that are supporting the study of the cryosphere include the Soil Moisture and Ocean Salinity (SMOS) mission, which launched in November 2009.
By combining L-band microwave measurements collected by SMOS over frozen regions with glaciological and emission models, scientists have mapped temperatures at different depths within ice sheets, providing insight into ice accumulation and ice sheet dynamics.
Piecing together long-term change
Many assessments of cryospheric change over decades have drawn on data from ESA remote sensing satellites that are no longer operational, known as Heritage Missions.
The agency’s European Remote Sensing (ERS) programme was composed of two satellites, ERS-1 and ERS-2, which were launched into the same orbit in 1991 and 1995, respectively. The ERS-1 mission ended in March 2000, with ERS-2 remaining operational until 2011.
Following ERS, ESA launched its Envisat satellite in 2002, which delivered a decade of environmental data before the mission concluded in 2012.
These missions provided data detailing different aspects of the environment, including the cryosphere.
Through ESA’s Heritage Space Programme, Heritage data are maintained, made accessible on a free basis, and continuously improved, so that they can be combined with information from active missions to build continuous pictures of the environment.
Another Heritage Mission to support research into the cryosphere was ESA's Gravity field and Ocean Circulation Explorer (GOCE).
Active between 2009 and 2013, the mission carried a gravity gradiometer to provide an accurate and detailed global model of Earth's gravity field and geoid.
GOCE provided estimates of the thickness of the polar ice sheets by combining information on bedrock topography derived from gradiometry and ice-sheet surface topography derived from altimetry.
How are we monitoring the cryosphere?
Scientists monitor the cryosphere by using remote sensing satellites, as well as networks of in situ ground stations. Many types of Earth observation data – including optical imagery and radar – are used to track the changes to Earth’s icy zones. By combining information collected by current and previous missions, researchers can estimate how the cryosphere is evolving over decades.
Ice data from commercial European and international missions
Through its Third Party Missions (TPM) programme, ESA disseminates high-quality remote sensing data collected by international partner missions to a range of users for free, to support research and development activities.
TPMs that collect data on the cryosphere include ICEYE, which consists of a constellation of 16 X-band synthetic aperture radar satellites.
ICEYE's overall mission objective is to enable better decision making by providing timely and reliable Earth observation data.
The constellation provides information on sea ice conditions and iceberg locations, supporting navigation and route planning in the maritime industry.
In addition, the Canadian-led RADARSAT programme – consisting of two satellites, one of which, RADARSAT-2, remains operational – provides data to support science and operational activities in a number of fields, including ocean monitoring and ice studies.
Other TPMs to provide data on Earth’s icy zones include SkySat, the WorldView series, and Pléiades Neo.