- ERS
- Mission
- Radar Courses
- Radar Course 2
ERS Radar Course 2
1. Independence of solar illumination
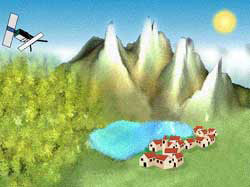
SAR is an active system.
It illuminates the Earth surface and measures the reflected signal. Therefore, images can be acquired day and night, completely independent of solar illumination, which is particularly important in high latitudes (polar night).

This SAR image was acquired by ERS-1 on 2 August 1991 over the Netherlands, local time 23:40.
2. Independence of cloud coverage
The microwaves emitted and received by ERS SAR are at much longer wavelengths (5.6 cm) than optical or infrared waves. Therefore, microwaves easily penetrate clouds, and images can be acquired independently of the current weather conditions.

These images were acquired over the city of Udine (I), by ERS-1 on 4 July 1993 at 09:59 (GMT) and Landsat-5 on the same date at 09:14 (GMT) respectively. The clouds that are clearly visible in the optical image, do not appear in the SAR image.
3. Control of emitted electromagnetic radiation
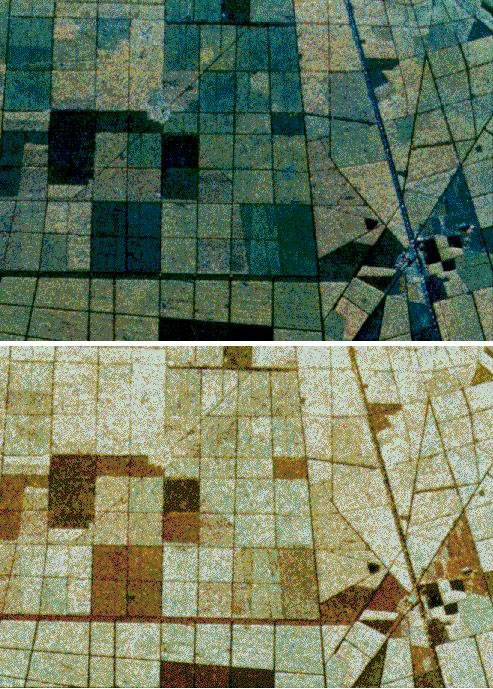
Because an imaging radar is an active system, the properties of the transmitted and received electromagnetic radiation (power, frequency, polarization) can be optimised according to mission specification goals.
The top part of the image shows a three band combination (P-Band-->RED, L-Band-->GREEN and C-Band-->BLUE) for JPL aircraft SAR overfly over Landes (F) during the MAESTRO-1 campaign. On the bottom side, a multipolarization combination (HH -->RED, VV-->GREEN and HV-->BLUE) shows different details of the same site.
4. Control of imaging geometry
Because an imaging radar is an active system, the geometric configuration for illuminating the terrain (altitude of aircraft/spacecraft depression angle) can be optimised according to mission specification goals.
5. Access to different parameters compared to optical systems

Images provided by optical sensors contain information about the surface layer of the imaged objects (i.e. colour), while microwave images provide information about the geometric and dielectric properties of the surface or volume studied (i.e., roughness).
These images were acquired over the city of Bucharest (R), by ERS-1 and Landsat-5 respectively. The city has a star-shaped urban structure, with a historical centre from which the urban area extends along the main road.
In the centre of the city, the presidential palace can be seen, and to the right even the main entry is visible.
The main avenues form three concentric rings around the centre. The national airport is located in the north. The Dimbovita river, a tributary of the Danube, crosses the northern part of the city, and has meanders, partly filled by an artificial lake. Other lakes are visible in the center and in the lower part of the image. The circular zone in the South is a forested area, with a large building in the centre.
The vegetation visible in the image is an agricultural area, mainly corn fields. In the north, large zones essentially covered by trees can be observed.
The SAR image is a multi-temporal composition of three images (3/07/92, 25/11/92, 30/12/92), the urban area is well imaged and the density of the built-up area can be assessed by the strength of the backscattered signal.
In contrast to the optical image, highways, large roads and avenues are presented as dark lines. This is also true for the runways on airports, because of the smooth surface. Bridges and railways on the contrary are imaged mostly very brightly due to the dielectric property of metal.
The different colours of the agricultural fields depend on the changes in surface roughness occurred between the acquisition dates.
Data acquired in spring and summer is used to identify the crop type, a methodology similar to the one applied with optical data.
However, it has been reported that data acquired in the winter is also of great interest, since it reveals the type of field labour performed, which is often typical of the preparation of the fields for certain crops. The data helps to assess certain crop types and estimate their surfaces very early in the year.
It is obvious that such data application must be based on good knowledge of the time and type of field preparation. Initially sufficient ground survey needs to be available.
6. Access to information about subsurface features

Because of the long wavelengths of microwaves, these are able to penetrate not only clouds, but also features such as soil, sand, snow (in very dry conditions only), or the canopy of a forest, thus providing information about hidden features.
The Landsat TM band combination 754 (left) shows the main course of the river beds (wadies), highlighted in red, which might be linked to scarce vegetation. Sediments (sand) is shown in light colours, and different rock types and mineralisation in dark colour.
ERS-1 SAR C-Band (right) gives more different information on the same area. Mainly regarding surface roughness and perhaps surface penetration. A fine network on riverbeds is displayed.
7. Radar principles
Radar sensors are usually divided into two groups according to their modes of operation. Active sensors are those that provide their own illumination and therefore contain a transmitter and a receiver, while passive sensors are simply receivers that measure the radiation emanating from the scene under observation.
Active systems:
- Radar imaging systems (Radar = RAdio Detection And Ranging)
- Scatterometers
- Altimeters
Passive systems:
- Microwave radiometers
We are interested in radar imaging systems. The basic principle of a radar is transmission and reception of pulses. Short (microsecond) high energy pulses are emitted and the returning echoes recorded, providing information on:
- Magnitude
- phase
- time interval between pulse emission and return from the object
- polarization
- Doppler frequency
The same antenna is often used for transmission and reception. This image presents the basic elements of an imaging radar system.
The two types of imaging radars most commonly used are:
- RAR --> Real Aperture Radar
- SAR --> Synthetic Aperture Radar
Real Aperture radars are often called SLAR (Side Looking Airborne Radar). Both Real Aperture and Synthetic Aperture Radar are side-looking systems with an illumination direction usually perpendicular to the flight line.
The difference lies in the resolution of the along-track, or azimuth direction. Real Aperture Radars have azimuth resolution determined by the antenna beamwidth, so that it is proportional to the distance between the radar and the target (slant-range).
Synthetic Aperture Radar uses signal processing to synthesise an aperture that is hundreds of times longer than the actual antenna by operating on a sequence of signals recorded in the system memory.
These systems have azimuth resolution (along-track resolution) that is independent of the distance between the antenna and the target.
The nominal azimuth resolution for a SAR is half of the real antenna size, although larger resolution may be selected so that other aspects of image quality may be improved.
Generally, depending on the processing, resolutions achieved are of the order of 1-2 metres for airborne radars and 5-50 metres for spaceborne radars.
8. Real Aperture Radar (RAR)
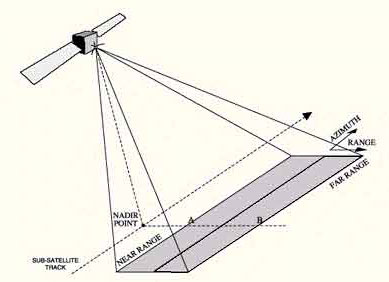
A narrow beam of energy is directed perpendicularly to the flight path of the carrier platform (aircraft or spacecraft). A pulse of energy is transmitted from the radar antenna, and the relative intensity of the reflections is used to produce an image of a narrow strip of terrain.
Reflections from larger ranges arrive back at the radar after proportionately larger time, which becomes the range direction in the image. When the next pulse is transmitted, the radar will have moved forward a small distance and a slightly different strip of terrain will be imaged.
These sequential strips of terrain will then be recorded side by side to build up the azimuth direction. The image consists of the two dimensional data array.
In this figure, the strip of terrain to be imaged is from point A to point B. Point A being nearest to the nadir point is said to lie at near range and point B, being furthest, is said to lie at far range.
The distance between A and B defines the swath width. The distance between any point within the swath and the radar is called its slant range.
Ground range for any point within the swath is its distance from the nadir point (point on the ground directly underneath the radar).
9. Real Aperture Radar: Range resolution
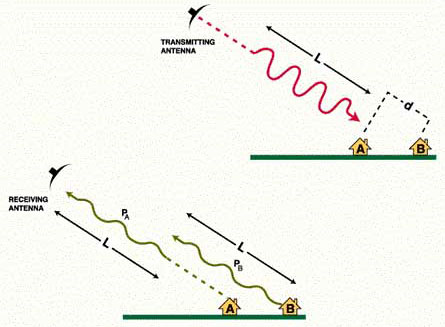
For the radar to be able to distinguish two closely spaced elements, their echoes must necessarily be received at different times.
In the upper part of the figure, the pulse of length L is approaching buildings A and B. The slant range distance between the two buildings is d.
Since the radar pulse must travel two ways, the two buildings lead to two distinguished echoes if:
d > L/2
The part of the pulse backscattered by building A is PA, and the part of the pulse backscattered by building B is PB.
It appears in the lower part of the figure that to reach the target and come back, PB has covered an extra distance 2d, and thus is at a slightly shorter distance than L behind PA.
Because of this, the end of PA and the beginning of PB overlap when they reach the antenna. As a consequence, they are imaged as one single large target which extends from A to B.
If the slant range distance between A and B were slightly higher than L/2, the two pulses would not overlap and the two signals would be recorded separately.
Range resolution (across track resolution) is approximately equal to L/2, i.e. half the pulse length.
Ground range resolution is:
where:
c speed of light
t pulse duration
q incidence angle
Incidence angle is the angle between the vertical to the terrain and the line going from the antenna to the object.
To improve range resolution, radar pulses should be as short as possible. However, it is also necessary for the pulses to transmit enough energy to enable the detection of the reflected signals.
If the pulse is shortened, its amplitude must be increased to keep the same total energy in the pulse.
One limitation is the fact that the equipment required to transmit a very short, high-energy pulse is difficult to build.
For this reason, most long range radar systems use the "chirp" approach which is an alternative method of pulse compression by frequency modulation.
In the case of the chirp technique, instead of a short pulse with a constant frequency, a long pulse is emitted with a modulated frequency.
The frequency modulation must be processed after reception to focus the pulse to a much shorter value. For the user, the result is the same as if a very short pulse had been used throughout the system.
10. Real Aperture Radar: Azimuth resolution
Azimuth resolution describes the ability of an imaging radar to separate two closely spaced scatterers in the direction parallel to the motion vector of the sensor.
In the image when two objects are in the radar beam simultaneously, for almost all pulses, they both cause reflections, and their echoes will be received at the same time.
However, the reflected echo from the third object will not be received until the radar moves forward. When the third object is illuminated, the first two objects are no longer illuminated, thus the echo from this object will be recorded separately.
For a real aperture radar, two targets in the azimuth or along-track resolution can be separated only if the distance between them is larger than the radar beamwidth. Hence the beamwidth is taken as the azimuth resolution depending also slant-range distance to the target for these systems.
For all types of radars, the beamwidth is a constant angular value with range. For a diffraction limited system, for a given wavelength l, the azimuth beamwidth b depends on the physical length dH of the antenna in the horizontal direction according to:
b = l/dH
For example, to obtain a beamwidth of 10 milliradians using 50 millimetres wavelength, it would be necessary to use an antenna 5 metres long. The real aperture azimuth resolution is given by:
raz = R* b
where:
raz azimuth resolution
R slant range
For example for a Real Aperture Radar of beamwidth 10 milliradians, at a slant range R equal to 700 kilometres, the azimuth resolution raz will be:
raz = 700 x 0.01
raz = 7 km
Real Aperture Radars do not provide fine resolution from orbital altitudes, although they have been built and operated successfully (for example COSMOS 1500, a spacecraft built by the former Soviet Union).
For such radars, azimuth resolution can be improved only by longer antenna or shorter wavelength. The use of shorter wavelength generally leads to a higher cloud and atmospheric attenuation, reducing the all-weather capability of imaging radars.
11. Synthetic Aperture Radar (SAR)

Synthetic Aperture Radars were developed as a means of overcoming the limitations of real aperture radars. These systems achieve good azimuth resolution that is independent of the slant range to the target, yet use small antennae and relatively long wavelengths to do it.
SAR Principle
A synthetic aperture is produced by using the forward motion of the radar. As it passes a given scatterer, many pulses are reflected in sequence. By recording and then combining these individual signals, a "synthetic aperture" is created in the computer providing a much improved azimuth resolution.
It is important to note that some details of the structure of the echoes produced by a given target change during the time the radar passes by. This change is explained also by the Doppler effect which among others is used to focus the signals in the azimuth processor. We will illustrate this point with an analogy.
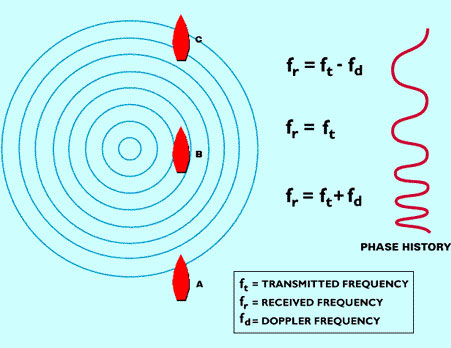
Let us consider, as in the case of the second figure here, a plunger going up and down in the water, producing circles of radiating waves, each with a constant frequency fZ.
These waves travel at a known speed. The plunger is a source of waves analogous to those from a radar. We are interested in the appearance of this wave field at a certain distance.
Consider a boat is moving along the line. At position B, a passenger on the boat would count the same wave number as emitted, since he is moving neither toward nor away from the waves (source).
However, at position A, the boat is moving towards the waves and the passenger will count a higher number of waves: the travelling speed of the waves is slightly increased by the speed of the ship.
On the contrary, at position C, the boat is moving away from the buoy and the apparent frequency is lower: the waves are moving in the same direction as the boat.
Doppler frequency is the difference between received and emitted frequencies where the difference is caused by relative motion between the source and the observer.
Equivalently, the relative spacing between crests of the wave field could be recorded along the line AC, measured as if the wave field were motionless.
This leads to a phase model of the signals that is equivalent to the Doppler model.
During the movement of the boat from position A to position C, the recording by the observer of the number of waves would look like the curve at the right of the figure.
Instead of a plunger, let us now consider an aircraft emitting a radar signal. The boat corresponds to a target appearing to move through the antenna beam as the radar moves past.
The record of the signals backscattered by the target and received would be similar to the record of the passenger in the boat. Such a record is called the Doppler history (or phase history) of the returned signals.
When the target is entering the beam, the Doppler shift is positive because the source to target distance is decreasing. The phase history is then stored to be used during the SAR processing.
By the time the antenna is abeam relative to the target, the received frequency is nominal, with the Doppler frequency being zero. Late it decreases as the satellite moves away.
The phase history is then stored to be used during the SAR processing.
12. SAR processing
The objective of SAR processing is to reconstruct the imaged scene from the many pulses reflected by each single target, received by the antenna and registered in memory.
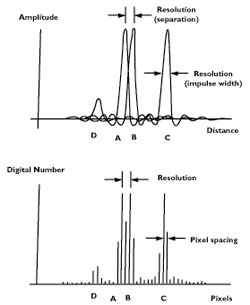
Resolution describes the minimal discernable spacing between two similar point responses (A and B), but often is applied to the width of one response (C). A weaker response (D) requires a larger separation for detection.
Pixels refer to the discrete sample positions used for digital imagery. There must be at least two pixels within a resolution distance.
SAR processing is a simple process although it requires much computation. It can be considered as a two-dimensional focussing operation.
The first of these is the relatively straightforward one of range focussing, requiring the de-chirping of the received echoes.
Azimuth focussing depends upon the Doppler histories produced by each point in the target field and is similar to the de-chirping operation used to focus in the range direction.
This is complicated however by the fact that these Doppler histories are range dependent, so azimuth compression must have the same range dependency.
It is necessary also to make various corrections to the data for sensor motion and Earth rotation for example, as well as for the changes in target range as the sensor flies past it.
It is important to note (see figure) that the pixel of the final SAR image does not have the same dimensions as the resolution cell during the data acquisition, due to the variation of range resolution with incidence angle. Thus it is necessary to perform a pixel resampling with a uniform grid.
Even more fundamental, at least two pixels are required to represent each resolution cell, which is a consequence of digital sampling rules. By convention, pixel spacing in SAR imagery is chosen to conform to standard map scales, hence must be a discrete multiple (or divisor) of 100 metres.
For example, ERS-1 data, having nominal resolution of 28 metres in range and azimuth, is delivered with 12.5 metre pixel spacings.
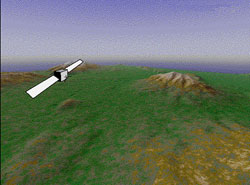
13. ERS SAR geometric configuration
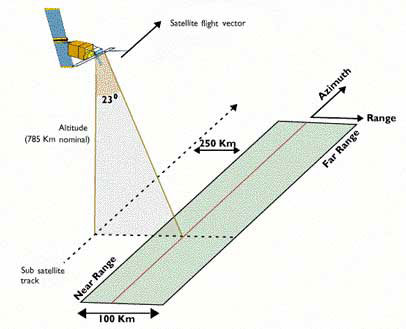
The spacecraft flew in its orbit and carried a SAR sensor which pointed perpendicular to the flight direction.
The projection of the orbit down to Earth is known as the ground track or subsatellite track. The area continuously imaged from the radar beam is called radar swath. Due to the look angle of about 23 degrees in the case of ERS, the imaged area is located some 250 km to the right of the subsatellite track. The radar swath itself is divided in a near range - the part closer to the ground track - and a far range.
In the SAR image, the direction of the satellite's movement is called azimuth direction, while the imaging direction is called range direction.
14. Slant range / ground range
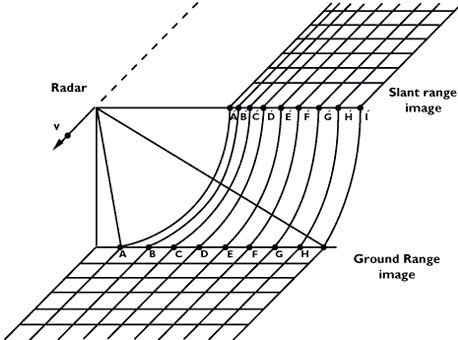
The figure shows two types of radar data display:
- slant range image, in which distances are measured between the antenna and the target
- ground range image, in which distances are measured between the platform ground track and the target, and placed in the correct position on the chosen reference plane
Slant range data is the natural result of radar range measurements. Transformation to ground range requires correction at each data point for local terrain slope and elevation.

This figure illustrates an example of SAR data using a Seasat scene of Geneva (Switzerland). The slant range image is displayed on the left of the screen, while the ground range image is on the right side.
The geometric distortions present on a radar image can be divided into:
- Range distortions: Radar measures slant ranges but, for an image to represent correctly the surface, it must be ground range corrected
- Elevation distortions: this occurs in those cases where points have an elevation different from the mean terrain elevation
15. Optical vs. microwave image geometry
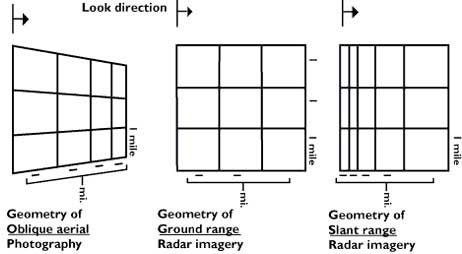
The figure presents a comparison between respective geometries of radar image and oblique aerial photos.
The reason for the major differences between the two image's geometry is that an optical sensor measures viewing angles, while a microwave imager determines distances.
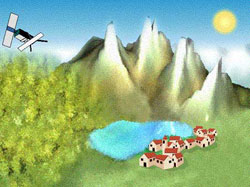
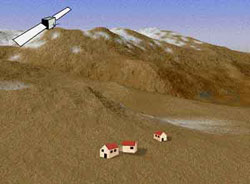
16. Foreshortening
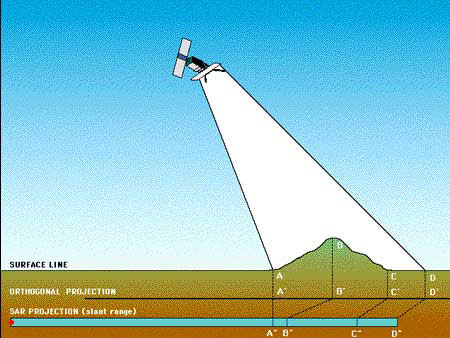

The most striking feature in SAR images is the "strange" geometry in range direction. This effect is caused by the SAR imaging principle: measuring signal travel time and not angles as optical systems do.
The time delay between the radar echoes received from two different points determines their distance in the image. Let us consider the mountain as sketched in the figure. Points A, B and C are equally spaced when vertically projected on the ground (as it is done in conventional cartography).
However, the distance between A'' and B'' is considerably shorter compared to B'' - C'', because the top of the mountain is relatively close to the SAR sensor.
Foreshortening is a dominant effect in SAR images of mountainous areas. Especially in the case of steep-looking spaceborne sensors, the across-track slant-range differences between two points located on foreslopes of mountains are smaller than they would be in flat areas.
This effect results in an across-track compression of the radiometric information backscattered from foreslope areas (see example of ERS image to the left) which may be compensated during the geocoding process if a terrain model is available.
Foreshortening is obvious in mountaineous areas (top left corner), where the mountains seem to "lean" towards the sensor.
It is worth noting that shortening effects are still present on ellipsoid corrected data.
17. Layover
If, in the case of a very steep slope, targets in the valley have a larger slant range than related mountain tops, then the foreslope is "reversed" in the slant range image.
This phenomenon is called layover: the ordering of surface elements on the radar image is the reverse of the ordering on the ground. Generally, these layover zones, facing radar illumination, appear as bright features on the image due to the low incidence angle.
Ambiguity occurs between targets hit in the valley and in the foreland of the mountain, in case they have the same slant-range distance. For steep incidence angles this might also include targets on the backslope.
Geocoding can not resolve the ambiguities due to the representation of several points on the ground by one single point on the image; these zones also appear bright on the geocoded image.
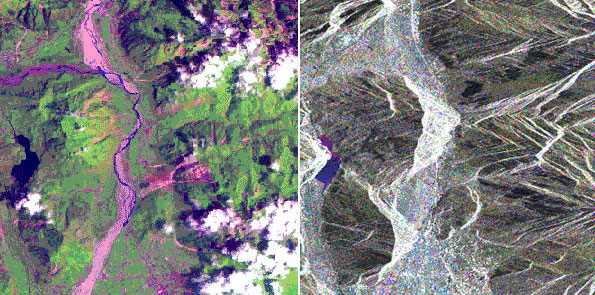
These images were acquired over a mountainous zone close to the city of Udine (I), by ERS-1 and Landsat-5 respectively.
The effect of layover is visible in the whole SAR image, in particular on the two mountains that are on the right of the lake. The height of the upper one (San Simeone) is about 1000 m above the valley bottom (1220 msl), while the height of the lower one (Brancot) is 1015 msl.
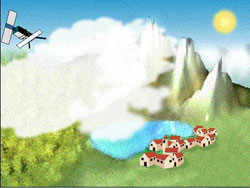
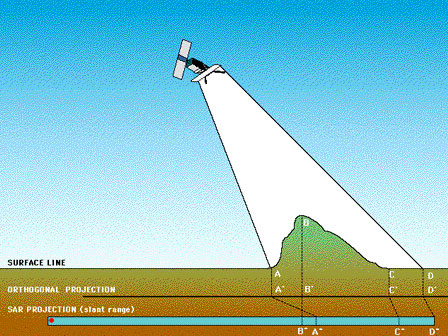
18. Shadow
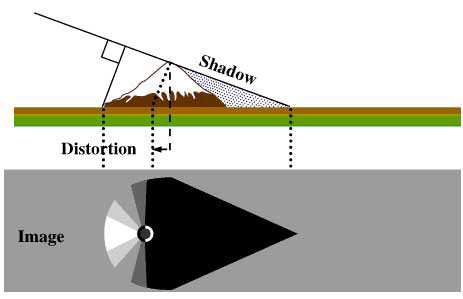

A slope away from the radar illumination with an angle that is steeper than the sensor depression angle provokes radar shadows.
It should be also noted that the radar shadows of two objects of the same height are longer in the far range than in the near range.
Shadow regions appear as dark (zero signal) with any changes due solely to system noise, sidelobes, and other effects normally of small importance.
Let us consider the mountain as sketched in the image. Points A, B, C and D are defining different parts of the target when vertically projected on the ground (the orthogonal projection, as it is done in conventional cartography). However, the segment between B and C is not giving any contribution in the slant range direction which is the SAR projection ( B'' - C'' ), due to the geometry of the mountain.
Note also the distance AB becoming orthogonal projected A' B'. In the slant-range projection this is A'' B'', much shorter, due to the foreshortening effect.


This multitemporal (13-19-25/09/1991) SAR image has been acquired over the Cote D'Azur area (France). The Gran Canon du Verdon visible in the central part of the image has a very steep gorge that descends swiftly to the valley bottom, causing Radar shadow. This is shown by the dark zones in the central part of the image.
A map of the area may be useful to localise the feature.
19. Geometric effects for image interpretation
Based upon the previous considerations on SAR image geometry, the following remarks can be formulated in order to assist the interpreter:
- for regions of low relief, larger incidence angles give a slight enhancement to topographic features. So does very small incidence angles.
- for regions of high relief, layover is minimised and shadowing exaggerated by larger incidence angles. Smaller incidence angles are preferable to avoid shadowing.
- intermediate incidence angles correspond to low relief distortion and good detection of land (but not water) features.
- small incidence angles are necessary to give acceptable levels of backscattering from ocean surfaces.
- planimetric applications necessitate the use of ground range data, which usually requires use of digital elevation data and image transformation.
20. SAR image geocoding
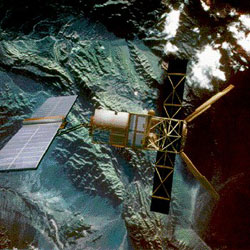
The principle of side-looking SAR is measurement of the electromagnetic signal round trip time for the determination of slant ranges to objects and the strength of the returned signal. This principle causes several types of geometrical distortions.
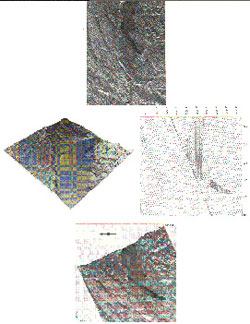
The upper part of the image shows an example of radar image with its characteristic slant range geometry. Severe distortions occur if pronounced terrain relief is present in the imaged zone.
The amount of distortion depends on the particular side-looking geometry and on the magnitude of the undulation of the terrain's surface.
The central part of the figure shows a digital elevation model of the zone that is used to create a grid map necessary to locate correctly the position of the pixels.
In many applications such as agriculture and vegetation mapping, the terrain-induced distortions degrade the usefulness of SAR images and in some cases may even prevent information extraction.
The lower part of the figure map represents the geometrically corrected image.
SAR data geocoding is a very important step for many users because SAR data should be geometrically correct in order to be compared or integrated with other types of data (satellite images, maps, etc.).
Geocoding an image consists of introducing spatial shifts on the original image in order to have a correspondance between the position of points on the final image and their location in a given cartographic projection.
Radiometric distortions also exist in connection with terrain relief and often cannot be completely corrected. In addition, resampling of the image can introduce radiometric errors.
For these reasons, the thematic user of the image needs information on what he should expect in terms of interpretability of geocoded images for a given thematic application.
A layover/shadowing mask and a local incidence angles map are both helpful for many applications.
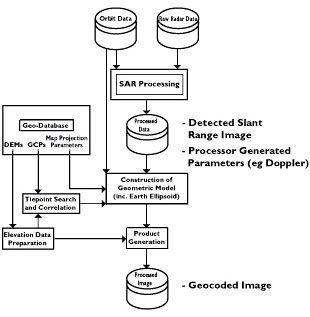
This figure illustrates a SAR geocoding system consisting of three data bases:
- Orbital parameters,
- Raw radar data,
- Geographic data base (Digital Terrain Model, Control Points and parameters of cartographic projection)
ERS-1 SAR looked at the Earth's surface with a 23° incidence angle. Due to this, images contained almost no shadow but may have contained a large amount of layover and foreshortening.
With the geocoded data, ERS-1 PAFs (Processing and Archiving Facilities) provide on request a data file indicating the layover and shadowed zones as well as the local incidence angle for each element of the picture.
This file is useful for the interpreter prior to thematic mapping. If a Digital Elevation Model is available, it may be possible to correct the terrain influence in SAR images.

This figure illustrates an example of SAR data geocoding.
The reference scene (left of the screen) was acquired on 24 November 1991 over the north-western part of Switzerland and includes the city of Basel and the Rhine (top-left corner), the chain of the Jura mountains (northern part of the image), the Aare river crossing through the centre of the image with the capitol Berne near the lower left corner.
The southern part consists of lowland hills, the Napf area and the pre-alpine mountain chains.
The shores of the Lake of Lucerne (Vierwaldstätter See), in the south-east are not well defined due to wind-roughening effects.
The image presents strong geometric distortions which are no more visible in the corrected image displayed on the right.
21. Microwaves
The basic principle of imaging radars is to emit electromagnetic radiation towards the Earth surface and to record the quantity and time delay of energy backscattered.
This information is carried by the electromagnetic waves defined by:
- direction of propagation
- amplitude
- wavelength
- polarisation
- phase
The relation between frequency f and wavelength l can be shown as:
f = c/l
where:
frequency [Hz]
c
wavelength [m]
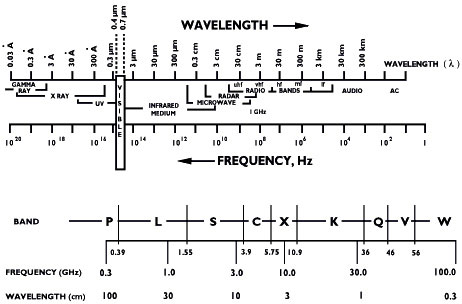
For microwave remote sensing, the used wavelengths are usually between 1 centimetre and 1 metre. The figure presents the electromagnetic spectrum and the letter designations of the microwave portions commonly used.
22. Reflectivity measured by imaging radars
An imaging radar produces an image in which the digital number at each pixel position is determined by the strength of the radar signal reflected from the corresponding location in the scene.
Digital image files usually are created using the square root of power, since less dynamic range is required for data in this form. For technical purposes, radar performance may be analysed in terms of the power of the reflected signals.
The power received from each radar pulse transmitted may be expressed in terms of the physical parameters of the radar and illumination geometry through the Radar equation.
The received power is a function of radar wavelength and wave polarization, among other variables. Images are built by integrating over many pulses, and the mean power in the image from a terrain patch may be derived from the single pulse radar equation.
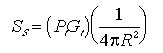
For users, the important relationship is the SAR image Radar equation, which has the form:

where:

This expression includes the most important parameter dependencies of concern to a user, which are incidence angle and range. The signal level is very sensitive to the antenna gain pattern, which often is the limiting factor in system brightness calibration.
s 0 is the radar cross section per surface unit of the target, it is commonly called the radar backscattering coefficient and is a parameter characterising the target.
s 0 is dimensionless but, as associated to a very high dynamic range (of the order of 105), it is generally expressed in decibels:

23. Parameters affecting radar backscatter
Different surface features exhibit different scattering characteristics:
- Urban areas: very strong backscatter
- Forest: intermediate backscatter
- Calm water: smooth surface, low backscatter
- Rough sea: increased backscatter due to wind and current effects
The radar backscattering coefficient s 0 provided information about the imaged surface. It is a function of:
- Radar observation parameters:
(frequency f, polarisation p and incidence angle of the electromagnetic waves emitted); - Surface parameters:
(roughness, geometric shape and dielectric properties of the target).
Influence of frequency
The frequency of the incident radiation determines:
- The penetration depth of the waves for the target imaged;
- The relative roughness of the surface considered.
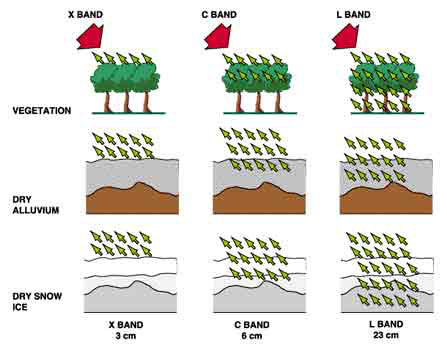
Penetration depth tends to be longer with longer wavelengths. If we consider the example of a forest, the radiation will only penetrate the first leaves on top of the trees if using the X-band (? = 3 cm). The information content of the image is related to the top layer and the crown of the trees. On the other hand, in the case of L-band (? = 23 cm), the radiation penetrates leaves and small branches; the information content of the image is then related to branches and eventually tree trunks.
The same phenomenon applies to various types of surfaces or targets (see the figure).
But it should be noted that:
- Penetration depth is also related to the moisture of the target;
- Microwaves do not penetrate water more than a few millimetres.
Influence of polarization
Polarization describes the orientation of the electric field component of an electromagnetic wave. Imaging radars can have different polarization configurations.
However, linear polarization configurations HH, VV, HV, VH are more commonly used. The first term corresponds to the polarization of the emitted radiation, the second term to the received radiation, so that XHV refers to X band, H transmit, and V receive for example.
In certain specific cases, polarization can provide information on different layers of the target, for example flooded vegetation. The penetration depth of the radar wave varies with the polarization chosen.
Polarization may provide information on the form and the orientation of small scattering elements that compose the surface or target.
More than one bounce of backscattering tends to depolarize the pulse, so that the cross polarized return in this case would be larger than with single bounce reflection.
Influence of roughness
Roughness is a relative concept depending upon wavelength and incidence angle.
A surface is considered "rough" if its surface structure has dimensions that are comparable to the incident wavelength.
According to the Rayleigh criterion, a surface is considered smooth if:

Considered rough if:

An example of the effect of surface roughness can be observed in the zones of contact between land and water.
Inland water bodies tend to be relatively smooth, with most of the energy being reflected away from the radar and only a slight backscatter towards the radar.
On the contrary, land surfaces tend to have a higher roughness.
Water bodies generally have a dark tonality on radar images, except in the case of wind-stress or current that increase the water surface roughness, which provokes a high backscatter (see Bragg scattering, below).
In the microwave region, this difference between respective properties of land and water can be extremely useful for such applications as flood extent measurement or coastal zones erosion. This image illustrates the range of backscatter from water surfaces.
Influence of incidence angle
The incidence angle is defined by the angle between the perpendicular to the imaged surface and the direction of the incident radiation. For most natural targets, backscatter coefficient s 0 varies with the incidence angle.
Experimental work was conducted by Ulaby et al. (1978) using five soils with different surface roughness conditions but with similar moisture content. It appeared that, when using the L band (1.1 GHz), the backscatter of smooth fields was very sensitive to near nadir incidence angles; on the other hand, in the case of rough fields, the backscatter was almost independent of the incidence angle chosen.
Influence of moisture
The complex dielectric constant is a measure of the electric properties of surface materials. It consists of two parts (permittivity and conductivity) that are both highly dependent on the moisture content of the material considered.
In the microwave region, most natural materials have a dielectric constant between 3 and 8, in dry conditions. Water has a high dielectric constant (80), at least 10 times higher than for dry soil.
As a result, a change in moisture content generally provokes a significant change in the dielectric properties of natural materials; increasing moisture is associated with an increased radar reflectivity.
The electromagnetic wave penetration in an object is an inverse function of water content. In the specific case of vegetation, penetration depth depends on moisture, density and geometric structure of the plants (leaves, branches).
24. Bragg scattering
As the incidence angle of the ERS SAR is oblique (23) to the local mean angle of the ocean surface, there is almost no direct specular reflection except at very high sea states.
It is therefore assumed that at first approximation Bragg resonance is the primary mechanism for backscattering radar pulses.
The Bragg equation defines the ocean wavelengths for Bragg scattering as a function of radar wavelength and incidence angle:

The short Bragg-scale waves are formed in response to wind stress. If the sea surface is rippled by a light breeze with no long waves present, the radar backscatter is due to the component of the wave spectrum which resonates with the radar wavelength.
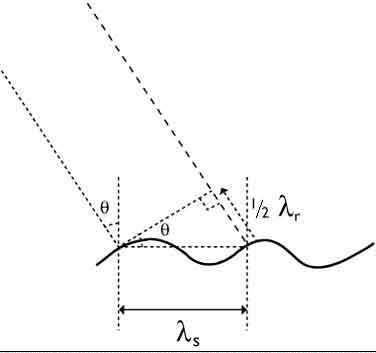
The threshold windspeed value for the C-band waves is estimated to be at about 3.25 m/s at 10 metres above the surface. The Bragg resonant wave has its crest nominally at right angles to the range direction.
For surface waves with crests at an angle θ to the radar line-of-sight (see the figure on the left) the Bragg scattering criterion is

where: λ's is the wavelength of the surface waves propagating at angle θ to the radar line- of sight.
The SAR directly images the spatial distribution of the Bragg-scale waves. The spatial distribution may be affected by longer gravity waves, through tilt modulation, hydrodynamic modulation and velocity bunching.
Moreover, variable wind speed, changes in stratification in the atmospheric boundary layer, and variable currents associated with upper ocean circulation features such as fronts, eddies, internal waves and bottom topography effect the Bragg waves.