SAR (ERS) Overview
Applications
Observations of the Earth using the SAR (Synthetic Aperture Radar) of ERS (Earth Resources Satellite) have a wide range of practical applications, including:
Oceans
Most of the man-made illegal or accidental spills are clearly visible on radar images. Ships can be detected and tracked from their wakes. Natural seepage from oil deposits can be observed, providing valuable information to the oil industry. Scientists are studying the radar backscatter from the ocean surface related to wind and current fronts, to eddies and to internal waves. In shallow waters SAR imagery allow us to infer the bottom topography. The topography of the ocean floor were mapped using the very precise ERS Altimeter, because the sea bottom relief is reflected on the surface by small variations of the sea surface height.
The ocean waves and their direction of displacement were derived from the ERS SAR sensor operated in Wave Mode. This provided input for wave forecasting and for marine climatology. At high latitudes, SAR data is very useful for regional ice monitoring. Information such as ice type and ice concentration can be derived and open leads detected, which is essential for navigation in ice-filled waters.
Land
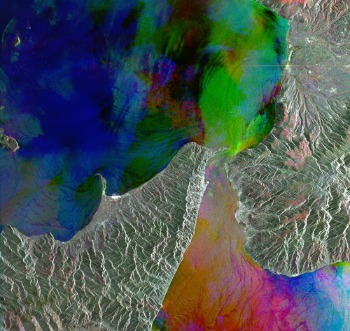
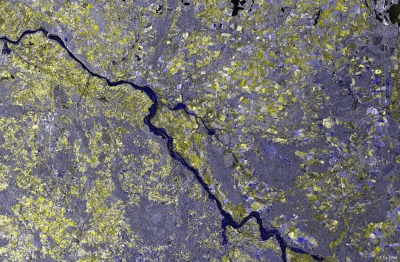
The ability of SAR to penetrate cloud cover makes it particularly valuable in frequently cloudy areas such as the tropics. Image data serve to map and monitor the use of the land, and are of gaining importance for forestry and agriculture. Geological or geomorphological features are enhanced in radar images thanks to the oblique viewing of the sensor and to its ability to penetrate, to a certain extent, the vegetation cover.
SAR data can be used to georefer other satellite imagery to high precision, and to update thematic maps more frequently and cost-effective, due to its availability independent from weather conditions. In the aftermath of a flood, the ability of SAR to penetrate clouds is extremely useful. Here SAR data can help to optimise response initiatives and to assess damages
Interferometry
An emergent technique, interferometric SAR (InSAR) can be used, under suitable conditions, to derive elevation models or to detect small surface movements, of the order of a few centimetres. These movements can be caused by earthquakes, landslides or glacier advancement. This interferometric technique was strengthened during the tandem phase of ERS-1 and -2, which lasted for about nine months (until May 1996).
Radar interferometry is a technique for extracting information about Earth's surface using the phase content of the radar signal as an additional information source derived from the full complex radar signal. Initial development of the technique was carried out during research projects using radar to map the surfaces of Venus and the Moon. The initial terrestrial applications started with airborne Side Looking (SLAR) and Synthetic Aperture (SAR) radar. With the availability of satellite borne SAR instruments, particularly the ERS platforms, considerable development of the InSAR technique has resulted.
Sensor Modes
Through ERS-1 and ERS-2's set of four radar antennae (three for the Scatterometer and one for the SAR), Earth's surface was illuminated and the backscattered energy received to produce data on wind fields and wave spectra, and to prepare high resolution images. These systems enabled three modes of operation - Image Mode, Wave Mode (both performed by the SAR) and Wind Mode (performed by the Wind Scatterometer). The combined SAR/WS operation is called the 'Active Microwave Instrument' (AMI).
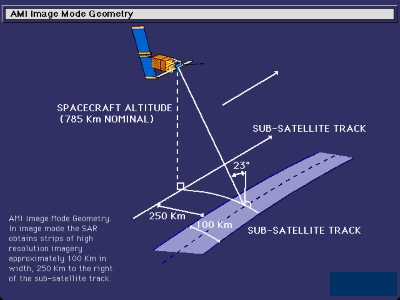
In Image Mode, the SAR obtained strips of high-resolution imagery, 100 km in width, to the right of the satellite track. The Active Microwave Instrument (AMI) - the name of the combined SAR and Wind Scatterometer operation - could only operate in one mode at a time. Therefore, operating in Image Mode prevented the operation of the other AMI modes. Power considerations limited the SAR operating time to a maximum of about 12 minutes per orbit. The data rate of 105 Mbit/second was too high to allow on-board storage, and so images were only acquired if the satellite was within range of receiving ground stations. The SAR in Image Mode and the Wind Scatterometer could not be operated in parallel, but the wind and wave modes were capable of interleaved operation - wind/wave mode.
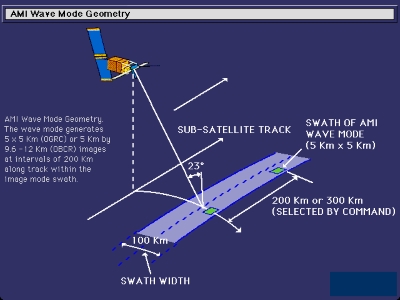
In Wave Mode, the SAR measured the ocean radar reflectivity over 5 km by 5 km imagettes at intervals of 200 km along track. The imagettes were used to provide ocean spectra, which gave information about the wavelength and direction of ocean wave systems
AMI in Wind Scatterometer Mode: Use of three separate sideways-looking antennas (fore, mid and aft beams) to measure sea surface wind speed and direction.
More information on the Image and Wave modes:
- C-band frequency: 5.30 GHz (equivalent to 5.66 cm wavelength)
- Bandwidth: 15.55 MHz
- Polarisation: transmit V, receive V
- Spatial resolution: ~30 m
Tandem Mode
See the full details of the ERS-2 acquisition plan and the various modes of operation on the ERS mission description page. The standard operational mode provided a 35 day repeat orbit. Special modes include the Tandem Mode (joint interferometric modes with ERS-2 SAR and Envisat ASAR and a three day repeat cycle at the end of the mission).
Tandem operation with Envisat occurred for:
- 1st tandem mission – September 2007 to February 2008
- 2nd tandem mission – November 2008 to April 2009
- 3rd tandem mission – February 2010 to April2010
- 4th tandem mission – July 2010 to October 2010
SAR Image Mode
In image mode the SAR provided high resolution two-dimensional images with a spatial resolution of 26 m in range (across track) and between 6 m and 30 m in azimuth (along track). Image data was acquired for a maximum duration of approximately ten minutes per orbit.
As the data rate is too high for on-board storage it was only acquired within the reception zone of a suitably equipped ground receiving station.
The main characteristics were:
| Spatial resolution: | along track <=30 m, across-track <=26.3 m |
|---|---|
| Swath width: | 102.5 km (telemetered), 80.4 km (full performance) |
| Swath standoff: | 250 km to the right of the satellite track |
| Localisation accuracy: | along track <=1 km; across-track <=0.9 km |
| Incidence angle: | near swath 20.1°. mid swath 23°. far swath 25.9° |
| Incidence angle tolerance: | <=0.5°. |
| Frequency: | 5.3 GHz (C-band) |
|---|---|
| Wave length: | 5.6 cm |
| Bandwidth: | 15.55+-0.1 MHz |
| Polarization: | VV |
| Peak sidelobe ratio: | along track >20 dB, across-track >18 dB |
| Spurious sidelobe ratio: | across-track >25 dB, along track >25 dB |
| Integrated sidelobe ratio: | >8 dB |
| Ambiguity ratio: | along track >20 dB, across-track >31 dB |
| Radiometric resolution: | <=2.5 dB at sigma-zero = -18 dB |
| Dynamic range: | >21 dB |
| Radiometric stability: | <=0.95 dB |
| Cross polarisation (one way): | >15 dB |
| Maximum operation time: | <12 minutes per orbit in total, <10 minutes per orbit on descending passes, <4 minutes per orbit in eclipse |
|---|---|
| Maximum on/off switch: | 6 per orbit |
The rectangular antenna of the SAR was aligned along the satellite's line of flight to direct a narrow beam sideways and downwards onto Earth's surface to obtain strips of high resolution imagery of about 100 km in width. Imagery was built up from the time delay and strength of the return signals, which depend primarily on the roughness and dielectric properties of the surface and its range from the satellite.
The SAR's high resolution in the range direction was achieved by phase coding the transmit pulse with a linear chirp and compressing the echo by matched filtering; range resolution being determined by means of the pulse travel time; and the azimuth esolution was achieved by recording the phase as well as the amplitude of the echoes along the flight path.
During operation, the command to generate a radar pulse was initiated by the SAR processor. A 'short pulse' signal was generated and was used as the input to a dispersive delay line (Surface Acoustic Wave (SAW) device) which produced the linear Frequency Modulated (FM), or 'chirped' pulse. This chirp signal was generated at a programmable Pulse Repetition Frequency (PRF) in the range 1640-1720 Hz and was passed to the transmitter and up-converter, where it was mixed with the local oscillator signal (5176 to 7442 MHz), produced within the Frequency Generator. The level of the RF output pulse (peak power) was controlled by the Automatic Gain Control (AGC) loop. This output was amplified by approximately 45 dB by the High-Power Amplifier sub-system before it is routed via the waveguide through the Circulator Assembly to the SAR antenna.
The echo signal received by the SAR antenna was routed via the waveguide through the Circulator Assembly to the receiver. The received radar echo was then amplified in a Low-Noise Amplifier and mixed with the local oscillator signal to provide a signal at the intermediate frequency as input to the IF Radar . The echo signal was sent to the SAR processor where it was resolved into in-phase and quadrature components. The nominal operation mode was an on-ground range compression (OGRC) of the received pulse, providing complex samples with 5 bits in-phase (I), 5 bits quadrature (Q), while an on-board range compression (OBRC) mode provided complex samples of 6 bits I, 6 bits Q. The ground processing required auxiliary data (chirp replica, noise measurement, calibration pulse), in addition to the radar echo, in order to produce the required image.
SAR Wave Mode
The SAR wave mode provided two-dimensional spectra of ocean surface waves. For this function the SAR recorded regularly spaced samples within the image swath. The images were transformed into directional spectra providing information about wavelength and direction of wave systems. Automatic measurements of dominant wavelengths and directions improve sea forecast models, but the images also show the effects of other phenomena, such as internal waves, slicks, small scale variations in wind and modulations due to surface currents and the presence of sea ice.
The idea of wave mode is that useful information can be obtained from the power spectra of ocean waves. In particular, the wavelengths and directions of swell wave systems can be measured readily from spectra. Series of spectra can be used to determine the evolution of such systems. While operating in wave mode the SAR measured the change in radar reflectivity of the sea surface due to the ocean surface waves. In this mode the system operated as a SAR (see image mode, however the wave mode differed in that the RF power and hence imaging capability were reduced.
The AMI characteristics in the wave mode were the same as those of the AMI SAR in image mode, except for the following characteristics:
- the swath width corresponds to between 9.6 km and 12 km in OBRC mode depending on position, or 5 km in OGRC , every 200 km along track
- the data rate permits global operation
- the swath position is programmable anywhere within the SAR imaging swath
- the A/D quantisation is 4 bits I, 4 bits Q, in OBRC mode, and 2 bits I, 2 bits Q, in OGRC mode
- the data can be generated in a stand-alone mode or interleaved with wind mode data
The main technical characteristics of the AMI in wave mode are listed below:
- Wave direction / length: 0-180°. (180°. ambiguity) / 100-1000 m
- Accuracy direction / length: +-20°. / +-25%
- Spatial resolution: along track <=30 m; across-track <=26.3 m
- Peak sidelobe ratio: along track >=20 dB; across-track >=18 dB
- Spurious sidelobe ratio: along track >=25 dB; across-track> =25 dB
- Integrated sidelobe ratio: >=8 dB
- Ambiguity rati (point target): along track >=25 dB; across-track> =31 dB
- Radiometric resolution: <=2.0 dB
- Dynamic range: -12 to 3 dB
- Radiometric stability: <=0.95 dB
- Cross polarisation (one way):>=15 dB
- Swath length: >=5 km
- Swath width (with OBRC): >=9.6 km (far swath); 12 km (near swath)
- Swath width (with OGRC): >=5 km
- Swath position step size: <=2.5 km
- Localisation accuracy: along track <=2 km; across-track <=1.8 km
- Incidence angle tolerance: <=0.5°
Mission Operations
Order ERS Missions: 20 Years of Observing Earth, a comprehensive report on the ERS missions, including the SAR Image and Wave modes.
Download the table of contents, foreword and introduction to the report to learn more about its contents.
SAR Resources
- Access to ESA Earth Observation Data - Quick Guide
- Sentinel-1 ESA's Radar Observatory Mission for GMES Operational Services
- Fringe 2011
- REAPER: ERS-1 and ERS-2 Orbit Validation Report
- PolInSAR 2011: 5th International Workshop on Science and Applications of SAR Polarimetry and Polarimetric Interferometry
- ERS SAR Calibration Document