- All Categories (25)
- Data (15)
- News (5)
- Missions (1)
- Events (3)
- Campaigns (1)
Event - Workshop

CEOS-IVOS Workshop on Inter-comparison of Large Scale Optical and Infrared Sensors
The 2004 workshop was an opportunity to present and exchange experiences and knowledge from work on inter-comparing large scale optical sensors at different product levels.
Event - Workshop
2nd MERIS/AATSR User Workshop
The workshop addressed the utilisation of MERIS and AATSR data for remote sensing of open oceans, coastal waters, land surfaces and atmospheric processes.
Campaign
C-MAPExp
The C‐MAPExp campaign was planned and executed to support the demonstration of CarbonSat capabilities.
Data - Fast Registration with immediate access (Open)
Envisat GOMOS Level 2 - Atmospheric constituents profiles - User Friendly Product [GOMOS_UFP]
This data product describes atmospheric constituents profiles: In particular the vertical and line density profiles of ozone, NO2, NO3, O2, H2O, air, aerosols, temperature, turbulence. Coverage is as follows: Elevation range: +62 deg to +68 deg Azimuth range: +90 deg to +190 deg (with respect to the flight direction) The GOMOS data are now also available as user friendly products in the NetCDF4-format. These products are occultation based (dark and bright) and include all GOMOS Level 2 constituent profiles (O3, NO2, NO3, O2, H2O, air and aerosols) and HRTP profiles with all the essential parameters as in the original Envisat data set format.
Data - Fast Registration with immediate access (Open)
Envisat GOMOS Geolocated Calibrated Transmission Spectra and Photometer Fluxes [GOM_TRA_1P]
This data product describes the geolocated and calibrated transmission spectra products, containing the full transmission and the covariance spectra needed for Level 2 processing. Coverage is as follows: Elevation range: +62 deg to +68 deg Azimuth range: +90 deg to +190 deg (with respect to the flight direction). The file size is 1 MB per occultation, depending on the duration of the occultation.
Data - Fast Registration with immediate access (Open)
Envisat GOMOS Level 2 - Atmospheric constituents profiles - Gridded User Friendly Product [GOMOS_UFP_gridded]
This data product describes atmospheric constituents profiles: In particular the vertical and line density profiles of ozone, NO2, NO3, O2, H2O, air, aerosols, temperature, turbulence. Coverage is as follows: Elevation range: +62° to +68° Azimuth range: +90° to +190° (with respect to the flight direction). The GOMOS data are now also available as user friendly products in the NetCDF4-format. These files are Level 2 constituent profiles and are altitude gridded. These Level 2 files include quality flags and are based and collected on a yearly basis.
Data - Fast Registration with immediate access (Open)
Envisat GOMOS Level 2 - Atmospheric constituents profiles [GOM_NL__2P]
This data product describes atmospheric constituents profiles. In particular the vertical and line density profiles of ozone, NO2, NO3, O2, H2O, air, aerosols, temperature, turbulence. Coverage is as follows: Elevation range: +62 deg to +68 deg Azimuth range: +90 deg to +190 deg (with respect to the flight direction). The file size is 1 Mbyte per occultation, depending on the duration of the occultation.
Data - Fast Registration with immediate access (Open)
Envisat GOMOS Level 1b - Limb spectra [GOM_LIM_1P]
This data product describes localised calibrated upper and lower background limb spectra (flat-field corrected, with and without stray light). Coverage is as follows: Elevation range: C25+62 deg to +68 deg Azimuth range: +90 deg to +190 deg (with respect to the flight direction). The file size is Mbytes per occultation, depending on the duration of the occultation.
Data - Fast Registration with immediate access (Open)
Envisat GOMOS Level 2 - Residual extinction [GOM_EXT_2P]
Re-computed transmission spectra corrected for scintillation and dilution effects, before and after inversion. Coverage is as follows: Elevation range: +62 deg to +68 deg Azimuth range: +90 deg to +190 deg (with respect to the flight direction). The file size is 1 Mbyte per occultation, depending on the duration of the occultation.
Data - External Data (Restrained)

SciSat-1: ACE-FTS and MAESTRO
SCISAT-1 data aim at monitoring and analysing the chemical processes that control the distribution of ozone in the upper troposphere and stratosphere. It provides acquisitions from the two instruments MAESTRO and ACE-FTS. MAESTRO: Measurement of Aerosol Extinction in the Stratosphere and Troposphere Retrieved by Occultation. Dual-channel optical spectrometer in the spectral region of 285-1030 nm. The objective is to measure ozone, nitrogen dioxide and aerosol/cloud extinction (solar occultation measurements of atmospheric attenuation during satellite sunrise and sunset with the primary objective of assessing the stratospheric ozone budget). Solar occultation spectra are being used for retrieving vertical profiles of temperature and pressure, aerosols, and trace gases (O3, NO2, H2O, OClO, and BrO) involved in middle atmosphere ozone distribution. The use of two overlapping spectrometers (280 - 550 nm, 500 - 1030 nm) improves the stray-light performance. The spectral resolution is about 1-2 nm. ACE-FTS: Fourier Transform Spectrometer. The objective is to measure the vertical distribution of atmospheric trace gases, in particular of the regional polar O3 budget, as well as pressure and temperature (derived from CO2 lines). The instrument is an adapted version of the classical sweeping Michelson interferometer, using an optimised optical layout. The ACE-FTS measurements are recorded every 2 s. This corresponds to a measurement spacing of 2-6 km which decreases at lower altitudes due to refraction. The typical altitude spacing changes with the orbital beta angle. For historical reasons, the retrieved results are interpolated onto a 1 km "grid" using a piecewise quadratic method. For ACE-FTS version 1.0, the results were reported only on the interpolated grid (every 1 km from 0.5 to 149.5 km). For versions 2.2, both the "retrieval" grid and the "1 km" grid profiles are available. SCISAT-1 collection provides ACE-FTS and MAESTRO Level 2 Data. As of today, ACE-FTS products are available in version 4.1, while MAESTRO products are available in version 3.13.
Data - Fast Registration with immediate access (Open)
Envisat SCIAMACHY Geo-located atmospheric spectra [SCI_NL__1P]
This data product covers geo-located, radiometrically and spectrally calibrated limb and nadir radiance spectra for Nadir, Limb, and Occultation measurements with additional monitoring and calibration measurements. The Level 1b product is the lowest level of SCIAMACHY data delivered to the users. The instrument Instantaneous Field of View (IFoV) is approximately 0.045 deg (scan direction) x 1.8 deg (flight direction). This corresponds to a ground pixel size of 25 km x 0.6 km at the sub-satellite point (nadir) and of 103 km x 2.6 km at the Earth's horizon (limb). Nadir measurements have a maximum swath width of 960 km (in scan direction) and a typical footprint of 30 km (along track) x 60 km (across track). Limb measurements have a tangent height range spanning from 0 to 100 km with 3 km vertical resolution. Azimuth scans are performed for constant elevation angle, typically 34 elevation steps per limb scan. Maximum azimuth range is +/- 44 deg relative to S/C velocity (Note that the azimuth range is adjusted to observe the same atmospheric volume as for nadir measurements within five minutes). The radiometric resolution is 16 bits, with a spectral resolution of 0.24 nm to 1.5 nm, depending on the spectral range. The Sun normalized radiometric accuracy is 2 to 3% in unpolarized light, and 3 to 4% in polarized light. The relative radiometric accuracy is less than 1% and the spectral accuracy spans form 0.005 nm to 0.035 nm. Individual measurements from dedicated monitoring states include: Sun over diffuser Subsolar calibration Spectral lamp measurements White light source measurements Elevation mirror monitoring (Sun/Moon) ADC calibration Level 1b products are corrected for degradation applying a scan mirror model and m-factors. The latest Level 1b dataset is version 8.0X.
Data - Fast Registration with immediate access (Open)
Envisat SCIAMACHY Total column densities and stratospheric profiles [SCI_OL__2P]
The data product provides global column distributions and stratospheric profiles of various trace gases. Total column densities of O3, NO2, OClO, H2O, SO2, BrO, CO, HCHO, CHOCHO and CH4 are retrieved from Nadir measurements. Additional cloud parameters (fractional cloud coverage, cloud-top height, cloud optical thickness) and an aerosol absorption indicator are enclosed. Stratospheric profiles of O3, NO2, and BrO are derived from limb measurements and with flagging information for cloud-types. Tropospheric NO2 columns are retrieved combining limb and nadir measurements. The latest Level 2 dataset is Version 6.01.
Data - EO Sign In Authentication (Open)
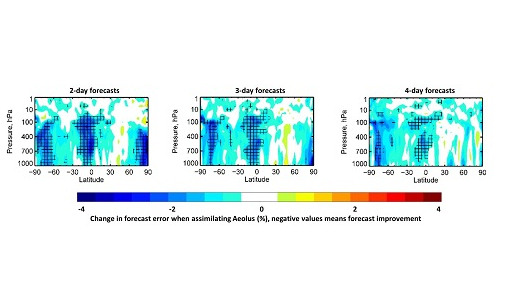
Aeolus preliminary HLOS (horizontal line-of-sight) wind observations for Rayleigh and Mie receivers
The Level 1B wind product of the Aeolus mission contains the preliminary HLOS (horizontal line-of-sight) wind observations for Rayleigh and Mie receivers, which are generated in Near Real Time. Standard atmospheric correction (Rayleigh channel), receiver response and bias correction is applied. The product is generated within 3 hours after data acquisition.
Data - EO Sign In Authentication (Open)
Aeolus Scientific L2B Rayleigh/Mie wind product
The Level 2B wind product of the Aeolus mission is a geo-located consolidated HLOS (horizontal line-of-sight) wind observation with actual atmospheric correction applied to Rayleigh channel. The product is generated within 3 hours after data acquisition.
Event - Workshop
CEOS-WGCV ACIX II CMIX Atmospheric Correction Inter-comparison Exercise Cloud Masking Inter-comparison Exercise 2nd workshop
The CEOS-WGCV ACIX II 2nd workshop took place at Esrin, Rome in Italy from 3 December - 5 December 2019.
Data - Project Proposal (Restrained)
GHGSat archive and tasking
GHGSat data produce measures of vertical column densities of greenhouse gas emissions ((currently CH4, but eventually CO2), provided on a pre-defined area of 12 km x 12 km, from the full sensor field-of-view. GHGSat Catalogue and New Collect data are available in three different data types: Single Observation: a single observation of a scene. Monthly Monitoring: guaranteed 12 successful observations in a year over a given site (once per month or flexible best effort cadence depending on weather). Weekly Monitoring: guaranteed 52 successful observations in a year over a given site (once a week or flexible best effort cadence based on weather), to accommodate large & persistent monitoring needs. Data are provided as an Emissions package containing the following products: Abundance dataset (Level 2): Set of per-pixel abundances in excess of the local background (ppb) for a single species, and per-pixel measurement error expressed as a standard deviation for a single site on a single satellite pass. Data format is 16-bit GeoTIFF. Concentration Maps (Level 2): High readability pseudocolour map combining surface reflectance, and column density expressed in ppb for a single species in PNG format. The relevant abundance dataset is provided as well. Emission Rates (Level 4): Instantaneous rate for a detected emission from a targeted source estimated using abundance datasets from a single satellite pass and applying dispersion modelling techniques. The delivered product includes the emission rate estimate with uncertainty and key dispersion parameters (in CSV format) as well as the abundance dataset used for the emission estimate. This product is only delivered in the Emissions package if an emission is detected within the abundance dataset. The Level 2 products will be delivered regardless of whether or not an emission is detected. The properties of available products are summarised in the table. Band(s) / Beam Mode(s) and Polarisation SWIR (1635-1675 nm), multiple bands, unpolarised Spatial Resolution <30 m Scene size 12 km x 12 km Species Measured CH4 Geometric Corrections Radial distortion, perspective projection Radiometric Corrections Detector pixel response, ghosting, spectral response, atmospheric correction including trace gas modelling and surface reflectance Details about the data provision, data access conditions and quota assignment procedure are described in the GHGSat Terms of Applicability.
Mission - Third Party Missions
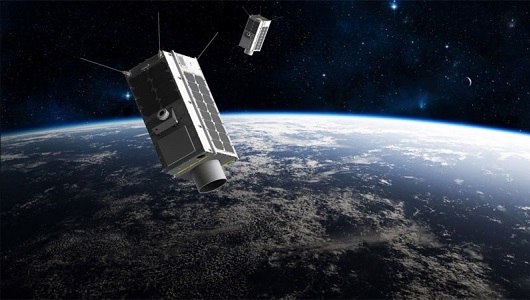
GHGSat
The GHGSat mission is dedicated to measuring emissions of greenhouse gases.
Data - EO Sign In Authentication (Open)
Aeolus L2A Aerosol/Cloud optical product
The Level 2A aerosol/cloud optical products of the Aeolus mission include: Geo-located consolidated backscatter and extinction profiles Backscatter-to-extinction coefficient LIDAR ratio, scene classification Heterogeneity index Attenuated backscatter signals. Resolution: Horizontal resolution of L2A optical properties at observation scale (~87 km); Exceptions are group properties (horizontal accumulation of measurements from ~3 km to ~87 km) and attenuated backscatters (~3 km). Note: The resolution of "groups" in the L2A can only go down to 5 measurements at the moment, i.e. ~15 km horizontal resolution. This could be configured to go to 1 measurement - Vertical resolution 250-2000 m (Defined by Range Bin Settings).
News - Thematic area articles
Space data help to unravel the complexities of Earth’s atmosphere
As the impacts of the climate crisis intensify, scientists are using ESA’s Earth observation archives to investigate atmospheric processes and their influences on the planet’s changing environment.
News - Infographics
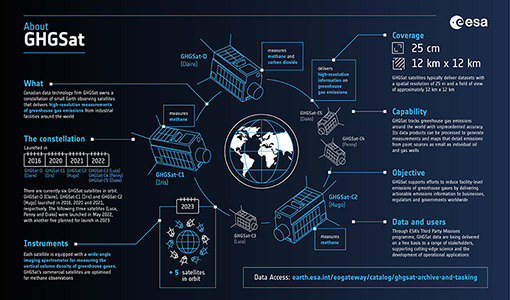
Greenhouse gas monitoring with the GHGSat mission
Find out more about the GHGsat mission in our new infographic.