- All Categories (34)
- Data (7)
- News (9)
- Missions (3)
- Events (7)
- Tools (1)
- Activities (4)
- Campaigns (2)
- Documents (1)
News - Events and Proceedings

Φ-Week Triumphs
In its fourth edition, Φ-Week presented the scientific community with amazing opportunities and projects—thus running alongside innovation at 360 degrees.
Event - Conference

User Consultation for Infrastructures Planning and Monitoring Conference 2019
ESA hosted a joint DLR/ESA user consultation for infrastructures planning and monitoring conference on 26 and 27 February 2019.
Event - Workshop
URBIS24
URBan Insights from Space (URBIS24) Workshop will offer an insightful exploration of urban challenges and innovative EO-integrated solutions.
Data - External Data (Restrained)

SciSat-1: ACE-FTS and MAESTRO
SCISAT-1 data aim at monitoring and analysing the chemical processes that control the distribution of ozone in the upper troposphere and stratosphere. It provides acquisitions from the two instruments MAESTRO and ACE-FTS. MAESTRO: Measurement of Aerosol Extinction in the Stratosphere and Troposphere Retrieved by Occultation. Dual-channel optical spectrometer in the spectral region of 285-1030 nm. The objective is to measure ozone, nitrogen dioxide and aerosol/cloud extinction (solar occultation measurements of atmospheric attenuation during satellite sunrise and sunset with the primary objective of assessing the stratospheric ozone budget). Solar occultation spectra are being used for retrieving vertical profiles of temperature and pressure, aerosols, and trace gases (O3, NO2, H2O, OClO, and BrO) involved in middle atmosphere ozone distribution. The use of two overlapping spectrometers (280 - 550 nm, 500 - 1030 nm) improves the stray-light performance. The spectral resolution is about 1-2 nm. ACE-FTS: Fourier Transform Spectrometer. The objective is to measure the vertical distribution of atmospheric trace gases, in particular of the regional polar O3 budget, as well as pressure and temperature (derived from CO2 lines). The instrument is an adapted version of the classical sweeping Michelson interferometer, using an optimised optical layout. The ACE-FTS measurements are recorded every 2 s. This corresponds to a measurement spacing of 2-6 km which decreases at lower altitudes due to refraction. The typical altitude spacing changes with the orbital beta angle. For historical reasons, the retrieved results are interpolated onto a 1 km "grid" using a piecewise quadratic method. For ACE-FTS version 1.0, the results were reported only on the interpolated grid (every 1 km from 0.5 to 149.5 km). For versions 2.2, both the "retrieval" grid and the "1 km" grid profiles are available. SCISAT-1 collection provides ACE-FTS and MAESTRO Level 2 Data. As of today, ACE-FTS products are available in version 4.1, while MAESTRO products are available in version 3.13.
News - Success Stories
Rome supersite helps validate atmospheric space data
In the sprawling, urban area of Rome, where atmospheric composition is impacted by complex coastal weather and pollution, ESA supports a powerful observatory spread across several locations.
News - Data Release news
PROBA-V ‘Collection 2’ - Reprocessed Dataset available
The improved PROBA-V data (Collection 2) has been released. Data is available via the PROBA-V MEP and Terrascope platforms so users can freely exploit the data using Virtual machines, Jupyter Notebooks, and the new viewing application.
News - Success Stories
PROBA-V data improve surface albedo products in Africa
As ESA’s PROBA-V satellite marks its 10-year launch milestone, data tasked during the mission’s lifetime are still being used to assess changes in land cover.
Event - Meeting

Proba-V Cloud Detection Round Robin Meeting
A Round Robin exercise aimed at the inter-comparison of different cloud detection algorithms for Proba-V has been organised by the European Space Agency (ESA) and the Belgian Science Policy Office (BELSPO).
Data - External Data (Restrained)
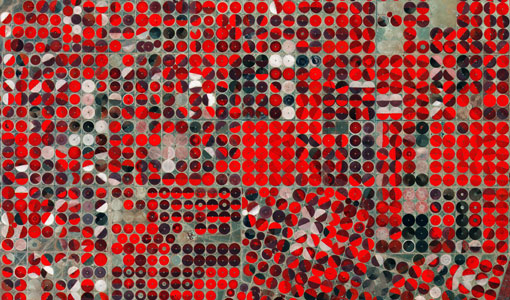
PROBA-V 1 km, 333 m, and 100 m products
The PROBA-V VEGETATION Raw products and Synthesis products provided coverage of all significant landmasses worldwide with, in the case of a 10-day synthesis product, a minimum effect of cloud cover, resulting from selection of cloud-free acquisitions during the 10-day period. It provided a daily coverage between Latitudes 35°N and 75°N, and between 35°S and 56°S, and a full coverage every two days at the equator. The VEGETATION instrument was pre-programmed with an indefinite repeated sequence of acquisitions. This nominal acquisition scenario allowed a continuous series of identical products to be generated, with the goal to map land cover and vegetation growth across the entire planet every two days. Level Synthesis Resolution resolution (m) Reflectance Level-1C n/a TOA Level-2A n/a 100 m TOA 333 m TOA 1 km TOA Level-3 S1 100 m TOA TOC TOC NDVI 333 m TOA TOC 1 km TOA TOC S5 100 m TOA TOC TOC NDVI S10 333 m TOC TOC NDVI 1 km TOC TOC NDVI Raw Products Overview Product Description Level-1C Level-1C segments (P – product): Radiometrically corrected Level-1B data, in raw sensor geometry (unprojected) Contains: - Top Of Atmosphere reflectance in the four spectral bands - Longitude/latitude information for every pixel - Geometric viewing conditions - Information on the status map (indicating missing and interpolated measurements). Format: HDF5 & GeoTiFF Level-2A Level-2A segment: projected Level-1C (P–product) data, radiometrically and geometrically corrected. Contains: - TOA reflectance values in the four spectral bands without atmospheric correction being performed - Information on the status map (containing identification of radiometric quality, snow, ice, shadow, clouds, land/sea for every pixel) - Geometric viewing conditions Plate carrée projection (EPSG:4326) with spatial resolution of 100 m, 333 m and 1 km Format: HDF5 & GeoTiFF Synthesis Products Overview Level-3 S1 = daily, S5 = 5 days, S10 = decade Different spatial resolution: 100 m, 333 m and 1 km Divided into so called granules, each measuring 10 degrees x 10 degrees, each granule being delivered as a single file Plate carrée projection (EPSG:4326) Format: HDF5 & GeoTiFF Products Content TOA - Top Of Atmosphere reflectance in the four spectral bands (no atmospheric correction applied) - Normalized Difference Vegetation Index (NDVI) -Information on the composite status map (containing identification of snow, ice, shadow, clouds, land/sea for every pixel) - Geometric viewing conditions & date and time of selected measurement TOC Level-2A segment: projected Level-1C (P–product) data, radiometrically and geometrically corrected. Contains: - Top Of Canopy (ground surface) reflectance in the four spectral bands, the atmospheric correction being performed using the SMAC (Simplified Method for Atmospheric Corrections) algorithm - Normalized Difference Vegetation Index (NDVI) - Information on the composite status map (containing identification of snow, ice, shadow, clouds, land/sea for every pixel) Normalized Difference Vegetation Index (NDVI) from Top Of Canopy product (SMAC algorithm for atmospheric corrections applied) - Geometric viewing conditions & date and time of selected measurement TOC NDVI Normalized Difference Vegetation Index (NDVI) from Top Of Canopy product (SMAC algorithm for atmospheric corrections applied)
Mission - Earth Watch
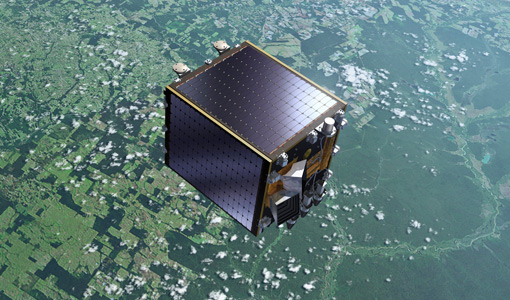
PROBA-V
The PROBA-V mission provides multispectral images to study the evolution of the vegetation cover on a daily and global basis.
Document - Campaign Report

Photosynthetic-Proxy Experiment Final Report
This report summarises the PhotoProxy 2019 campaign.
News - Infographics
Overview of the Aeolus Level-1B wind product
Learn about the Aeolus Level-1B wind product, which supports applications for the weather, atmospheric processes and climate research, in our latest infographic.
News - Data Release news
New FLEX-related campaign datasets released
New datasets have been released for three campaigns, covering activities supporting the upcoming FLEX mission.
Activity - General activities
MUltisource data package tools and SErvices (MUSE)
The MUSE project aims to develop and integrate a tool to simultaneously manipulate geospatial data products, satellite, model and in-situ data.
News - General News
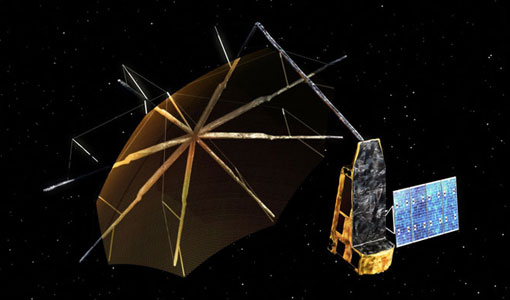
Introducing the Newest ESA Third Party Missions
ESA's Earth Observation Programme Board has unanimously approved the integration of the Federated Satellite Systems (FSSCat) mission, the Geostationary Environment Monitoring Spectrometer (GEMS) instrument on-board the GEO-KOMPSAT-2B satellite and the Gravity Recovery and Climate Experiment Follow-On (GRACE-FO) mission, as Third Party Missions.
Data - Project Proposal (Restrained)
GHGSat archive and tasking
GHGSat data produce measures of vertical column densities of greenhouse gas emissions ((currently CH4, but eventually CO2), provided on a pre-defined area of 12 km x 12 km, from the full sensor field-of-view. GHGSat Catalogue and New Collect data are available in three different data types: Single Observation: a single observation of a scene. Monthly Monitoring: guaranteed 12 successful observations in a year over a given site (once per month or flexible best effort cadence depending on weather). Weekly Monitoring: guaranteed 52 successful observations in a year over a given site (once a week or flexible best effort cadence based on weather), to accommodate large & persistent monitoring needs. Data are provided as an Emissions package containing the following products: Abundance dataset (Level 2): Set of per-pixel abundances in excess of the local background (ppb) for a single species, and per-pixel measurement error expressed as a standard deviation for a single site on a single satellite pass. Data format is 16-bit GeoTIFF. Concentration Maps (Level 2): High readability pseudocolour map combining surface reflectance, and column density expressed in ppb for a single species in PNG format. The relevant abundance dataset is provided as well. Emission Rates (Level 4): Instantaneous rate for a detected emission from a targeted source estimated using abundance datasets from a single satellite pass and applying dispersion modelling techniques. The delivered product includes the emission rate estimate with uncertainty and key dispersion parameters (in CSV format) as well as the abundance dataset used for the emission estimate. This product is only delivered in the Emissions package if an emission is detected within the abundance dataset. The Level 2 products will be delivered regardless of whether or not an emission is detected. The properties of available products are summarised in the table. Band(s) / Beam Mode(s) and Polarisation SWIR (1635-1675 nm), multiple bands, unpolarised Spatial Resolution <30 m Scene size 12 km x 12 km Species Measured CH4 Geometric Corrections Radial distortion, perspective projection Radiometric Corrections Detector pixel response, ghosting, spectral response, atmospheric correction including trace gas modelling and surface reflectance Details about the data provision, data access conditions and quota assignment procedure are described in the GHGSat Terms of Applicability.
Tools - Other
Food Security TEP
The Food Security Thematic Exploitation Platform (TEP) enables access, processing, uploading, visualisation, manipulation and comparison of data related to food security.
Event - Meeting
Fluorescence (FLEX) 2019
The FLEX 2019 meeting consisted of a series of events addressing remote sensing of vegetation fluorescence.
Activity - General activities
EO Summer Schools
ESA's series of summer schools, on Monitoring of the Earth System, aims to promote the exploitation of Earth observation (EO) data.
Event - Training

EO Summer School 8
ESA's series of summer schools, on Monitoring of the Earth System, aims to promote the exploitation of Earth observation data.