- All Categories (44)
- Data (12)
- News (7)
- Missions (2)
- Events (18)
- Tools (1)
- Campaigns (2)
- Documents (2)
News - Success Stories
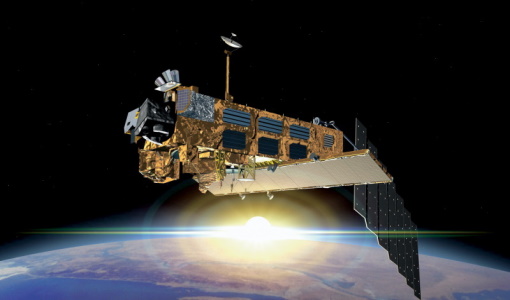
10 years of Envisat data help to illuminate ocean processes
A decade after Envisat beamed its final image to the planet, the pioneering ESA mission is continuing to foster improved understanding of Earth’s systems.
Event - Conference

15 Years of Progress in Radar Altimetry Symposium
A Symposium on "15 Years of Progress in Radar Altimetry" and the annual meeting of the Ocean Surface Topography Science Team, the International Doris Service Workshop and the ARGO Workshop.
Event - Meeting

20th GHRSST Science Team Meeting
The 20th GHRSST International Science Team meeting in 2019 brought together sea surface temperature experts to look at future innovations.
Event - Training

2nd Advanced Training Course on Ocean Remote Sensing 2009
This advanced training course focused on ocean remote sensing theory and applications.
Event - Workshop

2nd International GOCE User Workshop
This workshop provided a forum for presenting progress on the development of the GOCE mission's payload, ground segment and data products.
Event - Conference
3rd ERS Symposium
The ESA Directorate for Observation of the Earth and its Environment held the 3rd ERS Symposium, in 1997, where many of the results from the ERS-1 and ERS-2 missions were presented and discussed by the scientific community.
Document - Technical Note

AATSR-Latitude-Dependent-Bias-Correction.pdf
This document contains calibration information for the Sea Surface Temperature readings from the AATSR instrument on Envisat.
Event - Training
Advanced Ocean Synergy Training Course
This ESA course was devoted to training the next generation of Earth Observation scientists to exploit data from ESA and Third Party Mission instruments for ocean science and application development.
Event - Training
Advanced Training Course on Ocean Remote Sensing 2006
The objective of the course was to provide first-hand information on a broad range of ocean research topics including key principles of SAR, Radar Altimetry, Ocean Colour and Sea Surface Temperature measurements, processing algorithms, data products and their use in oceanographic applications.
Data - Announcement of Opportunity (Restrained)
Announcement of Opportunity for NoR
ESA invites submissions for the Network of Resources (NoR) call, which aims to support research, development and pre-commercial users to innovate their working practices, moving from a data download paradigm towards a 'bring the user to the data' paradigm.
Event - Workshop
Applications of the ERS Along Track Scanning Radiometer Workshop 1999
The workshop on ERS mission's Along Track Scanning Radiometer (ATSR) instrument gathered researchers and specialists working on different applications of the mission.
Data - EO Sign In Authentication (Open)
AVHRR Level-1B Local Area Coverage Imagery
This collection is composed of AVHRR L1B products (1.1 km) reprocessed from the NOAA POES and Metop AVHRR sensors data acquired at the University of Dundee and University of Bern ground stations and from the ESA and University of Bern data historical archive. The product format is the NOAA AVHRR Level 1B that combines the AVHRR data from the HRPT stream with ancillary information like Earth location and calibration data which can be applied by the user. Other appended parameters are time codes, quality indicators, solar and satellite angles and telemetry. Two data collections cover Europe and the neighbouring regions in the period of 1 January 1981 to 31 December 2020 and the acquired data in the context of the 1-KM project in the ‘90s. During the early 1990’s various groups, including the International Geosphere-Biosphere Programme (IGBP), the Commission of the European Communities (CEC), the Moderate Resolution Imaging Spectrometer (MODIS) Science Team and ESA concluded that a global land 1 KM AVHRR data set would have been crucial to study and develop algorithms for several land products for the Earth Observing System. USGS, NOAA, ESA and other non-U.S. AVHRR receiving stations endorsed the initiative to collect a global land 1-km multi-temporal AVHRR data set over all land surfaces using NOAA's TIROS "afternoon" polar-orbiting satellite. On 1 April 1992, the project officially began up to the end of 1999 with the utilisation of 23 stations worldwide plus the NOAA local area coverage (LAC) on-board recorders. The global land 1-km AVHRR dataset is composed of 5 channels, raw AVHRR dataset at 1.1 km resolution from the NOAA-11 and NOAA-14 satellites covering land surfaces, inland water and coastal areas. Global Land 1 km AVHRR Data Set Project HRPT Ground Station Network (as of 1 April 1992) and Acquisition Areas for LAC Recorded Data Spatial coverage: Check the spatial coverage of the collection on a map available on the Third Party Missions Dissemination Service: AVHRR L1B 1.1 KM AVHRR L1B LAC Out-of-Europe.
Event - Workshop
CEOS-IVOS Workshop on Inter-comparison of Large Scale Optical and Infrared Sensors
The 2004 workshop was an opportunity to present and exchange experiences and knowledge from work on inter-comparing large scale optical sensors at different product levels.
Event - Workshop
Coastal and Marine Applications of SAR Workshop 2003
The second in the Coastal and Marine Applications of SAR Workshop series covered a range of topics on applications of synthetic aperture radar (SAR) in coastal and marine environments.
News - Data Release news
Complete CryoSat Ice Baseline D reprocessed dataset now available
We're pleased to inform the CryoSat scientific community that the full reprocessed CryoSat Ice Baseline D data are now available on the Science Server for download
Campaign
CoSMOS 2005, 2007, 2008, 2010
The Campaign for Validating the Operation of SMOS (coSMOS) was designed to acquire SMOS-like data so that the algorithms were fine-tuned and properly validated before the launch of SMOS mission in 2007.
Campaign
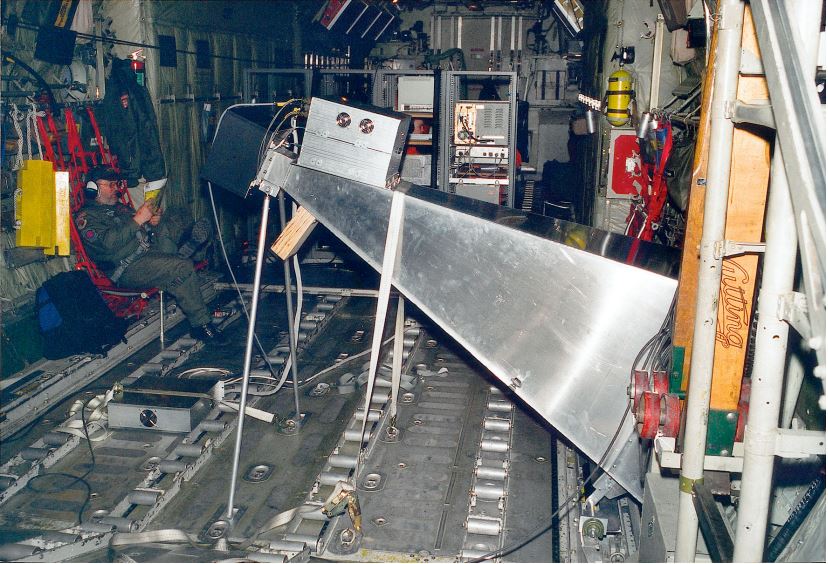
CoSMOS 2006
ESA conducted an airborne campaign to map sea surface salinity named "CoSMOS-OS" that took place in April 2006 over the Norway Sea off the coast of Stavenger.
Data - EO Sign In Authentication (Open)
Envisat AATSR L1B Brightness Temperature/Radiance [ENV_AT_1_RBT]
- AATSR Full Resolution land and ocean cover image of the Iberian Peninsula from 28 October 2006 AATSR Full Resolution land cover image of the Iberian Peninsula from 28 October 2006. The Envisat AATSR Level 1B Brightness Temperature/Radiance product (RBT) contains top of atmosphere (TOA) brightness temperature (BT) values for the infra-red channels and radiance values for the visible channels, on a 1-km pixel grid. Values for each channel and for the nadir and oblique views occupy separate NetCDF files within the Sentinel-SAFE format, along with associated uncertainty estimates. Additional files contain cloud flags, land and water masks, and confidence flags for each image pixel, as well as instrument and ancillary meteorological information. This AATSR product [ENV_AT_1_RBT] in NetCDF format stemming from the 4th AATSR reprocessing, is a continuation of ERS ATSR data and a precursor of Sentinel-3 SLSTR data. It has replaced the former L1B product [ATS_TOA_1P] in Envisat format from the 3rd reprocessing. Users with Envisat-format products are recommended to move to the new Sentinel-SAFE like/NetCDF format products. The 4th reprocessing of Envisat AATSR data was completed in 2022; the processing updates that have been put in place and the expected scientific improvements have been outlined in full in the User Documentation for (A)ATSR 4th Reprocessing Products.
Data - Fast Registration with immediate access (Open)
Envisat ASAR Wave Imagette Cross Spectra L1 [ASA_WVS_1P]
The ASAR Wave product is extracted from the combined SLC and Cross Spectra product, ASA_WVI_1P, which is generated from data collected when the instrument was in Wave Mode using the Cross Spectra methodology. The product is meant for Meteo users. The spatial coverage is up to 20 spectra acquired every 100 km, with a minimum coverage of 5km x 5km. The file size has a maximum of 0.2 Mbytes. Auxiliary data include Orbit state vector, Time correlation parameters, Wave Processing parameters ADS, Wave Geolocation ADS, SQ ADS. The product provides a continuation of the ERS-SAR wave mode data. Output: Wavelength range from 20 to 1000 m in 24 logarithmic steps.
Data - EO Sign In Authentication (Open)
Envisat MERIS Full Resolution - Level 1 [MER_FRS_1P/ME_1_FRG]
The MERIS Level 1 Full Resolution (FR) product contains the Top of Atmosphere (TOA) upwelling spectral radiance measurements. The in-band reference irradiances for the 15 MERIS bands are computed by averaging the in-band solar irradiance of each pixel. The in-band solar irradiance of each pixel is computed by integrating the reference solar spectrum with the band-pass of each pixel. The MERIS FR Level 1 product has Sentinel 3-like format starting from the 4th reprocessing data released to users in July 2020. Each measurement and annotation data file is in NetCDF 4. The Level 1 product is composed of 22 data files: 15 files containing radiances at each band (one band per file), accompanied by the associated error estimates, and 7 annotation data files. The 15 sun spectral flux values provided in the instrument data file of the Level 1 products are the in-band reference irradiances adjusted for the Earth-sun distance at the time of measurement. The band-pass of each pixel is derived from on-ground and in-flight characterisation via an instrument model. The values "Band wavelength" and "Bandwidth" provided in the Manifest file of the Level 1b products are the averaged band-pass of each pixel over the instrument field of view. Auxiliary data are also listed in the Manifest file associated to each product. The Level 1 FR product covers the complete instrument swath. The product duration is not fixed and it can span up to the time interval of the input Level 0 (for a maximum of 20 minutes). Thus the estimated size of the Level 1 FR is dependent on the start/stop time of the acquired segment. During the Envisat mission, acquisition of MERIS Full Resolution data was subject to dedicated planning based on on-demand ordering and coverage of specific areas according to operational recommendations and considerations. See yearly and global density maps to get a better overview of the MERIS FR coverage.