- All Categories (30)
- Data (11)
- News (7)
- Missions (2)
- Events (3)
- Activities (4)
- Campaigns (2)
- Documents (1)
Event - Conference

User Consultation for Infrastructures Planning and Monitoring Conference 2019
ESA hosted a joint DLR/ESA user consultation for infrastructures planning and monitoring conference on 26 and 27 February 2019.
Event - Workshop
URBIS24
URBan Insights from Space (URBIS24) Workshop will offer an insightful exploration of urban challenges and innovative EO-integrated solutions.
Data - External Data (Restrained)

SciSat-1: ACE-FTS and MAESTRO
SCISAT-1 data aim at monitoring and analysing the chemical processes that control the distribution of ozone in the upper troposphere and stratosphere. It provides acquisitions from the two instruments MAESTRO and ACE-FTS. MAESTRO: Measurement of Aerosol Extinction in the Stratosphere and Troposphere Retrieved by Occultation. Dual-channel optical spectrometer in the spectral region of 285-1030 nm. The objective is to measure ozone, nitrogen dioxide and aerosol/cloud extinction (solar occultation measurements of atmospheric attenuation during satellite sunrise and sunset with the primary objective of assessing the stratospheric ozone budget). Solar occultation spectra are being used for retrieving vertical profiles of temperature and pressure, aerosols, and trace gases (O3, NO2, H2O, OClO, and BrO) involved in middle atmosphere ozone distribution. The use of two overlapping spectrometers (280 - 550 nm, 500 - 1030 nm) improves the stray-light performance. The spectral resolution is about 1-2 nm. ACE-FTS: Fourier Transform Spectrometer. The objective is to measure the vertical distribution of atmospheric trace gases, in particular of the regional polar O3 budget, as well as pressure and temperature (derived from CO2 lines). The instrument is an adapted version of the classical sweeping Michelson interferometer, using an optimised optical layout. The ACE-FTS measurements are recorded every 2 s. This corresponds to a measurement spacing of 2-6 km which decreases at lower altitudes due to refraction. The typical altitude spacing changes with the orbital beta angle. For historical reasons, the retrieved results are interpolated onto a 1 km "grid" using a piecewise quadratic method. For ACE-FTS version 1.0, the results were reported only on the interpolated grid (every 1 km from 0.5 to 149.5 km). For versions 2.2, both the "retrieval" grid and the "1 km" grid profiles are available. SCISAT-1 collection provides ACE-FTS and MAESTRO Level 2 Data. As of today, ACE-FTS products are available in version 4.1, while MAESTRO products are available in version 3.13.
News - Events and Proceedings
Scientists to showcase value of Earth observation data at EGU
Remote sensing scientists are getting ready to present innovative and exciting applications of satellite data at the European Geosciences Union general assembly which will take place from 24 to 28 April in Vienna, Austria.
News - Success Stories
Rome supersite helps validate atmospheric space data
In the sprawling, urban area of Rome, where atmospheric composition is impacted by complex coastal weather and pollution, ESA supports a powerful observatory spread across several locations.
Document - Campaign Report

Photosynthetic-Proxy Experiment Final Report
This report summarises the PhotoProxy 2019 campaign.
News - Infographics
Overview of the Aeolus Level-1B wind product
Learn about the Aeolus Level-1B wind product, which supports applications for the weather, atmospheric processes and climate research, in our latest infographic.
Mission - Heritage Missions

NOAA POES
NOAA's AVHRR sensor is carried on the POES mission, a constellation of polar orbiting weather satellites.
Activity - General activities
MUltisource data package tools and SErvices (MUSE)
The MUSE project aims to develop and integrate a tool to simultaneously manipulate geospatial data products, satellite, model and in-situ data.
News - General News
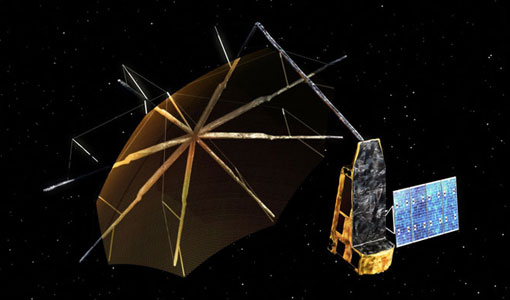
Introducing the Newest ESA Third Party Missions
ESA's Earth Observation Programme Board has unanimously approved the integration of the Federated Satellite Systems (FSSCat) mission, the Geostationary Environment Monitoring Spectrometer (GEMS) instrument on-board the GEO-KOMPSAT-2B satellite and the Gravity Recovery and Climate Experiment Follow-On (GRACE-FO) mission, as Third Party Missions.
News - Success Stories
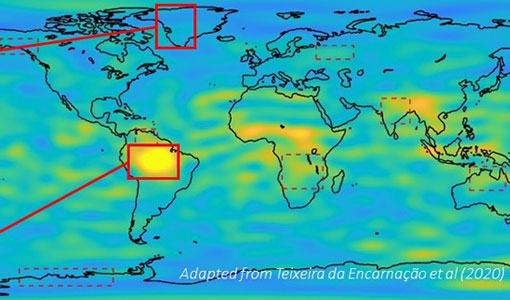
Gravity Field Models from Swarm data
In addition to its geomagnetic objectives, GPS receivers onboard Swarm can and have already been exploited to measure temporal variations in Earth's global gravity field.
Data - Project Proposal (Restrained)
GHGSat archive and tasking
GHGSat data produce measures of vertical column densities of greenhouse gas emissions ((currently CH4, but eventually CO2), provided on a pre-defined area of 12 km x 12 km, from the full sensor field-of-view. GHGSat Catalogue and New Collect data are available in three different data types: Single Observation: a single observation of a scene. Monthly Monitoring: guaranteed 12 successful observations in a year over a given site (once per month or flexible best effort cadence depending on weather). Weekly Monitoring: guaranteed 52 successful observations in a year over a given site (once a week or flexible best effort cadence based on weather), to accommodate large & persistent monitoring needs. Data are provided as an Emissions package containing the following products: Abundance dataset (Level 2): Set of per-pixel abundances in excess of the local background (ppb) for a single species, and per-pixel measurement error expressed as a standard deviation for a single site on a single satellite pass. Data format is 16-bit GeoTIFF. Concentration Maps (Level 2): High readability pseudocolour map combining surface reflectance, and column density expressed in ppb for a single species in PNG format. The relevant abundance dataset is provided as well. Emission Rates (Level 4): Instantaneous rate for a detected emission from a targeted source estimated using abundance datasets from a single satellite pass and applying dispersion modelling techniques. The delivered product includes the emission rate estimate with uncertainty and key dispersion parameters (in CSV format) as well as the abundance dataset used for the emission estimate. This product is only delivered in the Emissions package if an emission is detected within the abundance dataset. The Level 2 products will be delivered regardless of whether or not an emission is detected. The properties of available products are summarised in the table. Band(s) / Beam Mode(s) and Polarisation SWIR (1635-1675 nm), multiple bands, unpolarised Spatial Resolution <30 m Scene size 12 km x 12 km Species Measured CH4 Geometric Corrections Radial distortion, perspective projection Radiometric Corrections Detector pixel response, ghosting, spectral response, atmospheric correction including trace gas modelling and surface reflectance Details about the data provision, data access conditions and quota assignment procedure are described in the GHGSat Terms of Applicability.
Data - Fast Registration with approval (Restrained)
ERS-1/2 ATSR Gridded Surface Temperature [AT1/AT2_NR__2P]
The Gridded Surface Temperature (GST) Product is the Level 2 full resolution geophysical product. The product contains gridded sea-surface temperature images using both nadir and dual view retrieval algorithms. The product includes pixel latitude/longitude positions, X/Y offset and the results of the cloud-clearing/land-flagging. It contains a single measurement data set the content of which is switchable, that is to say, the content of each pixel field will depend on the surface type. Specifically, the contents of the data fields will depend on the setting of the forward and nadir cloud flags and the land flag. The 3rd reprocessing of ATSR data was performed in 2013; the processing updates that have been put in place and the scientific improvements are outlined in full in the User Summary Note for the Third ERS ATSR Reprocessing.
Data - Fast Registration with approval (Restrained)
ERS-1/2 ATSR Gridded Brightness Temperature/Reflectance [AT1/AT2_TOA_1P]
The Gridded Brightness Temperature/Reflectance (GBTR) product contains top of atmosphere (TOA) brightness temperature (BT) values for the infra-red channels and reflectance values for the visible channels. Values for each channel and for the nadir and forward views occupy separate measurement data sets. Additional MDS contain cloud and land/sea flags and confidence flags for each image pixel. The 3rd reprocessing of ATSR data was performed in 2013; the processing updates that have been put in place and the scientific improvements are outlined in full in the User Summary Note for the Third ERS ATSR Reprocessing.
Data - Fast Registration with approval (Restrained)
ERS-1/2 ATSR Averaged Surface Temperature [AT1/AT2_AR__2P]
The Averaged Surface Temperature Product (AST) contains averaged geophysical data at two different resolutions, and with respect to two different averaging schemes: measurement data sets at resolutions of 0.5 by 0.5 degrees and 10 by 10 arcmin with respect to a latitude/longitude grid; other data sets contain data averaged over equal area cells of 50 by 50 km and 17 by 17 km aligned with the satellite ground track. Both top-of-atmosphere and surface data sets are provided. The surface temperature data sets provide, for sea cells, nadir and dual view sea surface temperatures, and for land cells, land surface temperature (currently 11 micron BT) and NDVI. Cloud data is also included. No ADS are included in the AST product; auxiliary data is contained within the MDS. The data sets of the AST product are arranged by surface type and resolution. The 3rd reprocessing of ATSR data was performed in 2013; the processing updates that have been put in place and the scientific improvements are outlined in full in the User Summary Note for the Third ERS ATSR Reprocessing.
Activity - General activities
EO Summer Schools
ESA's series of summer schools, on Monitoring of the Earth System, aims to promote the exploitation of Earth observation (EO) data.
Event - Training

EO Summer School 8
ESA's series of summer schools, on Monitoring of the Earth System, aims to promote the exploitation of Earth observation data.
Data - EO Sign In Authentication (Open)
Envisat MERIS Full Resolution - Level 2 [MER_FRS_2P/ME_2_FRG]
MERIS FR Level 2 is a Full-Resolution Geophysical product for Ocean, Land and Atmosphere. Each MERIS Level 2 geophysical product is derived from a MERIS Level 1 product and auxiliary parameter files specific to the MERIS Level 2 processing. The MERIS FR Level 2 product has Sentinel 3-like format starting from the 4th reprocessing data released to users in July 2020. The data package is composed of NetCDF 4 files containing instrumental and scientific measurements, and a Manifest file which contains metadata information related to the description of the product. A Level 2 product is composed of 64 measurement files containing: 13 files containing Water-leaving reflectance, 13 files containing Land surface reflectance and 13 files containing the TOA reflectance (for all bands except those dedicated to measurement of atmospheric gas - M11 and M15), and several files containing additional measurements on Ocean, Land and Atmospheric parameters and annotation. The Auxiliary data used are listed in the Manifest file associated to each product. The Level 2 FR product covers the complete instrument swath. The product duration is not fixed and it can span up to the time interval of the input Level 0/Level 1. Thus the estimated size of the Level 2 FR is dependent on the start/stop time of the acquired segment. During the Envisat mission, acquisition of MERIS Full Resolution data was subject to dedicated planning based on on-demand ordering and coverage of specific areas according to operational recommendations and considerations. See yearly and global density maps to get a better overview of the MERIS FR coverage.
Data - EO Sign In Authentication (Open)
Envisat MERIS Full Resolution - Level 1 [MER_FRS_1P/ME_1_FRG]
The MERIS Level 1 Full Resolution (FR) product contains the Top of Atmosphere (TOA) upwelling spectral radiance measurements. The in-band reference irradiances for the 15 MERIS bands are computed by averaging the in-band solar irradiance of each pixel. The in-band solar irradiance of each pixel is computed by integrating the reference solar spectrum with the band-pass of each pixel. The MERIS FR Level 1 product has Sentinel 3-like format starting from the 4th reprocessing data released to users in July 2020. Each measurement and annotation data file is in NetCDF 4. The Level 1 product is composed of 22 data files: 15 files containing radiances at each band (one band per file), accompanied by the associated error estimates, and 7 annotation data files. The 15 sun spectral flux values provided in the instrument data file of the Level 1 products are the in-band reference irradiances adjusted for the Earth-sun distance at the time of measurement. The band-pass of each pixel is derived from on-ground and in-flight characterisation via an instrument model. The values "Band wavelength" and "Bandwidth" provided in the Manifest file of the Level 1b products are the averaged band-pass of each pixel over the instrument field of view. Auxiliary data are also listed in the Manifest file associated to each product. The Level 1 FR product covers the complete instrument swath. The product duration is not fixed and it can span up to the time interval of the input Level 0 (for a maximum of 20 minutes). Thus the estimated size of the Level 1 FR is dependent on the start/stop time of the acquired segment. During the Envisat mission, acquisition of MERIS Full Resolution data was subject to dedicated planning based on on-demand ordering and coverage of specific areas according to operational recommendations and considerations. See yearly and global density maps to get a better overview of the MERIS FR coverage.
Activity - Projects
Dragon Cooperation Programme
The Dragon Programme focussed on science and applications development in China using mainly data from the ERS and Envisat missions. The Prgramme was a cooperation between ESA and the National Remote Sensing Centre of China.