- All Categories (13)
- Data (1)
- Missions (1)
- Events (5)
- Tools (1)
- Activities (1)
- Documents (4)
Event - Conference

Dragon 3 2014 Symposium
The Dragon 3 2014 Symposium was part of the Dragon 3 Programme, focussed on exploitation of ESA, ESA's Third Party Missions and Chinese Earth observation data for geo-science and applications development in land, ocean and atmospheric applications.
Event - Conference
Dragon 3 2015 Symposium
The Dragon 3 2015 Symposium was part of the Dragon 3 Programme, focussed on exploitation of ESA, ESA's Third Party Missions and Chinese Earth observation data for geo-science and applications development in land, ocean and atmospheric applications.
Event - Conference
Dragon 3 2016 Symposium
The Dragon 3 2016 Symposium served as the close of the Dragon 3 Cooperation Programme (2012 to 2016) and formal kick off for Dragon 4 Cooperation projects.
Activity - Projects
Dragon 3 Cooperation Programme
The Dragon 3 Programme focussed on the exploitation of ESA, ESA's Third Party Missions and Chinese Earth observation data for geo-science and applications development in land, ocean and atmospheric applications.
Tools - Visualisation
EVDC Orbit Prediction Tool
The EVDC Orbit Prediction and Overpass Tool generates and visualises satellite's overpasses.
Data - External Data (Restrained)

ADAM Surface Reflectance Database v4.0
ADAM enables generating typical monthly variations of the global Earth surface reflectance at 0.1° spatial resolution (Plate Carree projection) and over the spectral range 240-4000 nm. The ADAM product is made of gridded monthly mean climatologies over land and ocean surfaces, and of a companion API toolkit that enables the calculation of hyperspectral (at 1 nm resolution over the whole 240-4000 nm spectral range) and multidirectional reflectances (i.e. in any illumination/viewing geometry) depending on user choices. The ADAM climatologies that feed the ADAM calculation tools are: For ocean: Monthly chlorophyll concentration derived from SeaWiFS-OrbView-2 (1999-2009); it is used to compute the water column reflectance (which shows large spectral variations in the visible, but is insignificant in the near and mid infrared). Monthly wind speed derived from SeaWinds-QuikSCAT-(1999-2009); it is used to calculate the ocean glint reflectance. For land: Monthly normalized surface reflectances in the 7 MODIS narrow spectral bands derived from FondsdeSol processing chain of MOD09A1 products (derived from Aqua and Terra observations), on which relies the modelling of the hyperspectral/multidirectional surface (soil/vegetation/snow) reflectance. Uncertainty variance-covariance matrix for the 7 spectral bands associated to the normalized surface reflectance. For sea-ice: Sea ice pixels (masked in the original MOD09A1 products) have been accounted for by a gap-filling approach relying on the spatial-temporal distribution of sea ice coverage provided by the CryoClim climatology for year 2005.
Mission - Meteorological Missions
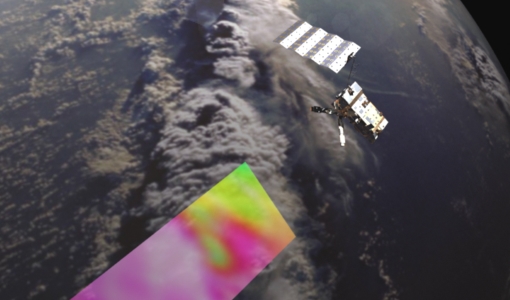
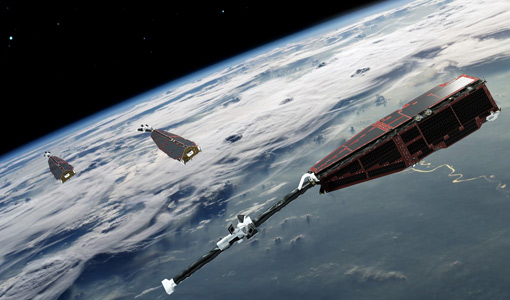
MetOp
MetOp is a mission dedicated to improving weather forecasts and monitoring Earth's climate.
Event - Training

Advanced Training Course in Land Remote Sensing 2012
The 2012 advanced training course focused on land remote sensing theory and applications.
Event - Training
3rd Advanced Training Course on Land Remote Sensing 2011
This 2011 advanced ESA training course focused on land remote sensing theory and applications.
Document - General Reference

MetOp-Monitoring-the-Weather-from-Polar-Orbit.pdf
This brochure describes in details the MetOp mission, the satellite and its instruments.
Document - General Reference
MetOp-A-Truly-Global-Picture-About-MetOp-mission-and-its-instruments.pdf
This flyer describes the MetOp mission and its instruments.
Document - User Guide

Third Party Missions, Cat-1 Data Availability
This brochure gives a quick overview on the availability of the Third Party Missions IRS-P3, JERS-1, NIMBUS, Proba, Landsat, KOMPSAT-1, SCISAT-1, Terra/Aqua, NOAA, QSCAT, OrbView, SPOT-1,-2,-3,-4, ALOS.
Document - Conference Presentation - Poster

8-Use_SAR_observing_Polar_lows.pdf
Use of SAR in observing Polar lows Birgitte Furevik (Norwegian Meteorological Inst., Norway)