- All Categories (123)
- Data (14)
- News (68)
- Missions (12)
- Events (14)
- Tools (3)
- Activities (4)
- Campaigns (2)
- Documents (6)
DATA
Discover and download the Earth observation data you need from the broad catalogue of missions the European Space Agency operate and support.
Data - Sample Data (Open)
TerraSAR-X Sample Data
Download free TerraSAR-X sample datasets to preview products available for this mission.
Data - Sample Data (Open)
RapidEye Sample Data
Download free RapidEye sample datasets to preview products available for this mission.
Data - Sample Data (Open)
WorldView-3 Sample Data
Download free WorldView-3 sample datasets to preview products available for this mission.
Data - Fast Registration with approval (Restrained)
European Cities: Cartosat-1 Euro-Maps 3D
A large number of European cities are covered by this dataset; for each city you can find one or more Cartosat-1 ortho image products and one or more Euro-Maps 3D DSM tiles clipped to the extent of the ortho coverage. The Euro-Maps 3D DSM is a homogeneous, 5 m spaced Digital Surface Model semi-automatically derived from 2.5 m Cartosat-1 in-flight stereo data with a vertical accuracy of 10 m. The very detailed and accurate representation of the surface is achieved by using a sophisticated and well adapted algorithm implemented on the basis of the Semi-Global Matching approach. The final product includes several pixel-based quality and traceability layers: The dsm layer (*_dsm.tif) contains the elevation heights as a geocoded raster file The source layer (*_src.tif) contains information about the data source for each height value/pixel The number layer (*_num.tif) contains for each height value/pixel the number of IRS-P5 Cartosat-1 stereo pairs used for the generation of the DEM The quality layer (*_qc.tif) is set to 1 for each height/pixel value derived from IRS-P5 Cartosat-1 data and which meets or exceeds the product specifications The accuracy vertical layer (*_acv.tif) contains the absolute vertical accuracy for each quality controlled height value/pixel. The ortho image is a Panchromatic image at 2.5 m resolution. The following table defines the offered product types. EO-SIP product type Description PAN_PAM_3O IRS-P5 Cartosat-1 ortho image DSM_DEM_3D IRS-P5 Cartosat-1 DSM
Data - Project Proposal (Restrained)
GHGSat archive and tasking
GHGSat data produce measures of vertical column densities of greenhouse gas emissions ((currently CH4, but eventually CO2), provided on a pre-defined area of 12 km x 12 km, from the full sensor field-of-view. GHGSat Catalogue and New Collect data are available in three different data types: Single Observation: a single observation of a scene. Monthly Monitoring: guaranteed 12 successful observations in a year over a given site (once per month or flexible best effort cadence depending on weather). Weekly Monitoring: guaranteed 52 successful observations in a year over a given site (once a week or flexible best effort cadence based on weather), to accommodate large & persistent monitoring needs. Data are provided as an Emissions package containing the following products: Abundance dataset (Level 2): Set of per-pixel abundances in excess of the local background (ppb) for a single species, and per-pixel measurement error expressed as a standard deviation for a single site on a single satellite pass. Data format is 16-bit GeoTIFF. Concentration Maps (Level 2): High readability pseudocolour map combining surface reflectance, and column density expressed in ppb for a single species in PNG format. The relevant abundance dataset is provided as well. Emission Rates (Level 4): Instantaneous rate for a detected emission from a targeted source estimated using abundance datasets from a single satellite pass and applying dispersion modelling techniques. The delivered product includes the emission rate estimate with uncertainty and key dispersion parameters (in CSV format) as well as the abundance dataset used for the emission estimate. This product is only delivered in the Emissions package if an emission is detected within the abundance dataset. The Level 2 products will be delivered regardless of whether or not an emission is detected. The properties of available products are summarised in the table. Band(s) / Beam Mode(s) and Polarisation SWIR (1635-1675 nm), multiple bands, unpolarised Spatial Resolution <30 m Scene size 12 km x 12 km Species Measured CH4 Geometric Corrections Radial distortion, perspective projection Radiometric Corrections Detector pixel response, ghosting, spectral response, atmospheric correction including trace gas modelling and surface reflectance Details about the data provision, data access conditions and quota assignment procedure are described in the GHGSat Terms of Applicability.
Data - Project Proposal (Restrained)
SPOT-6 to 7 full archive and tasking
The SPOT 6 and 7 satellites ensure data continuity with the no longer operational SPOT 5 satellite and provide an archive of very high resolution optical acquisition as well as the possibility to task the satellites for new acquisitions. Following the completion of the SPOT 7 mission in March 2023, new acquisition tasking is only available for the SPOT 6 satellite. The ortho-products are automatically generated by the SPOT 6 and 7 ground segment, based on SRTM database or Reference3D when available. The projection available for SPOT 6 and 7 ortho-products is UTM, datum WGS84. Bands combinations: Pansharpened: colour image at 1.5 m resolution Bundle: 1.5 m panchromatic image and 6 m multispectral image. Geometric processing levels: Primary: The Primary product is the processing level closest to the natural image acquired by the sensor. This product restores perfect collection conditions: the sensor is placed in rectilinear geometry, and the image is clear of all radiometric distortion. Standard Ortho: The Ortho product is a georeferenced image in Earth geometry, corrected from acquisition and terrain off-nadir effects. Tailored ortho: Aside from the Standard Ortho product, when different specifications are needed, a custom orthorectification, with a more precise 3D model provided by the client or acquired for the purpose, can be provided on demand. As per ESA policy, very high-resolution imagery of conflict areas cannot be provided.
Data - Project Proposal (Restrained)

Spire live and historical data
The data collected by Spire from it's 110 satellites launched into Low Earth Orbit (LEO) has a diverse range of applications, from analysis of global trade patterns and commodity flows to aircraft routing to weather forecasting. The data also provides interesting research opportunities on topics as varied as ocean currents and GNSS-based planetary boundary layer height. The following products can be requested: ADS-B Data Stream Global ADS-B satellite data observed by Spire satellites and processed through the ground stations network. Historical ADS-B data older than 6 months can be delivered as data cuts containing CSV file(s) accessible through a Web Service or Cloud storage solutions. Live ADS-B data is available through a streaming API, and recent historical data can be accessed through a REST API. Data is distributed as a monthly subscription: historical data can be requested starting from 3 December 2008, the time period for live data starts from a user-defined date and continues for 30 days AIS AIS messages include satellite AIS (S-AIS) as observed by Spire satellites and terrestrial AIS (T-AIS) from third party sensor stations (up to 40 million messages per day). Historical AIS data are delivered as a cvs file with availability back to June 2016 or via Historical API from December 2018; live AIS data are pushed to end users via TCP or through Messages API. Data is distributed as a monthly subscription, from a user-defined date and continues for a 30 day period. GNSS-Radio Occultation GNSS Radio Occultation (GNSS-RO) measurements are collected globally on a continuous basis, generating profiles of the Earth’s atmosphere. Derived Level 1 and Level 2 products include both atmospheric and ionospheric products. Historical data for most of the GNSS-RO products are available from December 2018 to the present. Near real-time (within 90 minutes or less latency from collection to delivery) GNSS-RO profiles are also available upon request. GNSS Reflectometry GNSS Reflectometry (GNSS-R) is a technique to measure Earth’s surface properties using reflections of GNSS signals in the form of a bistatic radar. Spire collects two types of GNSS-R data: conventional, near-nadir incidence LHCP reflections collected by the Spire GNSS-R satellites (e.g., Spire GNSS-R “Batch-1” satellites) and grazing angle (i.e., low elevation angle) RHCP reflections collected by the Spire GNSS-RO satellites. Derived Level 1 and Level 2 products are available, as well as some special Level 0 raw intermediate frequency (IF) data. Historical grazing angle GNSS-R data are available from May 2019 to the present, while conventional GNSS-R data are available from December 2020 to the present. In addition, also Polarimetric Radio Occultation (PRO) measurements are available Name Description Data format and content Application Automatic Identification System (AIS) The automatic identification system (AIS) is an automatic tracking system that uses transponders on ships and is used by vessel traffic services. Spire data includes satellite AIS (S-AIS) as observed by Spire satellites and terrestrial AIS (T-AIS) from third party sensor stations. .parquet.gz files The AIS files contain time-series data on received AIS messages, both the raw NMEA message and added post-processing data for each message. Supply chain analysis, commodity trading, identification of illegal fishing or dark targets, ship route and fuel use optimization, analysis of global trade patterns, anti-piracy, autonomous vessel software, ocean currents Automatic Dependent Surveillance-Broadcast (ADS-B) Spire AirSafe ADS-B products give access to satellite and terrestrial ADS-B data from captured aircrafts. .csv.gz files The decompressed csv file contains a list of hexadecimal representations of ADS-B messages associated with the timestamp they were received on the satellite. Fleet management, ICAO regulatory compliance, route optimization, predictive maintenance, global airspace, domain awareness Global Navigation Satellite System Radio Occultation (GNSS-RO) GNSS atmospheric radio occultation (GNSS-RO) relies on the detection of a change in a radio signal as it passes through a planet's atmosphere, i.e. as it is refracted by the atmosphere. This data set contains precise orbit determination (POD) solutions, satellite attitude information, high-rate occultation observations, excess phase, and derived atmospheric dry temperature profiles. podObs*.rnx This file contains raw pseudorange, carrier phase, Doppler frequency, and signal-to-noise measurements for each observed GPS signal from a single Spire satellite which allow to estimate the positions and velocities of each Spire satellite and also used to derive ionospheric total electron content data. leoOrb*.sp3 This file contains the estimated position, velocity and receiver clock error of a given Spire satellite after processing of the POD observation file leoAtt*.log It contains 1 Hz rate quaternion information measured from a single Spire satellite describing the satellite orientation. opnGns*ro.bin, opnGns*rst.bin these files contain raw measurements from the occulting GNSS satellite (one for each signal frequency) and raw phase data from one or more reference GNSS satellites. atmPhs* The file contains occultation excess phase delay. Also contains SNR values, ransmitter and receiver positions and open loop model information atmPrf*.nc The file contains profiles of atmospheric dry pressure, dry temperature and neutral refractivity as a function of altitude produced from full processing of one occultation event. bfrPrf*.bufr The file contains derived profiles of dry pressure, dry temperature, refractivity and bending angle for each occultation. Atmospheric profiles of pressure, dry temperature, bending angle, and refractivity used in numerical weather prediction data assimilation and climate change studies. Raw IF samples from GNSS-RO satellites Raw intermediate frequency (IF) sampled data (I/Q) from the GNSS receiver front-end of GNSS-RO satellites. rocRIF*.zip Binary raw IF data and associated ancillary data (e.g., POD data) in a zip archive per collection event. GNSS-RO studies, GNSS RFI and jamming monitoring, research. Raw IF samples from GNSS-R satellites Raw intermediate frequency (IF) sampled data (I/Q) from the GNSS receiver front-end of conventional GNSS-R satellites. gbrRIF*.zip Binary raw IF data and associated ancillary data (e.g., POD data) in a zip archive per collection event. GNSS-R studies, GNSS RFI and jamming monitoring, research, etc. Grazing angle GNSS-R observations During grazing angle GNSS-R events, signal reflection at two frequencies is observed through the limb-facing antenna and is trackedusing an open-loop tracking technique thatrelies on a model topredict the propagationdelay and Doppler of thereflected signal. Simultaneous open-looptracking of the signaldirectly along theline-of-sight from thetransmitter to thereceiver is alsoperformed to provideadditional data that maybenecessary for signalcalibration. The mainoutput of the open-looptracking are in-phase (I)and quadrature (Q)accumulation samples(nominally at 50 Hz),which represent the residual Doppler (phase) from the model. grzObs*.nc L1A filecontains rawopen loopcarrier phasemeasurementsat 50 Hzsampling forgrazingangleGNSS-Rreflectionscaptured in the GNSS-RO RHC Pantennas, (bothdirect andreflectedsignals) on GNSS-RO satellites. Sea surface and sea ice height extent, and classification Georeferenced grazing angle GNSS-R observations The low-levelobservations of the high-rate grazing angle GNSS-R observationsbut withthegeoreferenced bistatic radar parameters of the satellite receiver,specular reflection, and GNSS transmitter included. grzRfl*.nc L1B file contains the georeferenced grazing angle GNSS-R data collected by Spire GNSS-RO satellites, including the low-level observables and bistatic radar geometries (e.g., receiver, specular reflection, and the transmitter locations). Sea surface and sea ice height extent, and classification GNSS-R calibrated bistatic radar reflectivities Higher level product used to derive land-surface reflectivity. gbrRfl*.nc L1A along-track calibrated relative power between reflected and direct signals (e.g., bistatic radar reflectivities) measured by Spire conventional GNSS-R satellites. GNSS-R studies, soil moisture, ocean wind, and sea ice applications GNSS-R calibrated bistatic radar cross-sections Higher level product used to derive ocean surface roughness products. gbrRCS*.nc L1B along-track calibrated and normalized bistatic radar cross-sections measured by Spire conventional GNSS-R satellites. GNSS-R studies, ocean wind and sea ice applications Combined Surface Soil Moisture Combined CYGNSS and SMAP soil moisture data are provided as a combined surface soil moisture (COMB-SSM) product in two data level formats: L2U1 and L3U1. 6 x 6 km grid cell. L-band measurements of surface soil moisture benefit from better vegetation penetration in comparison to traditional C-band measurements. COMB-SSM.nc This file contains the combined data product containing measurements from both CYGNSS and SMAP reported on a 6 km global Equi7Grid grid. Agriculture, crop insurance, farming solutions, climatology, terrain awareness, peatlands and wetlands monitoring etc Ionosphere total electron content Spire routinely collects and processes a large volume of total electron content (TEC) data, representing the line-of-sight integration of electron density between a Spire satellite and a GNSS satellite. Each file contains line-of-sight ionospheric total electron content (TEC) estimates derived for a ‘single viewing arc’ contained in the POD observation file. Viewing arcs are at least 10 minutes in duration. podTec*.nc This file contains the line-of-sight total electron content with associated orbital information. Space weather research, tsunamigenic earthquakes, weather applications, space situational awareness (SSA), autonomous vehicles etc Ionosphere scintillation The scintillation index for each GNSS frequency is computed onboard the spacecraft. This index provides a measure of the fluctuations of the GNSS signal over the course of 10 seconds caused by propagation of the radio signals through electron density irregularities in the ionosphere. After the raw indices are downlinked to the ground, they are packaged along with associated metadata such as orbit position to create the final scintillation data product. scnLv1*.nc This file contains on-board computed scintillation data (S4 only) with associated orbital information Space weather research, solar events, TIDs, weather applications positioning and navigation, communications etc Electron density profile Electron density profiles are retrieved as a function of altitude. Electron density profiles are processed from podTec netcdf files, which span a sufficient elevation angle range. A standard Abel inversion algorithm is applied to retrieve the profiles. ionPrf*.nc This file contains electron density profile retrieved from podTec files spanning appropriate elevation angle range Space weather research, solar events, TIDs, weather applications positioning and navigation, communications Polarimetric Radio Occultation (PRO) measurements PRO measurements observe the properties of GNSS signals as they pass through by Earth's atmosphere; the polarization state of the signals is recorded separately for H and V polarizations to provide information on the anisotropy of hydro-meteors along the propagation path. proObs Level 0 - Raw open loop carrier phase measurements at 50 Hz sampling for both linear polarization components (horizontal and vertical) of the occulted GNSS signal. leoOrb*.sp3 This file contains the estimated position, velocity and receiver clock error of a given Spire satellite after processing of the POD observation file h(v)(c)atmPhs Level 1B - Atmospheric excess phase delay computed for each individual linear polarization component (hatmPhs, vatmPhs) and for the combined (“H” + “V”) signal (catmPhs). Also contains values for signal-to-noise ratio, transmitter and receiver positions and open loop model information. polPhs Level 1C - Combines the information from the hatmPhs and vatmPhs files while removing phase continuities due to phase wrapping and navigation bit modulation. patmPrfLevel 2 - Bending angle, dry refractivity, and dry temperature as a function of mean sea level altitude and impact parameter derived from the “combined” excess phase delay (catmPhs) PRO measurements add a sensitivity to ice and precipitation content alongside the traditional RO measurements of the atmospheric temperature, pressure, and water vapor. The products are available as part of the Spire provision with worldwide coverage. All details about the data provision, data access conditions and quota assignment procedure are described in the Terms of Applicability.
Data - Announcement of Opportunity (Restrained)
Announcement of Opportunity for NoR
ESA invites submissions for the Network of Resources (NoR) call, which aims to support research, development and pre-commercial users to innovate their working practices, moving from a data download paradigm towards a 'bring the user to the data' paradigm.
Data - Fast Registration with approval (Restrained)

SPOT 6 and 7 ESA archive
The SPOT 6 and 7 ESA archive is a dataset of SPOT 6 and SPOT 7 products that ESA collected over the years. The dataset regularly grows as ESA collects new SPOT 6 and 7 products. SPOT 6 and 7 Primary and Ortho products can be available in the following modes: Panchromatic image at 1.5m resolution Pansharpened colour image at 1.5m resolution Multispectral image in 4 spectral bands at 6m resolution Bundle (1.5m panchromatic image + 6m multispectral image) Spatial coverage: Check the spatial coverage of the collection on a map available on the Third Party Missions Dissemination Service. As per ESA policy, very high-resolution imagery of conflict areas cannot be provided.
Data - Fast Registration with approval (Restrained)

SPOT 1-5 ESA archive
The ESA SPOT 1-5 collection is a dataset of SPOT 1 to 5 Panchromatic and Multispectral products that ESA collected over the years. The HRV(IR) sensor onboard SPOT 1-4 provides data at 10 m spatial resolution Panchromatic mode (-1 band) and 20 m (Multispectral mode -3 or 4 bands). The HRG sensor on board of SPOT-5 provides spatial resolution of the imagery to < 3 m in the panchromatic band and to 10 m in the multispectral mode (3 bands). The SWIR band imagery remains at 20 m. The dataset mainly focuses on European and African sites but some American, Asian and Greenland areas are also covered. Spatial coverage: Check the spatial coverage of the collection on a map available on the Third Party Missions Dissemination Service. The SPOT Collection
Data - Project Proposal (Restrained)
Pléiades full archive and tasking
The Pléiades twins (1A and 1B) deliver very high-resolution optical data (up to 0.5 m resolution Panchromatic and Colour and 2 m Multispectral) and offer a daily revisit capability to any point on the globe. The swath width is approximately 20 km (with a nadir footprint). The ortho-products are automatically generated by the Pléiades ground segment, based on SRTM or Reference3D database. The projection available for Pléiades ortho-products is UTM, datum WGS84. Bands combinations:: Pansharpened: colour image at 0.5 m resolution Bundle: (0.5 m panchromatic image + 2 m multispectral image) Processing levels: Primary: The Primary product is the processing level closest to the natural image acquired by the sensor. This product restores perfect collection conditions: the sensor is placed in rectilinear geometry, and the image is clear of all radiometric distortion. Standard Ortho: The Ortho product is a georeferenced image in Earth geometry, corrected from acquisition and terrain off-nadir effects. Tailored Ortho: Aside from the Standard Ortho product, when different specifications are needed, a custom orthorectification, with a more precise 3D model provided by the client or acquired for the purpose, can be provided on demand. As per ESA policy, very high-resolution imagery of conflict areas cannot be provided.
Data - Fast Registration with immediate access (Open)
Envisat DORIS Doppler [DOR_DOP_1P]
This product was generated by the Centre de Traitement Doris Poseidon (CTDP). The DORIS Doppler product (DOR_DOP_1P) was consolidated offline 2-4 weeks after sensing and stored in the F-PAC archive. The file size is 0.5 Mbytes per orbit.
Data - Fast Registration with immediate access (Open)
Envisat DORIS Precise Orbit [DOR_VOR_AX]
The latest version of the Envisat DORIS Precise Orbit product, DOR_VOR_AX, was generated by the Centre de Traitement Doris Poseidon (CTDP) using the Geophysical Data Records F standards (GDR-F). The product is used to obtain the satellite orbital parameters (latitude, longitude, height and height rate) by using orbit computation routines. The most significant changes related to the GDR-F standards concern the new ocean tide model (FES2014) and the updated Terrestrial Reference Frame (ITRF2014). The new standards significantly improve all Precise Orbit Determination (POD) metrics with respect to GDR-E. The mean difference and variance of Sea Surface Height (SSH) at crossovers is slightly reduced. The DOR_VOR_AX product adopts the Envisat format, and the size is 0.2 Mbytes per orbit. Users are recommended to apply the GDR-F version, but the previous datasets are still available (i.e. GDR-D and GDR-E versions). See further details in the readme file for Envisat DORIS Precise Orbit Determination files. Comparison of Envisat Sea Level Anomaly trends obtained using DORIS Precise Orbit GDR-E and F standards. North/South patterns are evident. Credits: CNES/CLS.
Data - Campaigns (Open)
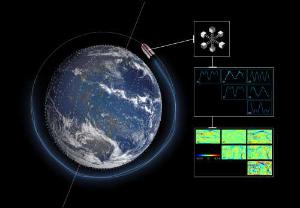
AROMAT-II
This campaign covers the fields of atmospheric composition: NO2, SO2, aerosols, over Romania (Bucharest and Turceni) and Germany (Berlin).