- All Categories (23659)
- Data (23)
- News (131)
- Missions (2)
- Events (16)
- Tools (15)
- Activities (5)
- Campaigns (24)
- Documents (23443)
DATA
Discover and download the Earth observation data you need from the broad catalogue of missions the European Space Agency operate and support.
Data - Campaigns (Open)
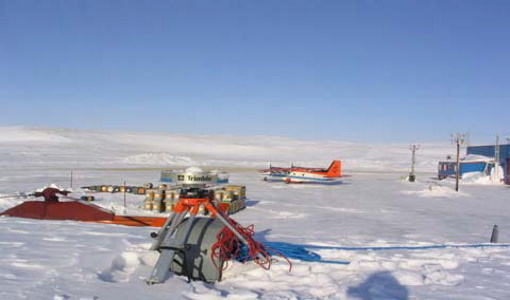
CryoVEx 2004
CryoVex 2004 was the second combined airborne and surface campaign for the preparation of the CryoSat mission, after successful completion of CryoVex 2003 by DTU.
Data - Sample Data (Open)

CryoSat Data Samples
Download CryoSat data samples from Baseline-B, C, and D products.
Data - Project Proposal (Restrained)
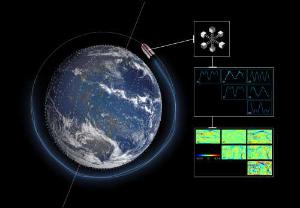
Spire live and historical data
The data collected by Spire from it's 110 satellites launched into Low Earth Orbit (LEO) has a diverse range of applications, from analysis of global trade patterns and commodity flows to aircraft routing to weather forecasting. The data also provides interesting research opportunities on topics as varied as ocean currents and GNSS-based planetary boundary layer height. The following products can be requested: ADS-B Data Stream Global ADS-B satellite data observed by Spire satellites and processed through the ground stations network. Historical ADS-B data older than 6 months can be delivered as data cuts containing CSV file(s) accessible through a Web Service or Cloud storage solutions. Live ADS-B data is available through a streaming API, and recent historical data can be accessed through a REST API. Data is distributed as a monthly subscription: historical data can be requested starting from 3 December 2008, the time period for live data starts from a user-defined date and continues for 30 days AIS AIS messages include satellite AIS (S-AIS) as observed by Spire satellites and terrestrial AIS (T-AIS) from third party sensor stations (up to 40 million messages per day). Historical AIS data are delivered as a cvs file with availability back to June 2016 or via Historical API from December 2018; live AIS data are pushed to end users via TCP or through Messages API. Data is distributed as a monthly subscription, from a user-defined date and continues for a 30 day period. GNSS-Radio Occultation GNSS Radio Occultation (GNSS-RO) measurements are collected globally on a continuous basis, generating profiles of the Earth’s atmosphere. Derived Level 1 and Level 2 products include both atmospheric and ionospheric products. Historical data for most of the GNSS-RO products are available from December 2018 to the present. Near real-time (within 90 minutes or less latency from collection to delivery) GNSS-RO profiles are also available upon request. GNSS Reflectometry GNSS Reflectometry (GNSS-R) is a technique to measure Earth’s surface properties using reflections of GNSS signals in the form of a bistatic radar. Spire collects two types of GNSS-R data: conventional, near-nadir incidence LHCP reflections collected by the Spire GNSS-R satellites (e.g., Spire GNSS-R “Batch-1” satellites) and grazing angle (i.e., low elevation angle) RHCP reflections collected by the Spire GNSS-RO satellites. Derived Level 1 and Level 2 products are available, as well as some special Level 0 raw intermediate frequency (IF) data. Historical grazing angle GNSS-R data are available from May 2019 to the present, while conventional GNSS-R data are available from December 2020 to the present. In addition, also Polarimetric Radio Occultation (PRO) measurements are available Name Description Data format and content Application Automatic Identification System (AIS) The automatic identification system (AIS) is an automatic tracking system that uses transponders on ships and is used by vessel traffic services. Spire data includes satellite AIS (S-AIS) as observed by Spire satellites and terrestrial AIS (T-AIS) from third party sensor stations. .parquet.gz files The AIS files contain time-series data on received AIS messages, both the raw NMEA message and added post-processing data for each message. Supply chain analysis, commodity trading, identification of illegal fishing or dark targets, ship route and fuel use optimization, analysis of global trade patterns, anti-piracy, autonomous vessel software, ocean currents Automatic Dependent Surveillance-Broadcast (ADS-B) Spire AirSafe ADS-B products give access to satellite and terrestrial ADS-B data from captured aircrafts. .csv.gz files The decompressed csv file contains a list of hexadecimal representations of ADS-B messages associated with the timestamp they were received on the satellite. Fleet management, ICAO regulatory compliance, route optimization, predictive maintenance, global airspace, domain awareness Global Navigation Satellite System Radio Occultation (GNSS-RO) GNSS atmospheric radio occultation (GNSS-RO) relies on the detection of a change in a radio signal as it passes through a planet's atmosphere, i.e. as it is refracted by the atmosphere. This data set contains precise orbit determination (POD) solutions, satellite attitude information, high-rate occultation observations, excess phase, and derived atmospheric dry temperature profiles. podObs*.rnx This file contains raw pseudorange, carrier phase, Doppler frequency, and signal-to-noise measurements for each observed GPS signal from a single Spire satellite which allow to estimate the positions and velocities of each Spire satellite and also used to derive ionospheric total electron content data. leoOrb*.sp3 This file contains the estimated position, velocity and receiver clock error of a given Spire satellite after processing of the POD observation file leoAtt*.log It contains 1 Hz rate quaternion information measured from a single Spire satellite describing the satellite orientation. opnGns*ro.bin, opnGns*rst.bin these files contain raw measurements from the occulting GNSS satellite (one for each signal frequency) and raw phase data from one or more reference GNSS satellites. atmPhs* The file contains occultation excess phase delay. Also contains SNR values, ransmitter and receiver positions and open loop model information atmPrf*.nc The file contains profiles of atmospheric dry pressure, dry temperature and neutral refractivity as a function of altitude produced from full processing of one occultation event. bfrPrf*.bufr The file contains derived profiles of dry pressure, dry temperature, refractivity and bending angle for each occultation. Atmospheric profiles of pressure, dry temperature, bending angle, and refractivity used in numerical weather prediction data assimilation and climate change studies. Raw IF samples from GNSS-RO satellites Raw intermediate frequency (IF) sampled data (I/Q) from the GNSS receiver front-end of GNSS-RO satellites. rocRIF*.zip Binary raw IF data and associated ancillary data (e.g., POD data) in a zip archive per collection event. GNSS-RO studies, GNSS RFI and jamming monitoring, research. Raw IF samples from GNSS-R satellites Raw intermediate frequency (IF) sampled data (I/Q) from the GNSS receiver front-end of conventional GNSS-R satellites. gbrRIF*.zip Binary raw IF data and associated ancillary data (e.g., POD data) in a zip archive per collection event. GNSS-R studies, GNSS RFI and jamming monitoring, research, etc. Grazing angle GNSS-R observations During grazing angle GNSS-R events, signal reflection at two frequencies is observed through the limb-facing antenna and is trackedusing an open-loop tracking technique thatrelies on a model topredict the propagationdelay and Doppler of thereflected signal. Simultaneous open-looptracking of the signaldirectly along theline-of-sight from thetransmitter to thereceiver is alsoperformed to provideadditional data that maybenecessary for signalcalibration. The mainoutput of the open-looptracking are in-phase (I)and quadrature (Q)accumulation samples(nominally at 50 Hz),which represent the residual Doppler (phase) from the model. grzObs*.nc L1A filecontains rawopen loopcarrier phasemeasurementsat 50 Hzsampling forgrazingangleGNSS-Rreflectionscaptured in the GNSS-RO RHC Pantennas, (bothdirect andreflectedsignals) on GNSS-RO satellites. Sea surface and sea ice height extent, and classification Georeferenced grazing angle GNSS-R observations The low-levelobservations of the high-rate grazing angle GNSS-R observationsbut withthegeoreferenced bistatic radar parameters of the satellite receiver,specular reflection, and GNSS transmitter included. grzRfl*.nc L1B file contains the georeferenced grazing angle GNSS-R data collected by Spire GNSS-RO satellites, including the low-level observables and bistatic radar geometries (e.g., receiver, specular reflection, and the transmitter locations). Sea surface and sea ice height extent, and classification GNSS-R calibrated bistatic radar reflectivities Higher level product used to derive land-surface reflectivity. gbrRfl*.nc L1A along-track calibrated relative power between reflected and direct signals (e.g., bistatic radar reflectivities) measured by Spire conventional GNSS-R satellites. GNSS-R studies, soil moisture, ocean wind, and sea ice applications GNSS-R calibrated bistatic radar cross-sections Higher level product used to derive ocean surface roughness products. gbrRCS*.nc L1B along-track calibrated and normalized bistatic radar cross-sections measured by Spire conventional GNSS-R satellites. GNSS-R studies, ocean wind and sea ice applications Combined Surface Soil Moisture Combined CYGNSS and SMAP soil moisture data are provided as a combined surface soil moisture (COMB-SSM) product in two data level formats: L2U1 and L3U1. 6 x 6 km grid cell. L-band measurements of surface soil moisture benefit from better vegetation penetration in comparison to traditional C-band measurements. COMB-SSM.nc This file contains the combined data product containing measurements from both CYGNSS and SMAP reported on a 6 km global Equi7Grid grid. Agriculture, crop insurance, farming solutions, climatology, terrain awareness, peatlands and wetlands monitoring etc Ionosphere total electron content Spire routinely collects and processes a large volume of total electron content (TEC) data, representing the line-of-sight integration of electron density between a Spire satellite and a GNSS satellite. Each file contains line-of-sight ionospheric total electron content (TEC) estimates derived for a ‘single viewing arc’ contained in the POD observation file. Viewing arcs are at least 10 minutes in duration. podTec*.nc This file contains the line-of-sight total electron content with associated orbital information. Space weather research, tsunamigenic earthquakes, weather applications, space situational awareness (SSA), autonomous vehicles etc Ionosphere scintillation The scintillation index for each GNSS frequency is computed onboard the spacecraft. This index provides a measure of the fluctuations of the GNSS signal over the course of 10 seconds caused by propagation of the radio signals through electron density irregularities in the ionosphere. After the raw indices are downlinked to the ground, they are packaged along with associated metadata such as orbit position to create the final scintillation data product. scnLv1*.nc This file contains on-board computed scintillation data (S4 only) with associated orbital information Space weather research, solar events, TIDs, weather applications positioning and navigation, communications etc Electron density profile Electron density profiles are retrieved as a function of altitude. Electron density profiles are processed from podTec netcdf files, which span a sufficient elevation angle range. A standard Abel inversion algorithm is applied to retrieve the profiles. ionPrf*.nc This file contains electron density profile retrieved from podTec files spanning appropriate elevation angle range Space weather research, solar events, TIDs, weather applications positioning and navigation, communications Polarimetric Radio Occultation (PRO) measurements PRO measurements observe the properties of GNSS signals as they pass through by Earth's atmosphere; the polarization state of the signals is recorded separately for H and V polarizations to provide information on the anisotropy of hydro-meteors along the propagation path. proObs Level 0 - Raw open loop carrier phase measurements at 50 Hz sampling for both linear polarization components (horizontal and vertical) of the occulted GNSS signal. leoOrb*.sp3 This file contains the estimated position, velocity and receiver clock error of a given Spire satellite after processing of the POD observation file h(v)(c)atmPhs Level 1B - Atmospheric excess phase delay computed for each individual linear polarization component (hatmPhs, vatmPhs) and for the combined (“H” + “V”) signal (catmPhs). Also contains values for signal-to-noise ratio, transmitter and receiver positions and open loop model information. polPhs Level 1C - Combines the information from the hatmPhs and vatmPhs files while removing phase continuities due to phase wrapping and navigation bit modulation. patmPrfLevel 2 - Bending angle, dry refractivity, and dry temperature as a function of mean sea level altitude and impact parameter derived from the “combined” excess phase delay (catmPhs) PRO measurements add a sensitivity to ice and precipitation content alongside the traditional RO measurements of the atmospheric temperature, pressure, and water vapor. The products are available as part of the Spire provision with worldwide coverage. All details about the data provision, data access conditions and quota assignment procedure are described in the Terms of Applicability.
Data - Announcement of Opportunity (Restrained)
CLOSED - Announcement of Opportunity for Spire data
An opportunity for scientists and researchers to access Spire data.
Data - Open access (Open)
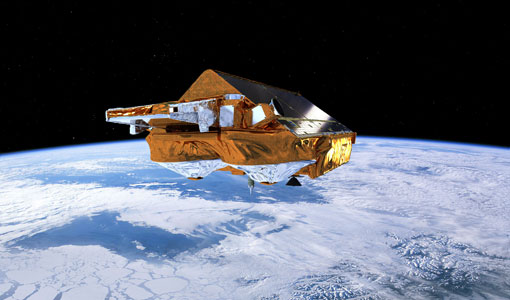
CryoSat products
CryoSat's primary payload is the SAR/Interferometric Radar Altimeter (SIRAL) which has extended capabilities to meet the measurement requirements for ice-sheet elevation and sea-ice freeboard. CryoSat also carries three star trackers for measuring the orientation of the baseline. In addition, a radio receiver called Doppler Orbit and Radio Positioning Integration by Satellite (DORIS) and a small laser retroreflector ensures that CryoSat's position will be accurately tracked. More detailed information on CryoSat instruments is available on the CryoSat mission page. The following CryoSat datasets are available and distributed to users: Level 1B and L2 Ice products: NRT, LRM, SAR and SARIn Consolidated Level 2 (GDR): (LRM+SAR+SARIN) consolidated ice products over an orbit Intermediate Level 2 Ice products: LRM, SAR and SARIn L1b and L2 Ocean Products: NOP, GOP and IOP Cryo-TEMPO Land Ice Cryo-TEMPO Sea Ice Cryo-TEMPO Coastal Ocean Cryo-TEMPO Polar Ocean Cryo-TEMPO Inland Waters Cryo-TEMPO EOLIS Point Products Cryo-TEMPO EOLIS Gridded Products CryoSat Quaternions Product. Detailed information concerning each of the above datasets is available in the CryoSat Products Overview. CryoSat Ice and Ocean products CryoSat Level 1B altimetric products contain time and geo-location information as well as SIRAL measurements in engineering units. Calibration corrections are included and have been applied to the window delay computations. In Offline products, geophysical corrections are computed from Analysis Auxiliary Data Files (ADFs), whereas in FDM products corrections are computed for Forecast ADFs. All corrections are included in the data products and therefore the range can be calculated by taking into account the surface type. The Offline Level 2 LRM, SAR and SARIn ice altimetric products are generated 30 days after data acquisition and are principally dedicated to glaciologists working on sea-ice and land-ice areas. The Level 2 FDM products are near-real time ocean products, generated 2-3 hours after data acquisition, and fulfill the needs of some ocean operational services. Level 2 products contain the time of measurement, the geo-location and the height of the surface. IOP and GOP are outputs of the CryoSat Ocean Processor. These products are dedicated to the study of ocean surfaces, and provided specifically for the needs of the oceanographic community. IOP are generated 2-3 days after data sensing acquisition and use the DORIS Preliminary Orbit. GOP are typically generated 30 days after data sensing acquisition and use the DORIS Precise Orbit. Geophysical corrections are computed from the Analysis ADFs, however following the oceanographic convention the corrections are available but not directly applied to the range (as for FDM). CryoSat Ice and Ocean products can be accessed through ftp://science-pds.cryosat.esa.int/ via an FTP client and HTTPS under the folders named “SIR_” followed by the data product type and the processing level (e.g., SIR_SAR_L2 for Level 2 SAR data). Additionally, data can be downloaded from all the other services listed in the How to Access Data section. Cryo-TEMPO Products The CryoSat ThEMatic PrOducts (Cryo-TEMPO) projects aim to deliver a new paradigm of simplified, harmonized, and agile CryoSat-2 products, that are easily accessible to new communities of non-altimeter experts and end users. The Cryo-TEMPO datasets include dedicated products over five thematic areas, covering Sea Ice, Land Ice, Polar Ocean, Coastal Ocean and Inland Water. The standard Cryo-TEMPO products include fully-traceable uncertainties and use rapidly evolving, state-of-the-art processing dedicated to each thematic area. Throughout the project, the products will be constantly evolved, and validated by a group of Thematic Users, thus ensuring optimal relevance and impact for the intended target communities. More information on the Cryo-TEMPO products can be found in the Product Handbook and on the Project Website. The products can be accessed through ftp://science-pds.cryosat.esa.int/ via an FTP client and HTTPS under the folders named “TEMPO_POCA_(SI/LI/PO/CO/IW)", where the last two letters are the initials of the thematic area (e.g., SI stands for Sea Ice). Cryo-TEMPO EOLIS The CryoTEMPO-EOLIS swath product exploits CryoSat's SARIn mode and the novel Swath processing technique to deliver increased spatial and temporal coverage of time-dependent elevation over land ice, a critical metric for tracking ice mass trends in support to a wide variety of end-users. The dataset consists of systematic reprocessing of the entire CryoSat archive to generate new L2-Swath products, increasing data sampling by 1 to 2 orders of magnitude compared with the operational L2 ESA product. In addition, the EOLIS dataset is joined with the ESA L2 Point-Of-Closest-Approach to generate monthly DEM (Digital Elevation Model) products. This dataset will further the ability of the community to analyse and understand trends across the Greenland Ice Sheet margin, Antarctica and several mountain glaciers and ice caps around the world. More information on the Cryo-TEMPO products can be found on the Project Website and the products can be accessed through ftp://science-pds.cryosat.esa.int/ via an FTP client and HTTPS under the folders named “TEMPO_SWATH_(POINT/GRID)”, where the last word is used to choose between the available “Point” and “Gridded” datasets. Additionally, Cryo-TEMPO EOLIS products can be visualised and downloaded from the CS2EO Platform. CryoSat Quaternions Product This product contains the attitude quaternions for the CryoSat-2 mission. It is obtained starting from the corrected mispointing angles measured by the platform star trackers. More information on the product can be found in the Algorithm Description and Product Format Specification documents. The quaternions product can be accessed from the CryoSat CalVal FTPS server via an FTPS client, and are located in the “AUX_PROQUA” folder. Users wishing to access the quaternions products should request a personal account to be created by emailing the CryoSat Mission Geophysicist, Dr. Alessandro Di Bella (alessandro.di.bella@ext.esa.int).
Data - Campaigns (Open)
CryoVEx/ICESat-2 Spring 2019
The ESA Spring CryoVEx/ICESat-2 campaign 2019 was the first CryoVEx campaign since the launch of NASA ICESat-2 in September 2018, and aimed at cross-validating ESA CryoSat-2 and NASA ICESat-2 missions over sea ice and land ice in the Arctic.
Data - Campaigns (Open)
CryoVEx KAREN 2017
The CryoVEx-KAREN 2017 Campaign in the Arctic had the goal to collect unique measurements to help us better understand how sea ice is changing.
Data - Campaigns (Open)
CryoVEx KAREN 2016 Fall
The CryoVEx-KAREN 2016 Fall Campaign in Ilulissat, Greenland had the goal to collect unique measurements to help us better understand how snow and ice on the Greenland ice sheet is changing over time, and help ESA design future space missions to monitor the changing climate in our polar regions.
Data - Campaigns (Open)
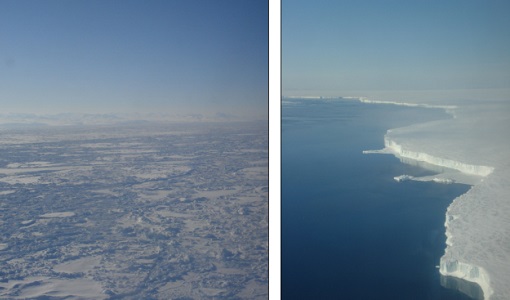
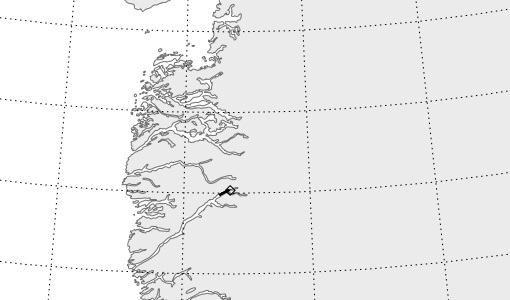
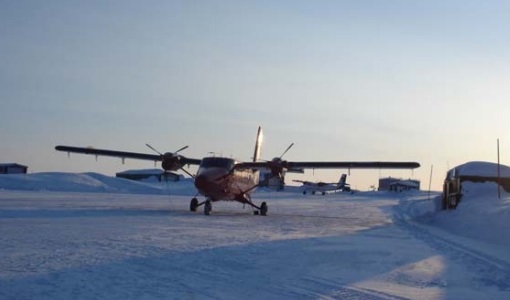
CryoVEx/KAREN Antarctica 2017/18
ESA’s CryoVEx/Karen 2017‐18 campaign took place in Antarctica in from Dec 2017 to Jan 2018. The campaign was composed of an airborne and in‐situ campaign and acquired extensive data sets of scanning lidar, Ku‐ and Ka‐band nadir‐looking radar, and auxiliary imagery for validation of the ESA CryoSat‐2 satellite (Ku‐band radar altimetry) and the French‐Indian AltiKa mission (Ka‐band radar altimetry).
Data - Campaigns (Open)
CryoVEx ICESat-2 Summer 2019
The ESA CryoVEx/ICESat‐2 summer campaign 2019 is an add‐on to the campaign carried out in the spring 2019, which did not cover all the flights that were planned due to weather obstacles.
Data - Campaigns (Open)
CryoVEx ASIRAS 2014
The CryoVEx 2014 airborne campaign was conducted as two separate operational periods. The sea ice activities covering large parts of the western Arctic Ocean were planned to take place early in the season to make sure the weather was stable.
Data - Campaigns (Open)
CryoVEx 2016 Spring
The CryoVEx 2016 campaign was primarily carried out to follow up on a recommendation given within ESA CryoVal Land Ice project (2014-2015), where it was found that the traditional under-flights of the CryoSat-2 satellite were inadequate.
Data - Campaigns (Open)
CryoVEx AEM
CryoVEX 2014 performed measurements over the Beaufort Sea and Arctic Ocean north of Canada (Ellesmere Island) and Greenland. Airborne surveys and ground‐based snow and ice measurements were performed.
Data - Campaigns (Open)
CryoVEx 2012
In continuation of the CryoVEx campaign in 2011, ESA initiated a second Arctic post-launch campaign in 2012 to further calibrate and validate CryoSat data products.
Data - Campaigns (Open)
CryoVEx 2011
The aims of the CryoSat Validation Experiment (CryoVEx) 2011 was to study the snow and ice characteristics of Arctic sea ice and its snow cover.
Data - Campaigns (Open)
CryoVEx 2010
CryoVEx 2010 was the first CryoSat post-launch campaign to take place. It was set up as a test campaign for the upgraded ASIRAS system.
Data - Campaigns (Open)
CryoVEx 2008
The ESA CryoSat Validation Experiment, CryoVEx 2008 was carried out in April and May 2008.
Data - Campaigns (Open)
CryoVEx 2007
Following the successful 2004, 2005 and 2006 campaigns, the CryoVEx2007 campaign took place in Svalbard from 15 to 25 April 2007.
Data - Campaigns (Open)
CryoVEx 2006
CryoSat Validation Experiment (CryoVEx) 2006 was carried out between 18 April and 18 May 2006 in the Arctic.
Data - Campaigns (Open)
CryoVEx 2005
CryoVEx 2005 was the third combined airborne and surface campaign for the preparation of the CryoSat mission. It followed the 2004 campaign, which first utilised the new ASIRAS radar.