- All Categories (8794)
- Data (5)
- News (14)
- Missions (1)
- Events (20)
- Tools (6)
- Activities (7)
- Campaigns (1)
- Documents (8740)
DATA
Discover and download the Earth observation data you need from the broad catalogue of missions the European Space Agency operate and support.
Data - Announcement of Opportunity (Restrained)
Announcement of Opportunity for G-POD
ESA is offering all scientists the possibility to perform bulk processing and/or validation of their own algorithms exploiting the large ESA Earth-observation archive.
Data - EO Sign In Authentication (Open)
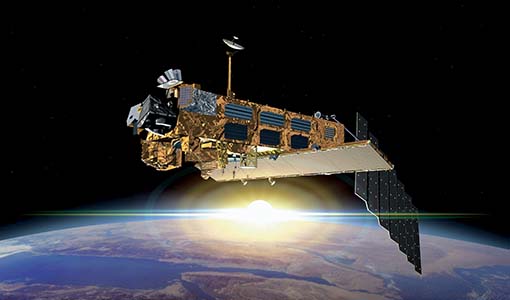
Envisat MIPAS L1 - Geo-located and calibrated atmospheric spectra [MIP_NL__1P]
This MIPAS Level 1 data product covers the geo-located, spectrally and radiometrically calibrated limb emission spectra in the 685-2410 cm-1 wave number range. It comprises 5 bands: 685-980 cm-1, 1010-1180 cm-1, 1205-1510 cm-1, 1560-1760 cm-1, 1810-2410 cm-1 and covers the following spatial ranges: Tangent height range: 5 to 170 km Pointing range: (azimuth pointing range relative to satellite velocity vector): 160° - 195° (rearward anti-flight direction); 80° - 110° (sideward anti-Sun direction). The instantaneous field of view (IFOV) is 0.05230 (elevation) x 0.5230 (azimuth)°. The length of measurement cell for an individual height step is approximately 300-500 km (dependent on tangent height and optical properties of the atmosphere). The spectral resolution spans from 0.030 to 0.035 cm-1, with a radiometric sensitivity of 4.2 to 50 nW / cm-1 / sr / cm2. The resolution range of the dataset is: 3 km (vertical) x 30 km (horizontal) at the tangent point. Please consult the Product Quality Readme file for MIPAS Level 1b IPF 8.03 before using the data.
Data - EO Sign In Authentication (Open)
Envisat MIPAS L2 - Temperature, pressure and atmospheric constituents profiles [MIPAS_2PS/2PE]
This MIPAS Level 2 data product describes localised vertical profiles of pressure, temperature and 21 target species (H2O, O3, HNO3, CH4, N2O, NO2, CFC-11, ClONO2, N2O5, CFC-12, COF2, CCL4, HCN, CFC-14, HCFC-22, C2H2, C2H6, COCl2, CH3Cl, OCS and HDO). It has a global coverage of Earth's stratosphere and mesosphere at all latitudes and longitudes. The vertical resolution of p, T and VMR profiles varies from 3 to 4 km, whereas the horizontal resolution is approximately 300 km to 500 km along track. This depends on the tangent height range and optical properties of the atmosphere. Auxiliary data include spectroscopic data, microwindows data, validation data, initial guess p, T and trace gas VMR profiles. The resolution range of the dataset is: 3 km (vertical) x 30 km (horizontal) at the tangent point. The latest reprocessed MIPAS Level 2 data (v8.22) is available as Standard products (MIPAS_2PS): A complete product containing 22 MIPAS L2 chemical species covering a single orbit and single species providing information generally needed by data users. Extended products (MIPAS_2PE): A complete product containing 22 MIPAS L2 chemical species covering a single orbit and single species intended for diagnostics and expert users who need complete information about the retrieval process. Both products are available in NetCDF format. Please refer to the MIPAS L2 v8.22 Product Quality Readme file for further details.
Data - External Data (Restrained)

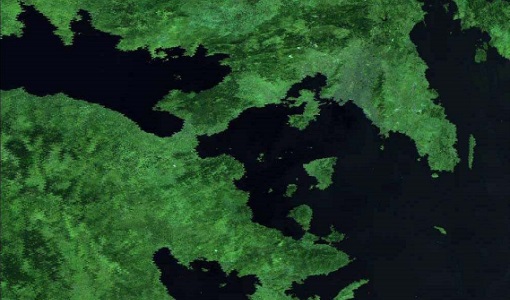
ADAM Surface Reflectance Database v4.0
ADAM enables generating typical monthly variations of the global Earth surface reflectance at 0.1° spatial resolution (Plate Carree projection) and over the spectral range 240-4000 nm. The ADAM product is made of gridded monthly mean climatologies over land and ocean surfaces, and of a companion API toolkit that enables the calculation of hyperspectral (at 1 nm resolution over the whole 240-4000 nm spectral range) and multidirectional reflectances (i.e. in any illumination/viewing geometry) depending on user choices. The ADAM climatologies that feed the ADAM calculation tools are: For ocean: Monthly chlorophyll concentration derived from SeaWiFS-OrbView-2 (1999-2009); it is used to compute the water column reflectance (which shows large spectral variations in the visible, but is insignificant in the near and mid infrared). Monthly wind speed derived from SeaWinds-QuikSCAT-(1999-2009); it is used to calculate the ocean glint reflectance. For land: Monthly normalized surface reflectances in the 7 MODIS narrow spectral bands derived from FondsdeSol processing chain of MOD09A1 products (derived from Aqua and Terra observations), on which relies the modelling of the hyperspectral/multidirectional surface (soil/vegetation/snow) reflectance. Uncertainty variance-covariance matrix for the 7 spectral bands associated to the normalized surface reflectance. For sea-ice: Sea ice pixels (masked in the original MOD09A1 products) have been accounted for by a gap-filling approach relying on the spatial-temporal distribution of sea ice coverage provided by the CryoClim climatology for year 2005.
Data - Campaigns (Open)
THERMOPOLIS
The THERMOPOLIS 2009 campaign mainly served the DUE “Urban Heat islands (UHI) and Urban Thermography (UT) Project”