- All Categories (41310)
- Data (37)
- News (149)
- Missions (20)
- Events (49)
- Tools (6)
- Activities (10)
- Campaigns (11)
- Documents (41028)
DATA
Discover and download the Earth observation data you need from the broad catalogue of missions the European Space Agency operate and support.
Data - Fast Registration with immediate access (Open)
TanSat AGCS and CAPI products
The Atmospheric Carbon-dioxide Grating Spectrometer (ACGS) instrument is pushbroom spectrometer operating in NIR and SWIR bands which allows the measuring of CO2 mole fraction. The available ACGS products have a temporal coverage between March 2017 and January 2020 (not all days included in the time frame): L1A DS: Sample Dark Calibration sample product L1A GL: Sample Glint Sample products L1A LS: Sample Lamp Calibration sample product L1A ND: Principal-Plane Nadir Sample product L1A ZS: Sample Z-Axis Solar Calibration Sample L1B CAL DS: Sample Dark Calibration product L1B CAL LS: Sample Lamp Calibration product L1B CAL ZS: Sample Z-Axis Solar Calibration product L1B SCI GL: Sample Glint Science product L1B SCI ND: Principal-Plane Nadir Science product. The Cloud Aerosol Polarization Imager (CAPI) is a pushbroom radiometer in VIS, NIR and SWIR bands for the observation of aerosols and clouds optical properties. The CAPI products are available in a time range from July 2019 and January 2020 (not all days included in the time frame): L1A ND: Principal-Plane Nadir product L1B ND 1000M: Principal-Plane Nadir products at 1000 m resolution (1375 nm, 1640 nm) L1B ND 250M: Principal-Plane Nadir products at 250 m resolution (380 nm, 670 nm, 870 nm) L1B ND GEOQK: Principal-Plane Nadir georeferenced at 250 m resolution L1B ND GEO1K: Principal-Plane Nadir georeferenced at 1000 m resolution L1B ND OBC: Principal-Plane Nadir on-board calibrator product L2 ND CLM: Principal-Plane Nadir cloud flag product.
Data - External Data (Restrained)

SciSat-1: ACE-FTS and MAESTRO
SCISAT-1 data aim at monitoring and analysing the chemical processes that control the distribution of ozone in the upper troposphere and stratosphere. It provides acquisitions from the two instruments MAESTRO and ACE-FTS. MAESTRO: Measurement of Aerosol Extinction in the Stratosphere and Troposphere Retrieved by Occultation. Dual-channel optical spectrometer in the spectral region of 285-1030 nm. The objective is to measure ozone, nitrogen dioxide and aerosol/cloud extinction (solar occultation measurements of atmospheric attenuation during satellite sunrise and sunset with the primary objective of assessing the stratospheric ozone budget). Solar occultation spectra are being used for retrieving vertical profiles of temperature and pressure, aerosols, and trace gases (O3, NO2, H2O, OClO, and BrO) involved in middle atmosphere ozone distribution. The use of two overlapping spectrometers (280 - 550 nm, 500 - 1030 nm) improves the stray-light performance. The spectral resolution is about 1-2 nm. ACE-FTS: Fourier Transform Spectrometer. The objective is to measure the vertical distribution of atmospheric trace gases, in particular of the regional polar O3 budget, as well as pressure and temperature (derived from CO2 lines). The instrument is an adapted version of the classical sweeping Michelson interferometer, using an optimised optical layout. The ACE-FTS measurements are recorded every 2 s. This corresponds to a measurement spacing of 2-6 km which decreases at lower altitudes due to refraction. The typical altitude spacing changes with the orbital beta angle. For historical reasons, the retrieved results are interpolated onto a 1 km "grid" using a piecewise quadratic method. For ACE-FTS version 1.0, the results were reported only on the interpolated grid (every 1 km from 0.5 to 149.5 km). For versions 2.2, both the "retrieval" grid and the "1 km" grid profiles are available. SCISAT-1 collection provides ACE-FTS and MAESTRO Level 2 Data. As of today, ACE-FTS products are available in version 4.1, while MAESTRO products are available in version 3.13.
Data - External Data (Restrained)
PROBA-V 1 km, 333 m, and 100 m products
The PROBA-V VEGETATION Raw products and Synthesis products provided coverage of all significant landmasses worldwide with, in the case of a 10-day synthesis product, a minimum effect of cloud cover, resulting from selection of cloud-free acquisitions during the 10-day period. It provided a daily coverage between Latitudes 35°N and 75°N, and between 35°S and 56°S, and a full coverage every two days at the equator. The VEGETATION instrument was pre-programmed with an indefinite repeated sequence of acquisitions. This nominal acquisition scenario allowed a continuous series of identical products to be generated, with the goal to map land cover and vegetation growth across the entire planet every two days. Level Synthesis Resolution resolution (m) Reflectance Level-1C n/a TOA Level-2A n/a 100 m TOA 333 m TOA 1 km TOA Level-3 S1 100 m TOA TOC TOC NDVI 333 m TOA TOC 1 km TOA TOC S5 100 m TOA TOC TOC NDVI S10 333 m TOC TOC NDVI 1 km TOC TOC NDVI Raw Products Overview Product Description Level-1C Level-1C segments (P – product): Radiometrically corrected Level-1B data, in raw sensor geometry (unprojected) Contains: - Top Of Atmosphere reflectance in the four spectral bands - Longitude/latitude information for every pixel - Geometric viewing conditions - Information on the status map (indicating missing and interpolated measurements). Format: HDF5 & GeoTiFF Level-2A Level-2A segment: projected Level-1C (P–product) data, radiometrically and geometrically corrected. Contains: - TOA reflectance values in the four spectral bands without atmospheric correction being performed - Information on the status map (containing identification of radiometric quality, snow, ice, shadow, clouds, land/sea for every pixel) - Geometric viewing conditions Plate carrée projection (EPSG:4326) with spatial resolution of 100 m, 333 m and 1 km Format: HDF5 & GeoTiFF Synthesis Products Overview Level-3 S1 = daily, S5 = 5 days, S10 = decade Different spatial resolution: 100 m, 333 m and 1 km Divided into so called granules, each measuring 10 degrees x 10 degrees, each granule being delivered as a single file Plate carrée projection (EPSG:4326) Format: HDF5 & GeoTiFF Products Content TOA - Top Of Atmosphere reflectance in the four spectral bands (no atmospheric correction applied) - Normalized Difference Vegetation Index (NDVI) -Information on the composite status map (containing identification of snow, ice, shadow, clouds, land/sea for every pixel) - Geometric viewing conditions & date and time of selected measurement TOC Level-2A segment: projected Level-1C (P–product) data, radiometrically and geometrically corrected. Contains: - Top Of Canopy (ground surface) reflectance in the four spectral bands, the atmospheric correction being performed using the SMAC (Simplified Method for Atmospheric Corrections) algorithm - Normalized Difference Vegetation Index (NDVI) - Information on the composite status map (containing identification of snow, ice, shadow, clouds, land/sea for every pixel) Normalized Difference Vegetation Index (NDVI) from Top Of Canopy product (SMAC algorithm for atmospheric corrections applied) - Geometric viewing conditions & date and time of selected measurement TOC NDVI Normalized Difference Vegetation Index (NDVI) from Top Of Canopy product (SMAC algorithm for atmospheric corrections applied)
Data - Project Proposal (Restrained)
NovaSAR-1 new tasking
NovaSAR-1 new acquisition data are available in two baseline acquisition modes: Stripmap – provides the highest resolution of 6 metres with up to 20 km swath selected from a 150 km field of regard, available in single polarisation. ScanSAR – has a 20 - 30 metre resolution and up to 150 km swath. Available in single polarisation. Within each of the baseline modes there are a variety of mode options that vary according to ground range resolution, incidence angles, swath width and the number of looks: Acquisition Mode Polarisation Resolution (m) Swath Width (km) Incidence Angles Number of Looks Stripmap Single: HH 6 20 16.0 – 25.38° 3 (1 range, 3 azimuth) 13 – 20 21.29 – 31.2° Single: VV 6 20 16.0 – 25.38° 3 (1 range, 3 azimuth) 13 – 20 21.29 – 31.2° ScanSAR Single: HH 20 100 15.0 - 24.66° 4 (2 range, 2 azimuth) 50 24.51 - 28.94° Single: VV 20 100 15.0 – 24.66° 4 (2 range, 2 azimuth) 50 24.51 - 28.94° Single: HH 30 150 11.29 – 25.93° 4 (2 range, 2 azimuth) 55 27.35 - 32.01° Single: VV 30 150 11.29 – 25.93° 4 (2 range, 2 azimuth) 55 27.35 - 32.01° NovaSAR-1 data are provided as a Level 2 (ARD) product as standard, but the accompanying Level 1 data may also be requested. Level 1 – delivered as reconstructed, unprocessed instrument data at full resolution. Level 2 (ARD) – delivered as a processed product with applied radiometric and geometric corrections i.e. orthorectification and spatial registration: Geocoded Ellipsoid Corrected (GEC) – Maritime and ocean applications Geocoded Terrain Corrected (GTC) – Land applications and change detection Where available, associated automatic identification system (AIS) data may be requested alongside the NovaSAR-1 data products.
Data - Fast Registration with immediate access (Open)
GOSAT-2 TANSO FTS-2 and CAI-2 full archive and new products
The TANSO-FTS-2 (Thermal And Near infrared Sensor for carbon Observation - Fourier Transform Spectrometer-2) instrument is an high-resolution 5-bands (NIR and TIR) spectrometer which allows the observation of reflective and emissive radiative energy from Earth's surface and the atmosphere for the measurement of atmospheric chemistry and greenhouse gases. The TANSO-CAI-2 (Thermal And Near infrared Sensor for carbon Observation - Cloud and Aerosol Imager-2) instrument is a push-broom radiometer in the spectral ranges of ultraviolet (UV), visible (VIS), Near Infrared (NIR) and SWIR (5 bands observe in the forward direction and 5 in backwards direction, with LOS tilted of 20 degrees) for the observation of aerosols and clouds optical properties and for monitoring of air pollution. The GOSAT-2 available products are: FTS-2 Level 1A products contain interferogram data observed by FTS-2, together with geometric information of observation points and various telemetry. In addition, data from an optical camera (CAM) near the observation time are also stored. Two different products for day and night observations. Common data contain common information for SWIR/TIR including CAM data; SWIR data contain information from SWIR band; TIR data contain information from TIR band FTS-2 level 1B products contain spectrum data, which are generated by Fourier transformation and other corrections to raw interferogram data in L1A. The sampled CAM data near the observation time are also stored. Two different products for day and night observations. Common data contain common information for SWIR/TIR including CAM data; SWIR products for SWIR spectrum data before and after sensitivity correction; TIR products for TIR spectrum data after sensitivity correction using blackbody and deep space calibration data and after correction of finite field of view FTS-2 NearRealTime products: FTS-2 data are first processed with predicted orbit file and made immediately available: NRT product does not include monitor camera image, best-estimate pointing-location, and target point classification but is available on the ESA server 5 hours after sensing. After a few days (usually 3 days), data is reprocessed with definitive orbit file and sent as consolidated product FTS-2 Level 2 products: Column-averaged Dry-air Mole Fraction" products store column-averaged dry-air mole fraction of atmospheric gases retrieved by using Band 1-3 spectral radiance data in TANSO-FTS-2 L1B; "Chlorophyll Fluorescence and Proxy Method (FTS-2_02_SWPR)" products store solar induced chlorophyll fluorescence data retrieved from Band 1 spectral radiance data in L1B Product as well as column-averaged dry-air mole fraction of atmospheric gases retrieved from Band 2 and 3 spectral radiance data in L1B Product. Both products are obtained by using the fill-physic maximum a posteriori (MAP) method and under the assumption of of clear-sky condition CAI-2 Level 1A products contain uncorrected image data of TANSO-CAI-2, which is stored as digital number together with telemetry of geometric information at observation point, orbit and attitude data, temperature, etc. One scene is defined as a satellite revolution data starting from ascending node to the next ascending node. Common data contain common information for both Forward looking and Backward looking; FWD products contain information for Forward looking bands, from 1 to 5; BWD products contain information for Backward looking bands, from 6 to 10 CAI-2 Level 1B products contain spectral radiance data per pixel converted from TANSO-CAI-2 L1A Products. Band-to-band registration of each forward- and backward- viewing band is applied; ortho-correction is performed to observation location data based on an earth ellipsoid model using digital elevation model data CAI-2 Level 2 products: Cloud Discrimination Products stores clear-sky confidence levels per pixel, which are calculated by combining the results of threshold tests for multiple features such as reflectance ratio and Normalized Difference Vegetation Index (NDVI), obtained from spectral radiance data in GOSAT-2 TANSO-CAI-2 L1B Product. This product also stores cloud status bit data, in which results of individual threshold tests and quality flags are summarized. The full ESA archive and newly acquired/systematically processed GOSAT2 FTS-2 and CAI-2 products are (ESA collection name versus JAXA product name): FTS-2 L1A Common day (FTS-2_1A_COMMON_DAY) FTS-2 L1A Common night (FTS-2_1A_COMMON_NIGHT) FTS-2 L1A SWIR day (FTS-2_1A_SWIR_DAY) FTS-2 L1A TIR day (FTS-2_1A_TIR_DAY) FTS-2 L1A TIR night (FTS-2_1A_TIR_NIGHT) FTS-2 L1B Common day (FTS-2_1B_COMMON_DAY) FTS-2 L1B Common night (FTS-2_1B_COMMON_NIGHT) FTS-2 L1B SWIR day (FTS-2_1B_SWIR_DAY) FTS-2 L1B TIR day (FTS-2_1B_TIR_DAY) FTS-2 L1B TIR night (FTS-2_1B_TIR_NIGHT) FTS-2 L2 Column-averaged Dry-air Mole Fraction (FTS-2_0) FTS-2 L2 Chlorophyll Fluorescence and Proxy Method (FTS-2_02_SWPR) CAI-2 L1A Common (CAI-2_1A_COMMON) CAI-2 L1A Forward viewing (CAI-2_1A_FWD) CAI-2 L1A Backward viewing (CAI-2_1A_BWD) CAI-2 L1B (CAI-2_1B).
Data - Fast Registration with immediate access (Open)
GOSAT TANSO FTS and CAI full archive and new products
The TANSO-FTS instrument on-board GOSAT satellite features high optical throughput, fine spectral resolution, and a wide spectral coverage (from VIS to TIR in four bands). The reflective radiative energy is covered by the VIS and SWIR (Shortwave Infrared) ranges, while the emissive portion of radiation from Earth's surface and the atmosphere is covered by the MWIR (Midwave Infrared) and TIR (Thermal Infrared) ranges. These spectra include the absorption lines of greenhouse gases such as carbon dioxide (CO2) and methane (CH4). The TANSO-CAI instrument on-board GOSAT satellite is a radiometer in the spectral ranges of ultraviolet (UV), visible, and SWIR to correct cloud and aerosol interference. The imager has continuous spatial coverage, a wider field of view, and higher spatial resolution than the FTS in order to detect the aerosol spatial distribution and cloud coverage. Using the multispectral bands, the spectral characteristics of the aerosol scattering can be retrieved together with optical thickness. In addition, the UV-band range observations provide the aerosol data over land. With the FTS spectra, imager data, and the retrieval algorithm to remove cloud and aerosol contamination, the column density of the gases can be the column density of the gases can be retrieved with an accuracy of 1%. The full ESA archive and newly acquired/systematically processed GOSAT FTS and CAI products are available in the following processing levels: FTS Observation mode 1 L1B, day (FTS_OB1D_1) FTS Observation mode 1 L1B, night (FTS_OB1N_1) FTS Special Observation L1B, day (FTS_SPOD_1) FTS Special Observation L1B, night (FTS_SPON_1) FTS L2 CO2 profile, TIR (FTS_P01T_2) FTS L2 CH4 profile, TIR (FTS_P02T_2) FTS L2 CH4 column amount, SWIR (FTS_C02S_2) FTS L2 CO2 column amount, SWIR (FTS_C01S_2) FTS L2 H2O column amount, SWIR (FTS_C03S_2) FTS L3 global CO2 distribution, SWIR (FTS_C01S_3) FTS L3 global CH4 distribution, SWIR (FTS_C02S_3) FTS L4A global CO2 flux, annual in text format (FTS_F01M4A) FTS L4A global CO2 flux, annual in netCDF format (FTS_F03M4A) FTS L4A global CO2 distribution (FTS_P01M4B) FTS L4A global CH4 flux, annual in text format (FTS_F02M4A) FTS L4A global CH4 flux, annual in netCDF format (FTS_F04M4A) FTS L4A global CH4 distribution (FTS_P02M4B) CAI L1B data (CAI_TRB0_1) CAI L1B+ (CAI_TRBP_1) CAI L2 cloud flag (CAI_CLDM_2) CAI L3 global reflect. distrib. clear sky (CAI_TRCF_3) CAI L3 global radiance distrib. all pixels (CAI_TRCL_3) CAI L3 global NDVI (CAI_NDVI_3). All products are made available as soon as processed and received from JAXA. To satisfy NearRealTime requirements, ESA also provides access to the FTS L1X products, which are the NRT version of FTS L1B products. The main difference between L1X and L1B is that L1X does not include CAM data, best-estimate pointing-location, and target point classification, but most of all the L1X products are available on the ESA server between 2 and 5 hours after acquisition. The L1X products remains on the FTP server for 5 days, the time for the corresponding L1B to be available. A document describing the differences between L1X and L1B products is listed in the available resources. For more details on products, please refer to below product specifications.
Data - Fast Registration with immediate access (Open)
GOME Total Column Water Vapour Climate product
The GOME Total Column Water Vapour (TCWV) Climate product was generated by the Max Planck Institute for Chemistry (MPIC), and the German Aerospace Center (DLR) within the ESA GOME-Evolution project. It is a Level 3 type product containing homogenized time-series of the global distribution of TCWV spanning over more than two decades (1995-2015). The data is provided as single netCDF file, containing monthly mean TCWV (units kg/m2) with 1-degree resolution, and is based on measurements from the satellite instruments ERS-2 GOME, Envisat SCIAMACHY, and MetOp-A GOME-2. Details are available in the paper by Beirle et al, 2018. Please also consult the GOME TCWV Product Quality Readme file before using the data.
Data - Project Proposal (Restrained)
GHGSat archive and tasking
GHGSat data produce measures of vertical column densities of greenhouse gas emissions ((currently CH4, but eventually CO2), provided on a pre-defined area of 12 km x 12 km, from the full sensor field-of-view. GHGSat Catalogue and New Collect data are available in three different data types: Single Observation: a single observation of a scene. Monthly Monitoring: guaranteed 12 successful observations in a year over a given site (once per month or flexible best effort cadence depending on weather). Weekly Monitoring: guaranteed 52 successful observations in a year over a given site (once a week or flexible best effort cadence based on weather), to accommodate large & persistent monitoring needs. Data are provided as an Emissions package containing the following products: Abundance dataset (Level 2): Set of per-pixel abundances in excess of the local background (ppb) for a single species, and per-pixel measurement error expressed as a standard deviation for a single site on a single satellite pass. Data format is 16-bit GeoTIFF. Concentration Maps (Level 2): High readability pseudocolour map combining surface reflectance, and column density expressed in ppb for a single species in PNG format. The relevant abundance dataset is provided as well. Emission Rates (Level 4): Instantaneous rate for a detected emission from a targeted source estimated using abundance datasets from a single satellite pass and applying dispersion modelling techniques. The delivered product includes the emission rate estimate with uncertainty and key dispersion parameters (in CSV format) as well as the abundance dataset used for the emission estimate. This product is only delivered in the Emissions package if an emission is detected within the abundance dataset. The Level 2 products will be delivered regardless of whether or not an emission is detected. The properties of available products are summarised in the table. Band(s) / Beam Mode(s) and Polarisation SWIR (1635-1675 nm), multiple bands, unpolarised Spatial Resolution <30 m Scene size 12 km x 12 km Species Measured CH4 Geometric Corrections Radial distortion, perspective projection Radiometric Corrections Detector pixel response, ghosting, spectral response, atmospheric correction including trace gas modelling and surface reflectance Details about the data provision, data access conditions and quota assignment procedure are described in the GHGSat Terms of Applicability.
Data - Fast Registration with immediate access (Open)
ERS-2 GOME Total Column Amount of Trace Gases Product
GOME Level 2 products were generated by DLR on behalf of the European Space Agency, and are the end result of the Level 1 to 2 reprocessing campaign of GOME Level 1 version 4 data with Level 2 GOME Data Processor (GDP) version 5.0 (HDF-5 format). The GOME Level 2 data product comprises the product header, total column densities of ozone and nitrogen dioxide and their associated errors, cloud properties and selected geo-location information, diagnostics from the Level 1 to 2 algorithms and a small amount of statistical information.
Data - Fast Registration with immediate access (Open)
ERS-2 GOME Spectral Product L1
GOME Level 1 products contain Earthshine radiance at the Top of the Atmosphere and solar irradiance spectra. They were generated by DLR on behalf of the European Space Agency with Level 1 GOME Data Processor (GDP-L1) starting from the Extracted GOME Calibration (EGOC) Level 0 data files. Originally raw detector signals (binary Analog to Digital Converted units) of the science measurements plus calibration constants were provided (dataset version 4 and lower), but following the end of the operational phase of the ERS-2 mission (2 July 2011), as part of ESA's post-operational algorithm improvement activities (Coldewey-Egbers et al., 2018), the GOME Level 1 data type was entirely revised and a dataset of fully calibrated and ready to use data was generated with GOME processor version 5.1. The version 5.1 data bring relevant quality improvements for the revised calibration approach, compensating aging and instrument degradation, and provide enhanced accessibility. The version 5.1 data are in NetCDF format and differ fundamentally from the previous GOME Level 1 data, having the Envisat proprietary format and basically containing Level 1a data where a dedicated extraction software tool had to be applied by end user to obtain spectrally and radiometrically calibrated radiances (including the correction for polarisation, leakage current and stray light). Such calibrations are now applied to the version 5.1 L1b data product in the standard processing. Users of GOME Level 1 products are strongly recommended to migrate to the latest reprocessed dataset. Please consult the GOME Product Quality Readme file before using the data.
Data - Fast Registration with immediate access (Open)
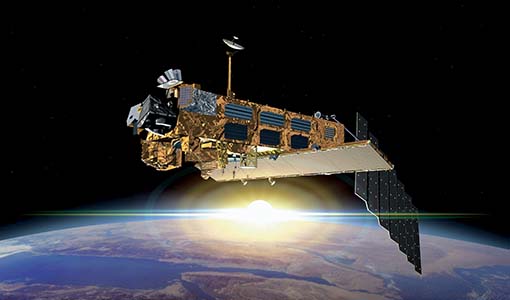
Envisat SCIAMACHY Total column densities and stratospheric profiles [SCI_OL__2P]
The data product provides global column distributions and stratospheric profiles of various trace gases. Total column densities of O3, NO2, OClO, H2O, SO2, BrO, CO, HCHO, CHOCHO and CH4 are retrieved from Nadir measurements. Additional cloud parameters (fractional cloud coverage, cloud-top height, cloud optical thickness) and an aerosol absorption indicator are enclosed. Stratospheric profiles of O3, NO2, and BrO are derived from limb measurements and with flagging information for cloud-types. Tropospheric NO2 columns are retrieved combining limb and nadir measurements. The latest Level 2 dataset is Version 6.01.
Data - Fast Registration with immediate access (Open)
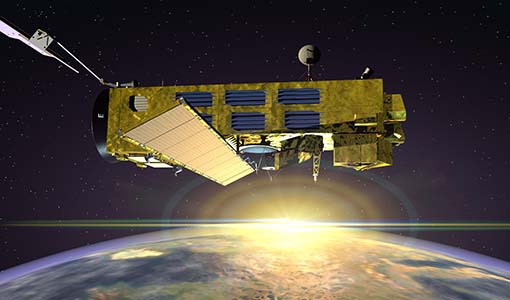
Envisat SCIAMACHY Geo-located atmospheric spectra [SCI_NL__1P]
This data product covers geo-located, radiometrically and spectrally calibrated limb and nadir radiance spectra for Nadir, Limb, and Occultation measurements with additional monitoring and calibration measurements. The Level 1b product is the lowest level of SCIAMACHY data delivered to the users. The instrument Instantaneous Field of View (IFoV) is approximately 0.045 deg (scan direction) x 1.8 deg (flight direction). This corresponds to a ground pixel size of 25 km x 0.6 km at the sub-satellite point (nadir) and of 103 km x 2.6 km at the Earth's horizon (limb). Nadir measurements have a maximum swath width of 960 km (in scan direction) and a typical footprint of 30 km (along track) x 60 km (across track). Limb measurements have a tangent height range spanning from 0 to 100 km with 3 km vertical resolution. Azimuth scans are performed for constant elevation angle, typically 34 elevation steps per limb scan. Maximum azimuth range is +/- 44 deg relative to S/C velocity (Note that the azimuth range is adjusted to observe the same atmospheric volume as for nadir measurements within five minutes). The radiometric resolution is 16 bits, with a spectral resolution of 0.24 nm to 1.5 nm, depending on the spectral range. The Sun normalized radiometric accuracy is 2 to 3% in unpolarized light, and 3 to 4% in polarized light. The relative radiometric accuracy is less than 1% and the spectral accuracy spans form 0.005 nm to 0.035 nm. Individual measurements from dedicated monitoring states include: Sun over diffuser Subsolar calibration Spectral lamp measurements White light source measurements Elevation mirror monitoring (Sun/Moon) ADC calibration Level 1b products are corrected for degradation applying a scan mirror model and m-factors. The latest Level 1b dataset is version 8.0X.
Data - EO Sign In Authentication (Open)
Envisat MIPAS L2 - Temperature, pressure and atmospheric constituents profiles [MIPAS_2PS/2PE]
This MIPAS Level 2 data product describes localised vertical profiles of pressure, temperature and 21 target species (H2O, O3, HNO3, CH4, N2O, NO2, CFC-11, ClONO2, N2O5, CFC-12, COF2, CCL4, HCN, CFC-14, HCFC-22, C2H2, C2H6, COCl2, CH3Cl, OCS and HDO). It has a global coverage of Earth's stratosphere and mesosphere at all latitudes and longitudes. The vertical resolution of p, T and VMR profiles varies from 3 to 4 km, whereas the horizontal resolution is approximately 300 km to 500 km along track. This depends on the tangent height range and optical properties of the atmosphere. Auxiliary data include spectroscopic data, microwindows data, validation data, initial guess p, T and trace gas VMR profiles. The resolution range of the dataset is: 3 km (vertical) x 30 km (horizontal) at the tangent point. The latest reprocessed MIPAS Level 2 data (v8.22) is available as Standard products (MIPAS_2PS): A complete product containing 22 MIPAS L2 chemical species covering a single orbit and single species providing information generally needed by data users. Extended products (MIPAS_2PE): A complete product containing 22 MIPAS L2 chemical species covering a single orbit and single species intended for diagnostics and expert users who need complete information about the retrieval process. Both products are available in NetCDF format. Please refer to the MIPAS L2 v8.22 Product Quality Readme file for further details.
Data - EO Sign In Authentication (Open)
Envisat MIPAS L1 - Geo-located and calibrated atmospheric spectra [MIP_NL__1P]
This MIPAS Level 1 data product covers the geo-located, spectrally and radiometrically calibrated limb emission spectra in the 685-2410 cm-1 wave number range. It comprises 5 bands: 685-980 cm-1, 1010-1180 cm-1, 1205-1510 cm-1, 1560-1760 cm-1, 1810-2410 cm-1 and covers the following spatial ranges: Tangent height range: 5 to 170 km Pointing range: (azimuth pointing range relative to satellite velocity vector): 160° - 195° (rearward anti-flight direction); 80° - 110° (sideward anti-Sun direction). The instantaneous field of view (IFOV) is 0.05230 (elevation) x 0.5230 (azimuth)°. The length of measurement cell for an individual height step is approximately 300-500 km (dependent on tangent height and optical properties of the atmosphere). The spectral resolution spans from 0.030 to 0.035 cm-1, with a radiometric sensitivity of 4.2 to 50 nW / cm-1 / sr / cm2. The resolution range of the dataset is: 3 km (vertical) x 30 km (horizontal) at the tangent point. Please consult the Product Quality Readme file for MIPAS Level 1b IPF 8.03 before using the data.
Data - Fast Registration with immediate access (Open)

Envisat GOMOS Level 2 - Residual extinction [GOM_EXT_2P]
Re-computed transmission spectra corrected for scintillation and dilution effects, before and after inversion. Coverage is as follows: Elevation range: +62 deg to +68 deg Azimuth range: +90 deg to +190 deg (with respect to the flight direction). The file size is 1 Mbyte per occultation, depending on the duration of the occultation.
Data - Fast Registration with immediate access (Open)
Envisat GOMOS Level 2 - Atmospheric constituents profiles [GOM_NL__2P]
This data product describes atmospheric constituents profiles. In particular the vertical and line density profiles of ozone, NO2, NO3, O2, H2O, air, aerosols, temperature, turbulence. Coverage is as follows: Elevation range: +62 deg to +68 deg Azimuth range: +90 deg to +190 deg (with respect to the flight direction). The file size is 1 Mbyte per occultation, depending on the duration of the occultation.
Data - Fast Registration with immediate access (Open)
Envisat GOMOS Level 2 - Atmospheric constituents profiles - User Friendly Product [GOMOS_UFP]
This data product describes atmospheric constituents profiles: In particular the vertical and line density profiles of ozone, NO2, NO3, O2, H2O, air, aerosols, temperature, turbulence. Coverage is as follows: Elevation range: +62 deg to +68 deg Azimuth range: +90 deg to +190 deg (with respect to the flight direction) The GOMOS data are now also available as user friendly products in the NetCDF4-format. These products are occultation based (dark and bright) and include all GOMOS Level 2 constituent profiles (O3, NO2, NO3, O2, H2O, air and aerosols) and HRTP profiles with all the essential parameters as in the original Envisat data set format.
Data - Fast Registration with immediate access (Open)
Envisat GOMOS Level 2 - Atmospheric constituents profiles - Gridded User Friendly Product [GOMOS_UFP_gridded]
This data product describes atmospheric constituents profiles: In particular the vertical and line density profiles of ozone, NO2, NO3, O2, H2O, air, aerosols, temperature, turbulence. Coverage is as follows: Elevation range: +62° to +68° Azimuth range: +90° to +190° (with respect to the flight direction). The GOMOS data are now also available as user friendly products in the NetCDF4-format. These files are Level 2 constituent profiles and are altitude gridded. These Level 2 files include quality flags and are based and collected on a yearly basis.
Data - Fast Registration with immediate access (Open)
Envisat GOMOS Level 1b - Limb spectra [GOM_LIM_1P]
This data product describes localised calibrated upper and lower background limb spectra (flat-field corrected, with and without stray light). Coverage is as follows: Elevation range: C25+62 deg to +68 deg Azimuth range: +90 deg to +190 deg (with respect to the flight direction). The file size is Mbytes per occultation, depending on the duration of the occultation.
Data - Fast Registration with immediate access (Open)
Envisat GOMOS Geolocated Calibrated Transmission Spectra and Photometer Fluxes [GOM_TRA_1P]
This data product describes the geolocated and calibrated transmission spectra products, containing the full transmission and the covariance spectra needed for Level 2 processing. Coverage is as follows: Elevation range: +62 deg to +68 deg Azimuth range: +90 deg to +190 deg (with respect to the flight direction). The file size is 1 MB per occultation, depending on the duration of the occultation.