- All Categories (1134)
- Data (14)
- News (57)
- Missions (2)
- Events (22)
- Tools (13)
- Activities (4)
- Campaigns (4)
- Documents (1018)
DATA
Discover and download the Earth observation data you need from the broad catalogue of missions the European Space Agency operate and support.
Data - Project Proposal (Restrained)

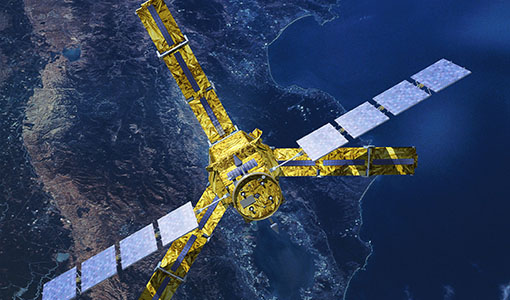
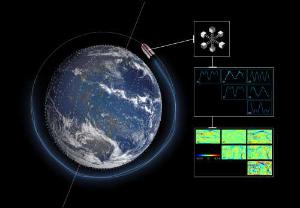
Spire live and historical data
The data collected by Spire from it's 110 satellites launched into Low Earth Orbit (LEO) has a diverse range of applications, from analysis of global trade patterns and commodity flows to aircraft routing to weather forecasting. The data also provides interesting research opportunities on topics as varied as ocean currents and GNSS-based planetary boundary layer height. The following products can be requested: ADS-B Data Stream Global ADS-B satellite data observed by Spire satellites and processed through the ground stations network. Historical ADS-B data older than 6 months can be delivered as data cuts containing CSV file(s) accessible through a Web Service or Cloud storage solutions. Live ADS-B data is available through a streaming API, and recent historical data can be accessed through a REST API. Data is distributed as a monthly subscription: historical data can be requested starting from 3 December 2008, the time period for live data starts from a user-defined date and continues for 30 days AIS AIS messages include satellite AIS (S-AIS) as observed by Spire satellites and terrestrial AIS (T-AIS) from third party sensor stations (up to 40 million messages per day). Historical AIS data are delivered as a cvs file with availability back to June 2016 or via Historical API from December 2018; live AIS data are pushed to end users via TCP or through Messages API. Data is distributed as a monthly subscription, from a user-defined date and continues for a 30 day period. GNSS-Radio Occultation GNSS Radio Occultation (GNSS-RO) measurements are collected globally on a continuous basis, generating profiles of the Earth’s atmosphere. Derived Level 1 and Level 2 products include both atmospheric and ionospheric products. Historical data for most of the GNSS-RO products are available from December 2018 to the present. Near real-time (within 90 minutes or less latency from collection to delivery) GNSS-RO profiles are also available upon request. GNSS Reflectometry GNSS Reflectometry (GNSS-R) is a technique to measure Earth’s surface properties using reflections of GNSS signals in the form of a bistatic radar. Spire collects two types of GNSS-R data: conventional, near-nadir incidence LHCP reflections collected by the Spire GNSS-R satellites (e.g., Spire GNSS-R “Batch-1” satellites) and grazing angle (i.e., low elevation angle) RHCP reflections collected by the Spire GNSS-RO satellites. Derived Level 1 and Level 2 products are available, as well as some special Level 0 raw intermediate frequency (IF) data. Historical grazing angle GNSS-R data are available from May 2019 to the present, while conventional GNSS-R data are available from December 2020 to the present. Name Description Data format and content Application Automatic Identification System (AIS) The automatic identification system (AIS) is an automatic tracking system that uses transponders on ships and is used by vessel traffic services. Spire data includes satellite AIS (S-AIS) as observed by Spire satellites and terrestrial AIS (T-AIS) from third party sensor stations. .parquet.gz files The AIS files contain time-series data on received AIS messages, both the raw NMEA message and added post-processing data for each message. Supply chain analysis, commodity trading, identification of illegal fishing or dark targets, ship route and fuel use optimization, analysis of global trade patterns, anti-piracy, autonomous vessel software, ocean currents Automatic Dependent Surveillance-Broadcast (ADS-B) Spire AirSafe ADS-B products give access to satellite and terrestrial ADS-B data from captured aircrafts. .csv.gz files The decompressed csv file contains a list of hexadecimal representations of ADS-B messages associated with the timestamp they were received on the satellite. Fleet management, ICAO regulatory compliance, route optimization, predictive maintenance, global airspace, domain awareness Global Navigation Satellite System Radio Occultation (GNSS-RO) GNSS atmospheric radio occultation (GNSS-RO) relies on the detection of a change in a radio signal as it passes through a planet's atmosphere, i.e. as it is refracted by the atmosphere. This data set contains precise orbit determination (POD) solutions, satellite attitude information, high-rate occultation observations, excess phase, and derived atmospheric dry temperature profiles. podObs*.rnx This file contains raw pseudorange, carrier phase, Doppler frequency, and signal-to-noise measurements for each observed GPS signal from a single Spire satellite which allow to estimate the positions and velocities of each Spire satellite and also used to derive ionospheric total electron content data. leoOrb*.sp3 This file contains the estimated position, velocity and receiver clock error of a given Spire satellite after processing of the POD observation file leoAtt*.log It contains 1 Hz rate quaternion information measured from a single Spire satellite describing the satellite orientation. opnGns*ro.bin, opnGns*rst.bin these files contain raw measurements from the occulting GNSS satellite (one for each signal frequency) and raw phase data from one or more reference GNSS satellites. atmPhs* The file contains occultation excess phase delay. Also contains SNR values, ransmitter and receiver positions and open loop model information atmPrf*.nc The file contains profiles of atmospheric dry pressure, dry temperature and neutral refractivity as a function of altitude produced from full processing of one occultation event. bfrPrf*.bufr The file contains derived profiles of dry pressure, dry temperature, refractivity and bending angle for each occultation. Atmospheric profiles of pressure, dry temperature, bending angle, and refractivity used in numerical weather prediction data assimilation and climate change studies. Raw IF samples from GNSS-RO satellites Raw intermediate frequency (IF) sampled data (I/Q) from the GNSS receiver front-end of GNSS-RO satellites. rocRIF*.zip Binary raw IF data and associated ancillary data (e.g., POD data) in a zip archive per collection event. GNSS-RO studies, GNSS RFI and jamming monitoring, research. Raw IF samples from GNSS-R satellites Raw intermediate frequency (IF) sampled data (I/Q) from the GNSS receiver front-end of conventional GNSS-R satellites. gbrRIF*.zip Binary raw IF data and associated ancillary data (e.g., POD data) in a zip archive per collection event. GNSS-R studies, GNSS RFI and jamming monitoring, research, etc. Grazing angle GNSS-R observations During grazing angle GNSS-R events, signal reflection at two frequencies is observed through the limb-facing antenna and is trackedusing an open-loop tracking technique thatrelies on a model topredict the propagationdelay and Doppler of thereflected signal. Simultaneous open-looptracking of the signaldirectly along theline-of-sight from thetransmitter to thereceiver is alsoperformed to provideadditional data that maybenecessary for signalcalibration. The mainoutput of the open-looptracking are in-phase (I)and quadrature (Q)accumulation samples(nominally at 50 Hz),which represent the residual Doppler (phase) from the model. grzObs*.nc L1A filecontains rawopen loopcarrier phasemeasurementsat 50 Hzsampling forgrazingangleGNSS-Rreflectionscaptured in the GNSS-RO RHC Pantennas, (bothdirect andreflectedsignals) on GNSS-RO satellites. Sea surface and sea ice height extent, and classification Georeferenced grazing angle GNSS-R observations The low-levelobservations of the high-rate grazing angle GNSS-R observationsbut withthegeoreferenced bistatic radar parameters of the satellite receiver,specular reflection, and GNSS transmitter included. grzRfl*.nc L1B file contains the georeferenced grazing angle GNSS-R data collected by Spire GNSS-RO satellites, including the low-level observables and bistatic radar geometries (e.g., receiver, specular reflection, and the transmitter locations). Sea surface and sea ice height extent, and classification GNSS-R calibrated bistatic radar reflectivities Higher level product used to derive land-surface reflectivity. gbrRfl*.nc L1A along-track calibrated relative power between reflected and direct signals (e.g., bistatic radar reflectivities) measured by Spire conventional GNSS-R satellites. GNSS-R studies, soil moisture, ocean wind, and sea ice applications GNSS-R calibrated bistatic radar cross-sections Higher level product used to derive ocean surface roughness products. gbrRCS*.nc L1B along-track calibrated and normalized bistatic radar cross-sections measured by Spire conventional GNSS-R satellites. GNSS-R studies, ocean wind and sea ice applications Combined Surface Soil Moisture Combined CYGNSS and SMAP soil moisture data are provided as a combined surface soil moisture (COMB-SSM) product in two data level formats: L2U1 and L3U1. 6 x 6 km grid cell. L-band measurements of surface soil moisture benefit from better vegetation penetration in comparison to traditional C-band measurements. COMB-SSM.nc This file contains the combined data product containing measurements from both CYGNSS and SMAP reported on a 6 km global Equi7Grid grid. Agriculture, crop insurance, farming solutions, climatology, terrain awareness, peatlands and wetlands monitoring etc Ionosphere total electron content Spire routinely collects and processes a large volume of total electron content (TEC) data, representing the line-of-sight integration of electron density between a Spire satellite and a GNSS satellite. Each file contains line-of-sight ionospheric total electron content (TEC) estimates derived for a ‘single viewing arc’ contained in the POD observation file. Viewing arcs are at least 10 minutes in duration. podTec*.nc This file contains the line-of-sight total electron content with associated orbital information. Space weather research, tsunamigenic earthquakes, weather applications, space situational awareness (SSA), autonomous vehicles etc Ionosphere scintillation The scintillation index for each GNSS frequency is computed onboard the spacecraft. This index provides a measure of the fluctuations of the GNSS signal over the course of 10 seconds caused by propagation of the radio signals through electron density irregularities in the ionosphere. After the raw indices are downlinked to the ground, they are packaged along with associated metadata such as orbit position to create the final scintillation data product. scnLv1*.nc This file contains on-board computed scintillation data (S4 only) with associated orbital information Space weather research, solar events, TIDs, weather applications positioning and navigation, communications etc Electron density profile Electron density profiles are retrieved as a function of altitude. Electron density profiles are processed from podTec netcdf files, which span a sufficient elevation angle range. A standard Abel inversion algorithm is applied to retrieve the profiles. ionPrf*.nc This file contains electron density profile retrieved from podTec files spanning appropriate elevation angle range Space weather research, solar events, TIDs, weather applications positioning and navigation, communications The products are available as part of the Spire provision with worldwide coverage. All details about the data provision, data access conditions and quota assignment procedure are described in the Terms of Applicability.
Data - EO Sign In Authentication (Open)
SMOS Tropical Cyclone Wind Radii Fixes
The SMOS WRF product is available in Near Real Time to support tropical cyclones (TC) forecasts. It is generated within 4 to 6 hours from sensing from the SMOS L2 swath wind speed products, in the so-called "Fix (F-deck)" format compatible with the US Navy's ATCF (Automated Tropical Cyclone Forecasting) System. The SMOS WRF "fixes" to the best-track forecasts contain: the SMOS 10-min maximum-sustained winds (in knots) and wind radii (in nautical miles) for the 34 kt (17 m/s), 50 kt (25 m/s) and 64 kt (33 m/s) winds per geographical storm quadrants, and for each SMOS pass intercepting a TC in all the active ocean basins.
Data - EO Sign In Authentication (Open)
SMOS - CryoSat L4 Sea Ice Thickness
The SMOS-CryoSat merged Sea Ice Thickness Level 4 product, in NetCDF format, is based on estimates from both the MIRAS and the SIRAL instruments with a significant reduction in the relative uncertainty for the thickness of the thin ice. A weekly averaged preliminary product is generated every day by the Alfred Wegener Institut (AWI) by merging the weekly CryoSat Sea Ice Thickness product and the daily SMOS Sea Ice Thickness retrieval. A final product is provided with a latency of about 3-4 weeks using a different global sea ice concentration product and a reprocessed CryoSat product. All grids are projected onto the 25 km EASE2 Grid based on a polar aspect spherical Lambert azimuthal equal-area projection. The grid dimension is 5400 x 5400 km, equal to a 432 x 432 grid centered on the geographic pole. Coverage is limited to the October-April (winter) period for the Northern Hemisphere, due to the melting season, from year 2010 onwards.
Data - EO Sign In Authentication (Open)
SMOS NRT L2 Swath Wind Speed
SMOS retrieved surface wind speed gridded maps (with a spatial sampling of 1/4 x 1/4 degrees) are available in NetCDF format. Each product contains parts of ascending and descending orbits and it is generated by Ifremer, starting from the SMOS L1B data products, in Near Real Time i.e. within 4 to 6 hours from sensing time. Before using this dataset, please check the read-me-first note available in the Resources section below.
Data - EO Sign In Authentication (Open)
SMOS Soil Freeze and Thaw State
The SMOS Level 3 Freeze and Thaw (F/T) product provides daily information on the soil state in the Northern Hemisphere based on SMOS observations and associated ancillary data. Daily products, in NetCDF format, are generated by the Finnish Meteorological Institute (FMI) and are available from 2010 onwards. The processing algorithm makes use of gridded Level 3 brightness temperatures provided by CATDS. The data is provided in the Equal-Area Scalable Earth Grid (EASE2-Grid), at 25 km x 25 km resolution. For an optimal exploitation of this dataset, please refer to the Resources section below to access Product Specifications, read-me-first notes, etc.
Data - EO Sign In Authentication (Open)
SMOS L3 Daily Wind Speed
SMOS L3WS products are daily composite maps of the collected SMOS L2 swath wind products for a specific day, provided with the same grid than the Level 2 wind data (SMOS L2WS NRT) but separated into ascending and descending passes. This product is available the day after sensing from Ifremer, in NetCDF format. Before using this dataset, please check the read-me-first note available in the Resources section below.
Data - Announcement of Opportunity (Restrained)
CLOSED - Announcement of Opportunity for Spire data
An opportunity for scientists and researchers to access Spire data.
Data - EO Sign In Authentication (Open)
SMOS NRT Data Products
The SMOS Near Real Time products include Level 1 geo-located brightness temperature and Level 2 geo-located soil moisture estimation. The SMOS NRT L1 Light BUFR product contains brightness temperature geo-located on a reduced Gaussian grid (T511/N256), only for "land" pixels but keeping the full angular resolution. The pixels are consolidated in a full orbit dump segment (i.e. around 100 minutes of sensing time) with a maximum size of about 30MB per orbit. Spatial resolution is in the range of 30-50 km. This product is distributed in BUFR format. The SMOS NRT L2 Soil Moisture Neural Network (NN) product provides NRT soil moisture data based on the statistical coefficients estimated by a neural network. It is provided in the SMOS DGG grid and only at the satellite track. It also provides an estimation of the uncertainty of the estimated soil moisture product, and the probability that a soil moisture value is contaminated by Radio Frequency Interference (RFI). This product is distributed in NetCDF format. The L2 data product is also distributed via the EUMETCast Europe Service (DVB), upon registration on the EUMETSAT Earth Observation Portal. The Ku-band DVB reception station must be situated within the service coverage in Europe. SMOS NRT data is also regularly delivered to the UK Met-Office, then made available to operational agencies and research and development institutes via the WMO GTS Network. For an optimal exploitation of the SMOS NRT products please consult the read-me-first notes available in the Resources section below.
Data - EO Sign In Authentication (Open)
SMOS L1 and L2 Science data
SMOS Level 1 data products are designed for scientific and operational users who need to work with calibrated MIRAS instrument measurements, while SMOS Level 2 data products are designed for scientific and operational users who need to work with geo-located soil moisture and sea surface salinity estimation as retrieved from the L1 dataset. Products from the SMOS Data Processing Ground Segment (DPGS) located at the European Space Astronomy Centre (ESAC), belonging to the latest processing baseline, have File Class OPER. Reprocessed SMOS data is tagged as REPR. The Level 1A product comprises all calibrated visibilities between receivers (i.e. the interferometric measurements from the sensor including the redundant visibilities), combined per integration time of 1.2s (snapshot). The snapshots are consolidated in a pole-to-pole product file (50 minutes of sensing time) with a maximum size of about 215MB per half orbit (29 half orbits per day). Access to this products is restricted to SMOS Cal/Val users. The Level 1B product comprises the result of the image reconstruction algorithm applied to the L1A data. As a result, the reconstructed image at L1B is simply the difference between the sensed scene by the sensor and the artificial scene. The brightness temperature image is available in its Fourier component in the antenna polarisation reference frame top of the atmosphere. Images are combined per integration time of 1.2 seconds (snapshot). The removal of foreign sources (Galactic, Direct Sun, Moon) is also included in the reconstruction. Snapshot consolidation is as per L1A, with a maximum product size of about 115MB per half orbit. ESA provides the Artificial Scene Library (ASL) to add the artificial scene in L1B for any user that wants to start from L1B products and derive the sensed scene. The Level 1C product contains multi-angular brightness temperatures in antenna frame (X-pol, Y-pol, T3 and T4) at the top of the atmosphere, geo-located in an equal-area grid system (ISEA 4H9 - Icosahedral Snyder Equal Area projection). The pixels are consolidated in a pole-to-pole product file (50 minutes of sensing time), with a maximum size of about 350MB per half orbit (29 half orbits per day). Spatial resolution is in the range of 30-50 km. For each L1C product there is also a corresponding Browse product containing brightness temperatures interpolated for an incidence angle of 42.5°. Two L1C products are available: Land for soil moisture retrieval and Sea for sea surface salinity retrieval. The Level 2 Soil Moisture (SM) product comprises soil moisture measurements geo-located in an equal-area grid system ISEA 4H9. The product contains not only the retrieved soil moisture, but also a series of ancillary data derived from the processing (nadir optical thickness, surface temperature, roughness parameter, dielectric constant and brightness temperature retrieved at top of atmosphere and on the surface) with the corresponding uncertainties. The pixels are consolidated in a pole-to-pole product file (50 minutes of sensing time), with a maximum size of about 7MB (25MB uncompressed data) per half orbit (29 half orbits per day). This product is available in both Earth Explorer and NetCDF formats. The Level 2 Ocean Salinity (OS) product comprises sea surface salinity measurements geo-located in an equal-area grid system ISEA 4H9. The product contains one single swath-based sea surface salinity retrieved with and without Land-Sea contamination correction, SSS anomaly based on WOA-2009 referred to Land-Sea corrected sea surface salinity, brightness temperature at the top of the atmosphere and at the sea surface with their corresponding uncertainties. The pixels are consolidated in a pole-to-pole product file (50 minutes of sensing time), with a maximum size of about 10MB (25MB uncompressed data) per half orbit (29 half orbits per day). This product is available in both Earth Explorer and NetCDF formats. For an optimal exploitation of the SMOS L1 and L2 datasets, please refer to the Resources section below in order to access Product Specifications, read-me-first notes, etc.
Data - EO Sign In Authentication (Open)
SMOS Auxiliary Data
The Level 2 ECMWF SMOS Auxiliary data product, openly available to all users, contains ECMWF data on the ISEA 4-9 DGG corresponding to SMOS half-orbit. It is used by both the ocean salinity and soil moisture operational processors to store the geophysical parameters from ECMWF forecasts. Access to other SMOS Level 1 and Level 2 "dynamic" and "static" auxiliary datasets is restricted to Cal/Val users. The detailed content of the SMOS Auxiliary Data Files (ADF) is described in the Products Specification documents available in the Resources section below.
Data - EO Sign In Authentication (Open)
SMOS L3 Sea Ice Thickness
The SMOS Level 3 Sea Ice Thickness product, in NetCDF format, provides daily estimations of SMOS-retrieved sea ice thickness (and its uncertainty) at the edge of the Arctic Ocean during the October-April (winter) season, from year 2010 onwards. The sea ice thickness is retrieved from the SMOS L1C product, up to a depth of approximately 0.5-1 m, depending on the ice temperature and salinity. Daily maps, projected on polar stereographic grid of 12.5 km, are generated by the Alfred Wegener Institut (AWI). This product is complementary with sea ice thickness measurements from ESA's CryoSat and Copernicus Sentinel-3 missions.
Data - External Data (Restrained)

ADAM Surface Reflectance Database v4.0
ADAM enables generating typical monthly variations of the global Earth surface reflectance at 0.1° spatial resolution (Plate Carree projection) and over the spectral range 240-4000 nm. The ADAM product is made of gridded monthly mean climatologies over land and ocean surfaces, and of a companion API toolkit that enables the calculation of hyperspectral (at 1 nm resolution over the whole 240-4000 nm spectral range) and multidirectional reflectances (i.e. in any illumination/viewing geometry) depending on user choices. The ADAM climatologies that feed the ADAM calculation tools are: For ocean: Monthly chlorophyll concentration derived from SeaWiFS-OrbView-2 (1999-2009); it is used to compute the water column reflectance (which shows large spectral variations in the visible, but is insignificant in the near and mid infrared). Monthly wind speed derived from SeaWinds-QuikSCAT-(1999-2009); it is used to calculate the ocean glint reflectance. For land: Monthly normalized surface reflectances in the 7 MODIS narrow spectral bands derived from FondsdeSol processing chain of MOD09A1 products (derived from Aqua and Terra observations), on which relies the modelling of the hyperspectral/multidirectional surface (soil/vegetation/snow) reflectance. Uncertainty variance-covariance matrix for the 7 spectral bands associated to the normalized surface reflectance. For sea-ice: Sea ice pixels (masked in the original MOD09A1 products) have been accounted for by a gap-filling approach relying on the spatial-temporal distribution of sea ice coverage provided by the CryoClim climatology for year 2005.
Data - Campaigns (Open)
THERMOPOLIS
The THERMOPOLIS 2009 campaign mainly served the DUE “Urban Heat islands (UHI) and Urban Thermography (UT) Project”
Data - Campaigns (Open)
WISE
The objective of WInd and Salinity Experiment 2001 (WISE 2001) was to get more data points and better wind speed (WS) measurements so as to reduce the sensitivity to WS uncertainty.