- All Categories (31923)
- Data (59)
- News (108)
- Missions (9)
- Events (62)
- Tools (26)
- Activities (17)
- Campaigns (3)
- Documents (31639)
DATA
Discover and download the Earth observation data you need from the broad catalogue of missions the European Space Agency operate and support.
Data - EO Sign In Authentication (Open)
Fundamental Data Records for Radiometry [MWR_FDR___]
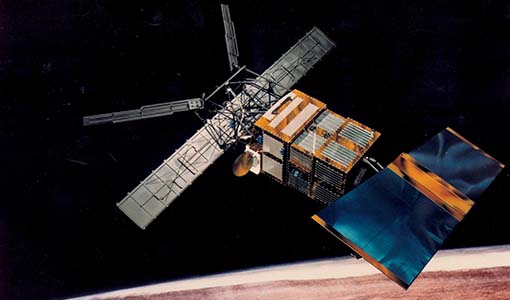
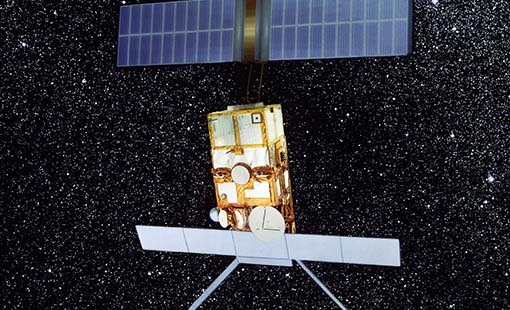
This dataset is a Fundamental Data Record (FDR) resulting from the ESA FDR4ALT project. The Fundamental Data Record for Radiometry V1 products contain intercalibrated Top of the Atmosphere brightness temperatures at 23.8 and 36.5 GHz. The collection covers data for the ERS-1, ERS-2 and Envisat missions, and is built upon a new processing of Level 0 data, incorporating numerous improvements in terms of algorithms, flagging procedures, and corrections. Compared to existing datasets, the Radiometry FDR demonstrates notable improvements in several aspects: New solutions for instrumental effects (ERS Reflector loss, Skyhorn, and Sidelobe corrections) Native sampling rate of 7Hz with enhanced coverage The FDR4ALT products are available in NetCDF format. Free standard tools for reading NetCDF data can be used. Information for expert altimetry users is also available in a dedicated NetCDF group within the products. Please consult the FDR4ALT Product User Guide before using the data. The FDR4ALT datasets represent the new reference data for the ERS/Envisat altimetry missions, superseding any previous mission data. Users are strongly encouraged to make use of these datasets for optimal results.
Data - EO Sign In Authentication (Open)
Fundamental Data Records for Altimetry [ALT_FDR___]
This dataset is a Fundamental Data Record (FDR) resulting from the ESA FDR4ALT project. The Fundamental Data Record for Altimetry V1 products contain Level 0 and Level 1 altimeter-related parameters including calibrated radar waveforms and supplementary instrumental parameters describing the altimeter operating status and configuration through the satellite lifetime. The data record consists of data for the ERS-1, ERS-2 and Envisat missions for the period ranging from 1991 to 2012, and bases on the Level 1 data obtained from previous ERS REAPER and ENVISAT V3.0 reprocessing efforts incorporating new algorithms, flags, and corrections to enhance the accuracy and reliability of the data. For many aspects, the Altimetry FDR product has improved compared to the existing individual mission datasets: New neural-network waveform classification, surface type classification, distance to shoreline and surface flag based on GSHHG Instrumental calibration information directly available in the product Improved Orbit solutions Correction of REAPER drawbacks (i.e., time jumps and negative waveforms) The FDR4ALT products are available in NetCDF format. Free standard tools for reading NetCDF data can be used. Information for expert altimetry users is also available in a dedicated NetCDF group within the products. Please consult the FDR4ALT Product User Guide before using the data. The FDR4ALT datasets represent the new reference data for the ERS/Envisat altimetry missions, superseding any previous mission data. Users are strongly encouraged to make use of these datasets for optimal results.
Data - EO Sign In Authentication (Open)
Sea Ice Thematic Data Product [ALT_TDP_SI]
This is the Sea Ice Thematic Data Product (TDP) V1 resulting from the ESA FDR4ALT project and containing the sea ice related geophysical parameters, along with associated uncertainties: snow depth, radar and sea-ice freeboard, sea ice thickness and concentration. The collection covers data for the ERS-1, ERS-2 and Envisat missions, and bases on Level 1 data coming from previous reprocessing (ERS REAPER and the Envisat V3.0) but taking into account the improvements made at Level 0/Level 1 in the frame of FDR4ALT (ALT FDR). The Sea Ice TDP provides data from the northern or southern hemisphere in two files corresponding to the Arctic and Antarctic regions respectively for the winter periods only, i.e., October to June for the Arctic, and May to November for the Antarctic. For many aspects, the Sea Ice TDP is very innovative: First time series of sea-ice thickness estimates for ERS Homogeneous calibration, allowing the first Arctic radar freeboard time series from ERS-1 (1991) to CryoSat-2 (2021) Uncertainties estimated along-track with a bottom-up approach based on dominant sources ERS pulse blurring error corrected using literature procedure [Peacock, 2004] The FDR4ALT products are available in NetCDF format. Free standard tools for reading NetCDF data can be used. Information for expert altimetry users is also available in a dedicated NetCDF group within the products. Please consult the FDR4ALT Product User Guide before using the data. The FDR4ALT datasets represent the new reference data for the ERS/Envisat altimetry missions, superseding any previous mission data. Users are strongly encouraged to make use of these datasets for optimal results.
Data - EO Sign In Authentication (Open)
Land Ice Thematic Data Product [ALT_TDP_LI]
This is the Land Ice Thematic Data Product (TDP) V1 resulting from the ESA FDR4ALT project and containing estimates of ice sheet surface elevation and associated uncertainties. The collection covers data for three different missions: ERS-1, ERS-2 and Envisat, and based on Level 1 data coming from previous reprocessing (ERS REAPER and the Envisat V3.0) but taking into account the improvements made at Level 0/Level 1 in the frame of FDR4ALT (ALT FDR). The Land Ice TDP focuses specifically on the ice sheets of Greenland and Antarctica, providing these data in different files. For many aspects, the Land Ice Level 2 and Level 2+ processing is very innovative: Improved relocation approach correcting for topographic effects within the beam footprint to identify the Point of Closest Approach Homogeneous timeseries of surface elevation measurements at regular along-track reference nodes. The FDR4ALT products are available in NetCDF format. Free standard tools for reading NetCDF data can be used. Information for expert altimetry users is also available in a dedicated NetCDF group within the products. Please consult the FDR4ALT Product User Guide before using the data. The FDR4ALT datasets represent the new reference data for the ERS/Envisat altimetry missions, superseding any previous mission data. Users are strongly encouraged to make use of these datasets for optimal results.
Data - EO Sign In Authentication (Open)
Inland Waters Thematic Data Product [ALT_TDP_IW]
This is the Inland Waters Thematic Data Product (TDP) V1 resulting from the ESA FDR4ALT project and containing improved Water Surface Height (WSH) data record from the ERS-1, ERS-2 and Envisat missions estimated using the ICE1 retracking range for its better performance on the hydro targets. The FDR4ALT products are available in NetCDF format. Free standard tools for reading NetCDF data can be used. Information for expert altimetry users is also available in a dedicated NetCDF group within the products. Please consult the FDR4ALT Product User Guide before using the data. The FDR4ALT datasets represent the new reference data for the ERS/Envisat altimetry missions, superseding any previous mission data. Users are strongly encouraged to make use of these datasets for optimal results.
Data - EO Sign In Authentication (Open)
Ocean and Coastal Topography Thematic Data Product [ALT_TDP_OC]
This is the Ocean and Coastal Topography Thematic Data Product (TDP) V1 resulting from the ESA FDR4ALT project and containing improved sea surface height anomaly data records both at 1 Hz and 20 Hz resolution to address climate and/or coastal areas studies. The collection covers data for the ERS-1, ERS-2 and Envisat missions. Note that a dedicated processing to coastal zones has been applied for coastal distances below 200 km. Compared to existing datasets, the Ocean and Coastal Topography TDP demonstrates notable improvements in several aspects: Up-to-date orbit and geophysical corrections applied Adaptive retracker for Envisat The FDR4ALT products are available in NetCDF format. Free standard tools for reading NetCDF data can be used. Information for expert altimetry users is also available in a dedicated NetCDF group within the products. Please consult the FDR4ALT Product User Guide before using the data. The FDR4ALT datasets represent the new reference data for the ERS/Envisat altimetry missions, superseding any previous mission data. Users are strongly encouraged to make use of these datasets for optimal results.
Data - EO Sign In Authentication (Open)
Ocean Waves Thematic Data Product [ALT_TDP_WA]
This is the Ocean Waves Thematic Data Product (TDP) V1 resulting from the ESA FDR4ALT project and containing Significant Wave Height estimates for the ERS-1, ERS-2 and Envisat missions. Compared to existing datasets, the Ocean Waves TDP demonstrates notable improvements in several aspects: Great improvements for Envisat due to noise reduction from Adaptive retracker and High-Frequency Adjustment (HFA) All variables are given at 5 Hz The FDR4ALT products are available in NetCDF format. Free standard tools for reading NetCDF data can be used. Information for expert altimetry users is also available in a dedicated NetCDF group within the products. Please consult the FDR4ALT Product User Guide before using the data. The FDR4ALT datasets represent the new reference data for the ERS/Envisat altimetry missions, superseding any previous mission data. Users are strongly encouraged to make use of these datasets for optimal results.
Data - EO Sign In Authentication (Open)
Atmospheric Thematic Data Product [MWR_TDPATM]
This is the Atmospheric Thematic Data Product (TDP) V1 resulting from the ESA FDR4ALT project and containing Total Column Water Vapour (TCWV), Cloud Liquid Water Path (LWP), Atmospheric Attenuation of the altimeter backscattering coefficient at Ku-band (AttKu), and Wet Tropospheric Correction (WTC), retrieved from observations of the Microwave Radiometer (MWR) instruments flown on-board the ERS-1, and ERS-2, and Envisat satellites. Compared to existing datasets, the Atmospheric TDP demonstrates notable improvements in several aspects: Improved temporal coverage, especially for ERS-2 Improved L0 -> 1 processing Two different corrections are provided based on a neural network retrieval or on a 1D-VAR approach The FDR4ALT products are available in NetCDF format. Free standard tools for reading NetCDF data can be used. Information for expert altimetry users is also available in a dedicated NetCDF group within the products. Please consult the FDR4ALT Product User Guide before using the data. The FDR4ALT datasets represent the new reference data for the ERS/Envisat altimetry missions, superseding any previous mission data. Users are strongly encouraged to make use of these datasets for optimal results.
Data - EO Sign In Authentication (Open)
Envisat AATSR L1B Brightness Temperature/Radiance [ENV_AT_1_RBT]
- AATSR Full Resolution land and ocean cover image of the Iberian Peninsula from 28 October 2006 AATSR Full Resolution land cover image of the Iberian Peninsula from 28 October 2006. The Envisat AATSR Level 1B Brightness Temperature/Radiance product (RBT) contains top of atmosphere (TOA) brightness temperature (BT) values for the infra-red channels and radiance values for the visible channels, on a 1-km pixel grid. Values for each channel and for the nadir and oblique views occupy separate NetCDF files within the Sentinel-SAFE format, along with associated uncertainty estimates. Additional files contain cloud flags, land and water masks, and confidence flags for each image pixel, as well as instrument and ancillary meteorological information. This AATSR product [ENV_AT_1_RBT] in NetCDF format stemming from the 4th AATSR reprocessing, is a continuation of ERS ATSR data and a precursor of Sentinel-3 SLSTR data. It has replaced the former L1B product [ATS_TOA_1P] in Envisat format from the 3rd reprocessing. Users with Envisat-format products are recommended to move to the new Sentinel-SAFE like/NetCDF format products. The 4th reprocessing of Envisat AATSR data was completed in 2022; the processing updates that have been put in place and the expected scientific improvements have been outlined in full in the User Documentation for (A)ATSR 4th Reprocessing Products.
Data - EO Sign In Authentication (Open)
Landsat RBV
This dataset contains Landsat 3 Return Beam Vidicon (RBV) products, acquired by ESA by the Fucino ground station over its visibility mask. The data (673 scenes) are the result of the digitalization of the original 70 millimetre (mm) black and white film rolls. The RBV instrument was mounted on board the Landsat 1 to 3 satellites between 1972 and 1983, with 80 metre resolution. Three independent co-aligned television cameras, one for each spectral band (band 1: blue-green, band 2: yellow-red, band 3: NIR), constituted this instrument. The RBV system was redesigned for Landsat 3 to use two cameras operating in one broad spectral band (green to near-infrared; 0.505–0.750 µm), mounted side-by-side, with panchromatic spectral response and higher spatial resolution than on Landsat 1 and Landsat 2. Each of the cameras produced a swath of about 90 km (for a total swath of 180 km), with a spatial resolution of 40 m.
Data - Data Description
Landsat 7 ETM+ European and Mediterranean Countries Cloud Free Collection
This dataset contains the cloud-free products from Landsat 7 Enhanced Thematic Mapper collection acquired over Europe, North Africa and the Middle East; for each scene only one product is selected, with the minimal cloud coverage. The Landsat 7 ETM+ scenes typically cover 185 x 170 km. A standard full scene is nominally centred on the intersection between a Path and Row (the actual image centre can vary by up to 100 m). The data are system corrected.
Data - EO Sign In Authentication (Open)
Landsat 5 TM European and Mediterranean Countries Cloud Free Collection
This dataset contains the cloud-free products from Landsat 5 Thematic Mapper collection acquired over Europe, North Africa and the Middle East; for each scene only one product is selected, with the minimal cloud coverage. The acquired Landsat TM scene covers approximately 183 x 172.8 km. A standard full scene is nominally centred on the intersection between a path and row (the actual image centre can vary by up to 100 m). The data are system corrected.
Data - EO Sign In Authentication (Open)
Landsat 8 Collection 2 European Coverage
This dataset contains the European coverage of Landsat-8 Collection 2 data, both Level-1 and Level-2, acquired since the beginning of the mission. Landsat-8 Collection 2 is the result of a reprocessing effort on the archive and on newly acquired products with significant improvement with respect to Collection 1 on data quality, obtained by means of advancements in data processing and algorithm development. Primarily, this involves a relevant improvement in the absolute geolocation accuracy (now re-baselined to the European Space Agency Copernicus Sentinel-2 Global Reference Image (GRI) but also includes updated digital elevation modelling sources, improved Radiometric Calibration (even correction for the TIRS striping effect), enhanced Quality Assessment Bands, updated and consistent metadata files and usage of Cloud Optimised Georeferenced (COG) Tagged Image File Format. Landsat-8 Level-1 products combine data from the two Landsat instruments, OLI and TIRS. The Level-1 products generated can be either L1TP or L1GT: L1TP - Level-1 Precision Terrain (Corrected) (L1T) products: Radiometrically calibrated and orthorectified using ground control points (GCPs) and digital elevation model (DEM) data to correct for relief displacement. The highest quality Level-1 products suitable for pixel-level time series analysis. GCPs used for L1TP correction are derived from the Global Land Survey 2000 (GLS2000) data set. L1GT - Level-1 Systematic Terrain (Corrected) (L1GT) products: L1GT data products consist of Level-0 product data with systematic radiometric, geometric and terrain corrections applied and resampled for registration to a cartographic projection, referenced to the WGS84, G873, or current version. The dissemination server contains three different classes of Level-1 products Real Time (RT): Newly acquired Landsat-8 OLI/TIRS data are processed upon downlink but use an initial TIRS line-of-sight model parameters; the data are made available in less than 12 hours (4-6 hours typically). Once the data have been reprocessed with the refined TIRS parameters, the products are transitioned to either Tier 1 or Tier 2 and removed from the Real-Time tier (in 14-16 days). Tier 1 (T1): Landsat scenes with the highest available data quality are placed into Tier 1 and are considered suitable for time-series analysis. Tier 1 includes Level-1 Precision and Terrain (L1TP) corrected data that have well-characterized radiometry and are inter-calibrated across the different Landsat instruments. The georegistration of Tier 1 scenes is consistent and within prescribed image-to-image tolerances of ≦ 12-metre radial root mean square error (RMSE). Tier 2 (T2): Landsat scenes not meeting Tier 1 criteria during processing are assigned to Tier 2. Tier 2 scenes adhere to the same radiometric standard as Tier 1 scenes, but do not meet the Tier 1 geometry specification due to less accurate orbital information (specific to older Landsat sensors), significant cloud cover, insufficient ground control, or other factors. This includes Systematic Terrain (L1GT) and Systematic (L1GS) processed data. Landsat-8 Level-2 products are generated from L1GT and L1TP Level-1 products that meet the <76 degrees Solar Zenith Angle constraint and include the required auxiliary data inputs to generate a scientifically viable product. The data are available a couple of days after the Level-1 T1/T2. The Level-2 products generated can be L2SP or L2SR: L2SP - Level-2 Science Products (L2SP) products: include Surface Reflectance (SR), Surface Temperature (ST), ST intermediate bands, an angle coefficients file, and Quality Assessment (QA) Bands. L2SR - Level-2 Surface Reflectance (L2SR) products: include Surface Reflectance (SR), an angle coefficients file, and Quality Assessment (QA) Bands; it is generated if ST could not be generated. Two different categories of Level-1 products are offered: LC with Optical, Thermal and Quality Map images, LO with Optical and Quality Map images (Thermal not available). For the Level-2 data, only LC combined products are generated.
Data - EO Sign In Authentication (Open)
Landsat ETM+ ESA archive
This dataset contains all the Landsat-7 Enhanced Thematic Mapper high-quality ortho-rectified L1T products (or L1Gt where not enough GCPs are available) over Kiruna, Maspalomas, Matera and Neustrelitz visibility masks. The Landsat-7 ETM+ scenes typically covers 185 x 170 km. A standard full scene is nominally centred on the intersection between a Path and Row (the actual image centre can vary by up to 100 m). Each band requires 50 MB (uncompressed), and Band 8 requires 200 MB (panchromatic band with resolution of 15 m opposed to 30 m). Kiruna, Maspalomas and Matera Landsat-7 ETM density maps
Data - Data Description
Landsat TM ESA archive
This dataset contains all the Landsat-5 Thematic Mapper high-quality ortho-rectified L1T dataset acquired by ESA over the Fucino, Matera, Kiruna and Maspalomas visibility masks, as well as campaign data over Malindi, Bishkek, Chetumal, and Libreville. The acquired Landsat TM scene covers approximately 183 x 172.8 km. A standard full scene is nominally centred on the intersection between a path and row (the actual image centre can vary by up to 100 m). A full image is composed of 6920 pixels x 5760 lines and each band requires 40 MB of storage space (uncompressed) at 30 m spatial resolution in the VIS, NIR and SWIR as well as 120 m in the TIR spectral range. Kiruna Landsat TM GTC density map Maspalomas Landsat TM GTC density map Matera Landsat TM GTC density map
Data - Project Proposal (Restrained)
SPOT-6 to 7 full archive and tasking
The SPOT 6 and 7 satellites ensure data continuity with the no longer operational SPOT 5 satellite and provide an archive of very high resolution optical acquisition as well as the possibility to task the satellites for new acquisitions. Following the completion of the SPOT 7 mission in March 2023, new acquisition tasking is only available for the SPOT 6 satellite. The ortho-products are automatically generated by the SPOT 6 and 7 ground segment, based on SRTM database or Reference3D when available. The projection available for SPOT 6 and 7 ortho-products is UTM, datum WGS84. Bands combinations: Pansharpened: colour image at 1.5 m resolution Bundle: 1.5 m panchromatic image and 6 m multispectral image. Geometric processing levels: Primary: The Primary product is the processing level closest to the natural image acquired by the sensor. This product restores perfect collection conditions: the sensor is placed in rectilinear geometry, and the image is clear of all radiometric distortion. Standard Ortho: The Ortho product is a georeferenced image in Earth geometry, corrected from acquisition and terrain off-nadir effects. Tailored ortho: Aside from the Standard Ortho product, when different specifications are needed, a custom orthorectification, with a more precise 3D model provided by the client or acquired for the purpose, can be provided on demand. As per ESA policy, very high-resolution imagery of conflict areas cannot be provided.
Data - Data Description
Envisat ASAR AP Co- and Cross-polar L0 [ASA_APC/APH/APV_0P]
The ASAR Alternating Polarization Mode Level 0 (Co-polar and Cross-polar H and V) products contain time-ordered Annotated Instrument Source Packets (AISPs) corresponding to one of the three possible polarisation combinations: HH & HV, VV & VH and HH & VV, respectively. The echo samples in the AISPs have been compressed to 4 bits/sample using FBAQ. This is a high-rate, narrow swath mode, so data is only acquired for partial orbit segments. There are two co-registered images per acquisition and may be from one of seven different image swaths. The Level 0 product was produced systematically for all data acquired within this mode. Data Size: 56-100 km across track x 100 km along track. There are three AP Mode Level 0 products: ASA_APH_0P: The Cross-polar H Level 0 product corresponds to the polarisation combination HH/HV. ASA_APV_0P: The Cross-polar V Level 0 product corresponds to the polarisation combination VV/VH. ASA_APC_0P: The Co-polar Level 0 product corresponds to the polarisation combination HH/VV= H and H received/V transmit and V received.
Data - Data Description
Landsat MSS ESA Archive
This dataset contains all the Landsat 1 to Landsat 5 Multi Spectral Scanner (MSS) high-quality ortho-rectified Level 1 GEO and GTC dataset acquired by ESA over the Fucino, Kiruna (active from April to September only) and Maspalomas (on campaign basis) visibility masks. The acquired Landsat MSS scene covers approximately 183 x 172.8 km. A standard full scene is nominally centred on the intersection between a path and row (the actual image centre can vary by up to 200 m). The altitude changed from 917 km to 705 km and therefore two World Reference Systems (WRS) were used. A full image is composed of 3460 pixels x 2880 lines with a pixel size of 60 m. Two different product levels are available: Geometrically and terrain corrected GTC Products (L1T): The most accurate level of processing as they incorporate Ground Control Points (GCPs) and a Digital Elevation Model (DEM) to provide systematic geometric and topographic accuracy; with geodetic accuracy dependent on the number, spatial distribution and accuracy of the GCPs over the scene extent, and the resolution of the DEM used. Geometrically corrected GEO Product (L1G): Normally generated where there is a lack of GCPs, and are derived purely from data collected by the sensor and spacecraft e.g. ephemeris data. Matera density and coverage map Kiruna density and coverage map Maspalomas density and coverage map
Data - Project Proposal (Restrained)
Spire live and historical data
The data collected by Spire from it's 110 satellites launched into Low Earth Orbit (LEO) has a diverse range of applications, from analysis of global trade patterns and commodity flows to aircraft routing to weather forecasting. The data also provides interesting research opportunities on topics as varied as ocean currents and GNSS-based planetary boundary layer height. The following products can be requested: ADS-B Data Stream Global ADS-B satellite data observed by Spire satellites and processed through the ground stations network. Historical ADS-B data older than 6 months can be delivered as data cuts containing CSV file(s) accessible through a Web Service or Cloud storage solutions. Live ADS-B data is available through a streaming API, and recent historical data can be accessed through a REST API. Data is distributed as a monthly subscription: historical data can be requested starting from 3 December 2008, the time period for live data starts from a user-defined date and continues for 30 days AIS AIS messages include satellite AIS (S-AIS) as observed by Spire satellites and terrestrial AIS (T-AIS) from third party sensor stations (up to 40 million messages per day). Historical AIS data are delivered as a cvs file with availability back to June 2016 or via Historical API from December 2018; live AIS data are pushed to end users via TCP or through Messages API. Data is distributed as a monthly subscription, from a user-defined date and continues for a 30 day period. GNSS-Radio Occultation GNSS Radio Occultation (GNSS-RO) measurements are collected globally on a continuous basis, generating profiles of the Earth’s atmosphere. Derived Level 1 and Level 2 products include both atmospheric and ionospheric products. Historical data for most of the GNSS-RO products are available from December 2018 to the present. Near real-time (within 90 minutes or less latency from collection to delivery) GNSS-RO profiles are also available upon request. GNSS Reflectometry GNSS Reflectometry (GNSS-R) is a technique to measure Earth’s surface properties using reflections of GNSS signals in the form of a bistatic radar. Spire collects two types of GNSS-R data: conventional, near-nadir incidence LHCP reflections collected by the Spire GNSS-R satellites (e.g., Spire GNSS-R “Batch-1” satellites) and grazing angle (i.e., low elevation angle) RHCP reflections collected by the Spire GNSS-RO satellites. Derived Level 1 and Level 2 products are available, as well as some special Level 0 raw intermediate frequency (IF) data. Historical grazing angle GNSS-R data are available from May 2019 to the present, while conventional GNSS-R data are available from December 2020 to the present. In addition, also Polarimetric Radio Occultation (PRO) measurements are available Name Description Data format and content Application Automatic Identification System (AIS) The automatic identification system (AIS) is an automatic tracking system that uses transponders on ships and is used by vessel traffic services. Spire data includes satellite AIS (S-AIS) as observed by Spire satellites and terrestrial AIS (T-AIS) from third party sensor stations. .parquet.gz files The AIS files contain time-series data on received AIS messages, both the raw NMEA message and added post-processing data for each message. Supply chain analysis, commodity trading, identification of illegal fishing or dark targets, ship route and fuel use optimization, analysis of global trade patterns, anti-piracy, autonomous vessel software, ocean currents Automatic Dependent Surveillance-Broadcast (ADS-B) Spire AirSafe ADS-B products give access to satellite and terrestrial ADS-B data from captured aircrafts. .csv.gz files The decompressed csv file contains a list of hexadecimal representations of ADS-B messages associated with the timestamp they were received on the satellite. Fleet management, ICAO regulatory compliance, route optimization, predictive maintenance, global airspace, domain awareness Global Navigation Satellite System Radio Occultation (GNSS-RO) GNSS atmospheric radio occultation (GNSS-RO) relies on the detection of a change in a radio signal as it passes through a planet's atmosphere, i.e. as it is refracted by the atmosphere. This data set contains precise orbit determination (POD) solutions, satellite attitude information, high-rate occultation observations, excess phase, and derived atmospheric dry temperature profiles. podObs*.rnx This file contains raw pseudorange, carrier phase, Doppler frequency, and signal-to-noise measurements for each observed GPS signal from a single Spire satellite which allow to estimate the positions and velocities of each Spire satellite and also used to derive ionospheric total electron content data. leoOrb*.sp3 This file contains the estimated position, velocity and receiver clock error of a given Spire satellite after processing of the POD observation file leoAtt*.log It contains 1 Hz rate quaternion information measured from a single Spire satellite describing the satellite orientation. opnGns*ro.bin, opnGns*rst.bin these files contain raw measurements from the occulting GNSS satellite (one for each signal frequency) and raw phase data from one or more reference GNSS satellites. atmPhs* The file contains occultation excess phase delay. Also contains SNR values, ransmitter and receiver positions and open loop model information atmPrf*.nc The file contains profiles of atmospheric dry pressure, dry temperature and neutral refractivity as a function of altitude produced from full processing of one occultation event. bfrPrf*.bufr The file contains derived profiles of dry pressure, dry temperature, refractivity and bending angle for each occultation. Atmospheric profiles of pressure, dry temperature, bending angle, and refractivity used in numerical weather prediction data assimilation and climate change studies. Raw IF samples from GNSS-RO satellites Raw intermediate frequency (IF) sampled data (I/Q) from the GNSS receiver front-end of GNSS-RO satellites. rocRIF*.zip Binary raw IF data and associated ancillary data (e.g., POD data) in a zip archive per collection event. GNSS-RO studies, GNSS RFI and jamming monitoring, research. Raw IF samples from GNSS-R satellites Raw intermediate frequency (IF) sampled data (I/Q) from the GNSS receiver front-end of conventional GNSS-R satellites. gbrRIF*.zip Binary raw IF data and associated ancillary data (e.g., POD data) in a zip archive per collection event. GNSS-R studies, GNSS RFI and jamming monitoring, research, etc. Grazing angle GNSS-R observations During grazing angle GNSS-R events, signal reflection at two frequencies is observed through the limb-facing antenna and is trackedusing an open-loop tracking technique thatrelies on a model topredict the propagationdelay and Doppler of thereflected signal. Simultaneous open-looptracking of the signaldirectly along theline-of-sight from thetransmitter to thereceiver is alsoperformed to provideadditional data that maybenecessary for signalcalibration. The mainoutput of the open-looptracking are in-phase (I)and quadrature (Q)accumulation samples(nominally at 50 Hz),which represent the residual Doppler (phase) from the model. grzObs*.nc L1A filecontains rawopen loopcarrier phasemeasurementsat 50 Hzsampling forgrazingangleGNSS-Rreflectionscaptured in the GNSS-RO RHC Pantennas, (bothdirect andreflectedsignals) on GNSS-RO satellites. Sea surface and sea ice height extent, and classification Georeferenced grazing angle GNSS-R observations The low-levelobservations of the high-rate grazing angle GNSS-R observationsbut withthegeoreferenced bistatic radar parameters of the satellite receiver,specular reflection, and GNSS transmitter included. grzRfl*.nc L1B file contains the georeferenced grazing angle GNSS-R data collected by Spire GNSS-RO satellites, including the low-level observables and bistatic radar geometries (e.g., receiver, specular reflection, and the transmitter locations). Sea surface and sea ice height extent, and classification GNSS-R calibrated bistatic radar reflectivities Higher level product used to derive land-surface reflectivity. gbrRfl*.nc L1A along-track calibrated relative power between reflected and direct signals (e.g., bistatic radar reflectivities) measured by Spire conventional GNSS-R satellites. GNSS-R studies, soil moisture, ocean wind, and sea ice applications GNSS-R calibrated bistatic radar cross-sections Higher level product used to derive ocean surface roughness products. gbrRCS*.nc L1B along-track calibrated and normalized bistatic radar cross-sections measured by Spire conventional GNSS-R satellites. GNSS-R studies, ocean wind and sea ice applications Combined Surface Soil Moisture Combined CYGNSS and SMAP soil moisture data are provided as a combined surface soil moisture (COMB-SSM) product in two data level formats: L2U1 and L3U1. 6 x 6 km grid cell. L-band measurements of surface soil moisture benefit from better vegetation penetration in comparison to traditional C-band measurements. COMB-SSM.nc This file contains the combined data product containing measurements from both CYGNSS and SMAP reported on a 6 km global Equi7Grid grid. Agriculture, crop insurance, farming solutions, climatology, terrain awareness, peatlands and wetlands monitoring etc Ionosphere total electron content Spire routinely collects and processes a large volume of total electron content (TEC) data, representing the line-of-sight integration of electron density between a Spire satellite and a GNSS satellite. Each file contains line-of-sight ionospheric total electron content (TEC) estimates derived for a ‘single viewing arc’ contained in the POD observation file. Viewing arcs are at least 10 minutes in duration. podTec*.nc This file contains the line-of-sight total electron content with associated orbital information. Space weather research, tsunamigenic earthquakes, weather applications, space situational awareness (SSA), autonomous vehicles etc Ionosphere scintillation The scintillation index for each GNSS frequency is computed onboard the spacecraft. This index provides a measure of the fluctuations of the GNSS signal over the course of 10 seconds caused by propagation of the radio signals through electron density irregularities in the ionosphere. After the raw indices are downlinked to the ground, they are packaged along with associated metadata such as orbit position to create the final scintillation data product. scnLv1*.nc This file contains on-board computed scintillation data (S4 only) with associated orbital information Space weather research, solar events, TIDs, weather applications positioning and navigation, communications etc Electron density profile Electron density profiles are retrieved as a function of altitude. Electron density profiles are processed from podTec netcdf files, which span a sufficient elevation angle range. A standard Abel inversion algorithm is applied to retrieve the profiles. ionPrf*.nc This file contains electron density profile retrieved from podTec files spanning appropriate elevation angle range Space weather research, solar events, TIDs, weather applications positioning and navigation, communications Polarimetric Radio Occultation (PRO) measurements PRO measurements observe the properties of GNSS signals as they pass through by Earth's atmosphere; the polarization state of the signals is recorded separately for H and V polarizations to provide information on the anisotropy of hydro-meteors along the propagation path. proObs Level 0 - Raw open loop carrier phase measurements at 50 Hz sampling for both linear polarization components (horizontal and vertical) of the occulted GNSS signal. leoOrb*.sp3 This file contains the estimated position, velocity and receiver clock error of a given Spire satellite after processing of the POD observation file h(v)(c)atmPhs Level 1B - Atmospheric excess phase delay computed for each individual linear polarization component (hatmPhs, vatmPhs) and for the combined (“H” + “V”) signal (catmPhs). Also contains values for signal-to-noise ratio, transmitter and receiver positions and open loop model information. polPhs Level 1C - Combines the information from the hatmPhs and vatmPhs files while removing phase continuities due to phase wrapping and navigation bit modulation. patmPrfLevel 2 - Bending angle, dry refractivity, and dry temperature as a function of mean sea level altitude and impact parameter derived from the “combined” excess phase delay (catmPhs) PRO measurements add a sensitivity to ice and precipitation content alongside the traditional RO measurements of the atmospheric temperature, pressure, and water vapor. The products are available as part of the Spire provision with worldwide coverage. All details about the data provision, data access conditions and quota assignment procedure are described in the Terms of Applicability.
Data - Announcement of Opportunity (Restrained)
Announcement of Opportunity for G-POD
ESA is offering all scientists the possibility to perform bulk processing and/or validation of their own algorithms exploiting the large ESA Earth-observation archive.
