- All Categories (4943)
- Data (18)
- News (30)
- Missions (5)
- Events (31)
- Tools (5)
- Activities (8)
- Campaigns (1)
- Documents (4845)
DATA
Discover and download the Earth observation data you need from the broad catalogue of missions the European Space Agency operate and support.
Data - EO Sign In Authentication (Open)
Atmospheric Thematic Data Product [MWR_TDPATM]
This is the Atmospheric Thematic Data Product (TDP) V1 resulting from the ESA FDR4ALT project and containing Total Column Water Vapour (TCWV), Cloud Liquid Water Path (LWP), Atmospheric Attenuation of the altimeter backscattering coefficient at Ku-band (AttKu), and Wet Tropospheric Correction (WTC), retrieved from observations of the Microwave Radiometer (MWR) instruments flown on-board the ERS-1, and ERS-2, and Envisat satellites. Compared to existing datasets, the Atmospheric TDP demonstrates notable improvements in several aspects: Improved temporal coverage, especially for ERS-2 Improved L0 -> 1 processing Two different corrections are provided based on a neural network retrieval or on a 1D-VAR approach The FDR4ALT products are available in NetCDF format. Free standard tools for reading NetCDF data can be used. Information for expert altimetry users is also available in a dedicated NetCDF group within the products. Please consult the FDR4ALT Product User Guide before using the data. The FDR4ALT datasets represent the new reference data for the ERS/Envisat altimetry missions, superseding any previous mission data. Users are strongly encouraged to make use of these datasets for optimal results.
Data - EO Sign In Authentication (Open)
Landsat 8 Collection 2 European Coverage
This dataset contains the European coverage of Landsat-8 Collection 2 data, both Level-1 and Level-2, acquired since the beginning of the mission. Landsat-8 Collection 2 is the result of a reprocessing effort on the archive and on newly acquired products with significant improvement with respect to Collection 1 on data quality, obtained by means of advancements in data processing and algorithm development. Primarily, this involves a relevant improvement in the absolute geolocation accuracy (now re-baselined to the European Space Agency Copernicus Sentinel-2 Global Reference Image (GRI) but also includes updated digital elevation modelling sources, improved Radiometric Calibration (even correction for the TIRS striping effect), enhanced Quality Assessment Bands, updated and consistent metadata files and usage of Cloud Optimised Georeferenced (COG) Tagged Image File Format. Landsat-8 Level-1 products combine data from the two Landsat instruments, OLI and TIRS. The Level-1 products generated can be either L1TP or L1GT: L1TP - Level-1 Precision Terrain (Corrected) (L1T) products: Radiometrically calibrated and orthorectified using ground control points (GCPs) and digital elevation model (DEM) data to correct for relief displacement. The highest quality Level-1 products suitable for pixel-level time series analysis. GCPs used for L1TP correction are derived from the Global Land Survey 2000 (GLS2000) data set. L1GT - Level-1 Systematic Terrain (Corrected) (L1GT) products: L1GT data products consist of Level-0 product data with systematic radiometric, geometric and terrain corrections applied and resampled for registration to a cartographic projection, referenced to the WGS84, G873, or current version. The dissemination server contains three different classes of Level-1 products Real Time (RT): Newly acquired Landsat-8 OLI/TIRS data are processed upon downlink but use an initial TIRS line-of-sight model parameters; the data are made available in less than 12 hours (4-6 hours typically). Once the data have been reprocessed with the refined TIRS parameters, the products are transitioned to either Tier 1 or Tier 2 and removed from the Real-Time tier (in 14-16 days). Tier 1 (T1): Landsat scenes with the highest available data quality are placed into Tier 1 and are considered suitable for time-series analysis. Tier 1 includes Level-1 Precision and Terrain (L1TP) corrected data that have well-characterized radiometry and are inter-calibrated across the different Landsat instruments. The georegistration of Tier 1 scenes is consistent and within prescribed image-to-image tolerances of ≦ 12-metre radial root mean square error (RMSE). Tier 2 (T2): Landsat scenes not meeting Tier 1 criteria during processing are assigned to Tier 2. Tier 2 scenes adhere to the same radiometric standard as Tier 1 scenes, but do not meet the Tier 1 geometry specification due to less accurate orbital information (specific to older Landsat sensors), significant cloud cover, insufficient ground control, or other factors. This includes Systematic Terrain (L1GT) and Systematic (L1GS) processed data. Landsat-8 Level-2 products are generated from L1GT and L1TP Level-1 products that meet the <76 degrees Solar Zenith Angle constraint and include the required auxiliary data inputs to generate a scientifically viable product. The data are available a couple of days after the Level-1 T1/T2. The Level-2 products generated can be L2SP or L2SR: L2SP - Level-2 Science Products (L2SP) products: include Surface Reflectance (SR), Surface Temperature (ST), ST intermediate bands, an angle coefficients file, and Quality Assessment (QA) Bands. L2SR - Level-2 Surface Reflectance (L2SR) products: include Surface Reflectance (SR), an angle coefficients file, and Quality Assessment (QA) Bands; it is generated if ST could not be generated. Two different categories of Level-1 products are offered: LC with Optical, Thermal and Quality Map images, LO with Optical and Quality Map images (Thermal not available). For the Level-2 data, only LC combined products are generated.
Data - Project Proposal (Restrained)

Spire live and historical data
The data collected by Spire from it's 110 satellites launched into Low Earth Orbit (LEO) has a diverse range of applications, from analysis of global trade patterns and commodity flows to aircraft routing to weather forecasting. The data also provides interesting research opportunities on topics as varied as ocean currents and GNSS-based planetary boundary layer height. The following products can be requested: ADS-B Data Stream Global ADS-B satellite data observed by Spire satellites and processed through the ground stations network. Historical ADS-B data older than 6 months can be delivered as data cuts containing CSV file(s) accessible through a Web Service or Cloud storage solutions. Live ADS-B data is available through a streaming API, and recent historical data can be accessed through a REST API. Data is distributed as a monthly subscription: historical data can be requested starting from 3 December 2008, the time period for live data starts from a user-defined date and continues for 30 days AIS AIS messages include satellite AIS (S-AIS) as observed by Spire satellites and terrestrial AIS (T-AIS) from third party sensor stations (up to 40 million messages per day). Historical AIS data are delivered as a cvs file with availability back to June 2016 or via Historical API from December 2018; live AIS data are pushed to end users via TCP or through Messages API. Data is distributed as a monthly subscription, from a user-defined date and continues for a 30 day period. GNSS-Radio Occultation GNSS Radio Occultation (GNSS-RO) measurements are collected globally on a continuous basis, generating profiles of the Earth’s atmosphere. Derived Level 1 and Level 2 products include both atmospheric and ionospheric products. Historical data for most of the GNSS-RO products are available from December 2018 to the present. Near real-time (within 90 minutes or less latency from collection to delivery) GNSS-RO profiles are also available upon request. GNSS Reflectometry GNSS Reflectometry (GNSS-R) is a technique to measure Earth’s surface properties using reflections of GNSS signals in the form of a bistatic radar. Spire collects two types of GNSS-R data: conventional, near-nadir incidence LHCP reflections collected by the Spire GNSS-R satellites (e.g., Spire GNSS-R “Batch-1” satellites) and grazing angle (i.e., low elevation angle) RHCP reflections collected by the Spire GNSS-RO satellites. Derived Level 1 and Level 2 products are available, as well as some special Level 0 raw intermediate frequency (IF) data. Historical grazing angle GNSS-R data are available from May 2019 to the present, while conventional GNSS-R data are available from December 2020 to the present. Name Description Data format and content Application Automatic Identification System (AIS) The automatic identification system (AIS) is an automatic tracking system that uses transponders on ships and is used by vessel traffic services. Spire data includes satellite AIS (S-AIS) as observed by Spire satellites and terrestrial AIS (T-AIS) from third party sensor stations. .parquet.gz files The AIS files contain time-series data on received AIS messages, both the raw NMEA message and added post-processing data for each message. Supply chain analysis, commodity trading, identification of illegal fishing or dark targets, ship route and fuel use optimization, analysis of global trade patterns, anti-piracy, autonomous vessel software, ocean currents Automatic Dependent Surveillance-Broadcast (ADS-B) Spire AirSafe ADS-B products give access to satellite and terrestrial ADS-B data from captured aircrafts. .csv.gz files The decompressed csv file contains a list of hexadecimal representations of ADS-B messages associated with the timestamp they were received on the satellite. Fleet management, ICAO regulatory compliance, route optimization, predictive maintenance, global airspace, domain awareness Global Navigation Satellite System Radio Occultation (GNSS-RO) GNSS atmospheric radio occultation (GNSS-RO) relies on the detection of a change in a radio signal as it passes through a planet's atmosphere, i.e. as it is refracted by the atmosphere. This data set contains precise orbit determination (POD) solutions, satellite attitude information, high-rate occultation observations, excess phase, and derived atmospheric dry temperature profiles. podObs*.rnx This file contains raw pseudorange, carrier phase, Doppler frequency, and signal-to-noise measurements for each observed GPS signal from a single Spire satellite which allow to estimate the positions and velocities of each Spire satellite and also used to derive ionospheric total electron content data. leoOrb*.sp3 This file contains the estimated position, velocity and receiver clock error of a given Spire satellite after processing of the POD observation file leoAtt*.log It contains 1 Hz rate quaternion information measured from a single Spire satellite describing the satellite orientation. opnGns*ro.bin, opnGns*rst.bin these files contain raw measurements from the occulting GNSS satellite (one for each signal frequency) and raw phase data from one or more reference GNSS satellites. atmPhs* The file contains occultation excess phase delay. Also contains SNR values, ransmitter and receiver positions and open loop model information atmPrf*.nc The file contains profiles of atmospheric dry pressure, dry temperature and neutral refractivity as a function of altitude produced from full processing of one occultation event. bfrPrf*.bufr The file contains derived profiles of dry pressure, dry temperature, refractivity and bending angle for each occultation. Atmospheric profiles of pressure, dry temperature, bending angle, and refractivity used in numerical weather prediction data assimilation and climate change studies. Raw IF samples from GNSS-RO satellites Raw intermediate frequency (IF) sampled data (I/Q) from the GNSS receiver front-end of GNSS-RO satellites. rocRIF*.zip Binary raw IF data and associated ancillary data (e.g., POD data) in a zip archive per collection event. GNSS-RO studies, GNSS RFI and jamming monitoring, research. Raw IF samples from GNSS-R satellites Raw intermediate frequency (IF) sampled data (I/Q) from the GNSS receiver front-end of conventional GNSS-R satellites. gbrRIF*.zip Binary raw IF data and associated ancillary data (e.g., POD data) in a zip archive per collection event. GNSS-R studies, GNSS RFI and jamming monitoring, research, etc. Grazing angle GNSS-R observations During grazing angle GNSS-R events, signal reflection at two frequencies is observed through the limb-facing antenna and is trackedusing an open-loop tracking technique thatrelies on a model topredict the propagationdelay and Doppler of thereflected signal. Simultaneous open-looptracking of the signaldirectly along theline-of-sight from thetransmitter to thereceiver is alsoperformed to provideadditional data that maybenecessary for signalcalibration. The mainoutput of the open-looptracking are in-phase (I)and quadrature (Q)accumulation samples(nominally at 50 Hz),which represent the residual Doppler (phase) from the model. grzObs*.nc L1A filecontains rawopen loopcarrier phasemeasurementsat 50 Hzsampling forgrazingangleGNSS-Rreflectionscaptured in the GNSS-RO RHC Pantennas, (bothdirect andreflectedsignals) on GNSS-RO satellites. Sea surface and sea ice height extent, and classification Georeferenced grazing angle GNSS-R observations The low-levelobservations of the high-rate grazing angle GNSS-R observationsbut withthegeoreferenced bistatic radar parameters of the satellite receiver,specular reflection, and GNSS transmitter included. grzRfl*.nc L1B file contains the georeferenced grazing angle GNSS-R data collected by Spire GNSS-RO satellites, including the low-level observables and bistatic radar geometries (e.g., receiver, specular reflection, and the transmitter locations). Sea surface and sea ice height extent, and classification GNSS-R calibrated bistatic radar reflectivities Higher level product used to derive land-surface reflectivity. gbrRfl*.nc L1A along-track calibrated relative power between reflected and direct signals (e.g., bistatic radar reflectivities) measured by Spire conventional GNSS-R satellites. GNSS-R studies, soil moisture, ocean wind, and sea ice applications GNSS-R calibrated bistatic radar cross-sections Higher level product used to derive ocean surface roughness products. gbrRCS*.nc L1B along-track calibrated and normalized bistatic radar cross-sections measured by Spire conventional GNSS-R satellites. GNSS-R studies, ocean wind and sea ice applications Combined Surface Soil Moisture Combined CYGNSS and SMAP soil moisture data are provided as a combined surface soil moisture (COMB-SSM) product in two data level formats: L2U1 and L3U1. 6 x 6 km grid cell. L-band measurements of surface soil moisture benefit from better vegetation penetration in comparison to traditional C-band measurements. COMB-SSM.nc This file contains the combined data product containing measurements from both CYGNSS and SMAP reported on a 6 km global Equi7Grid grid. Agriculture, crop insurance, farming solutions, climatology, terrain awareness, peatlands and wetlands monitoring etc Ionosphere total electron content Spire routinely collects and processes a large volume of total electron content (TEC) data, representing the line-of-sight integration of electron density between a Spire satellite and a GNSS satellite. Each file contains line-of-sight ionospheric total electron content (TEC) estimates derived for a ‘single viewing arc’ contained in the POD observation file. Viewing arcs are at least 10 minutes in duration. podTec*.nc This file contains the line-of-sight total electron content with associated orbital information. Space weather research, tsunamigenic earthquakes, weather applications, space situational awareness (SSA), autonomous vehicles etc Ionosphere scintillation The scintillation index for each GNSS frequency is computed onboard the spacecraft. This index provides a measure of the fluctuations of the GNSS signal over the course of 10 seconds caused by propagation of the radio signals through electron density irregularities in the ionosphere. After the raw indices are downlinked to the ground, they are packaged along with associated metadata such as orbit position to create the final scintillation data product. scnLv1*.nc This file contains on-board computed scintillation data (S4 only) with associated orbital information Space weather research, solar events, TIDs, weather applications positioning and navigation, communications etc Electron density profile Electron density profiles are retrieved as a function of altitude. Electron density profiles are processed from podTec netcdf files, which span a sufficient elevation angle range. A standard Abel inversion algorithm is applied to retrieve the profiles. ionPrf*.nc This file contains electron density profile retrieved from podTec files spanning appropriate elevation angle range Space weather research, solar events, TIDs, weather applications positioning and navigation, communications The products are available as part of the Spire provision with worldwide coverage. All details about the data provision, data access conditions and quota assignment procedure are described in the Terms of Applicability.
Data - Announcement of Opportunity (Restrained)

Announcement of Opportunity for G-POD
ESA is offering all scientists the possibility to perform bulk processing and/or validation of their own algorithms exploiting the large ESA Earth-observation archive.
Data - Announcement of Opportunity (Restrained)
CLOSED - Announcement of Opportunity for Spire data
An opportunity for scientists and researchers to access Spire data.
Data - Data Description
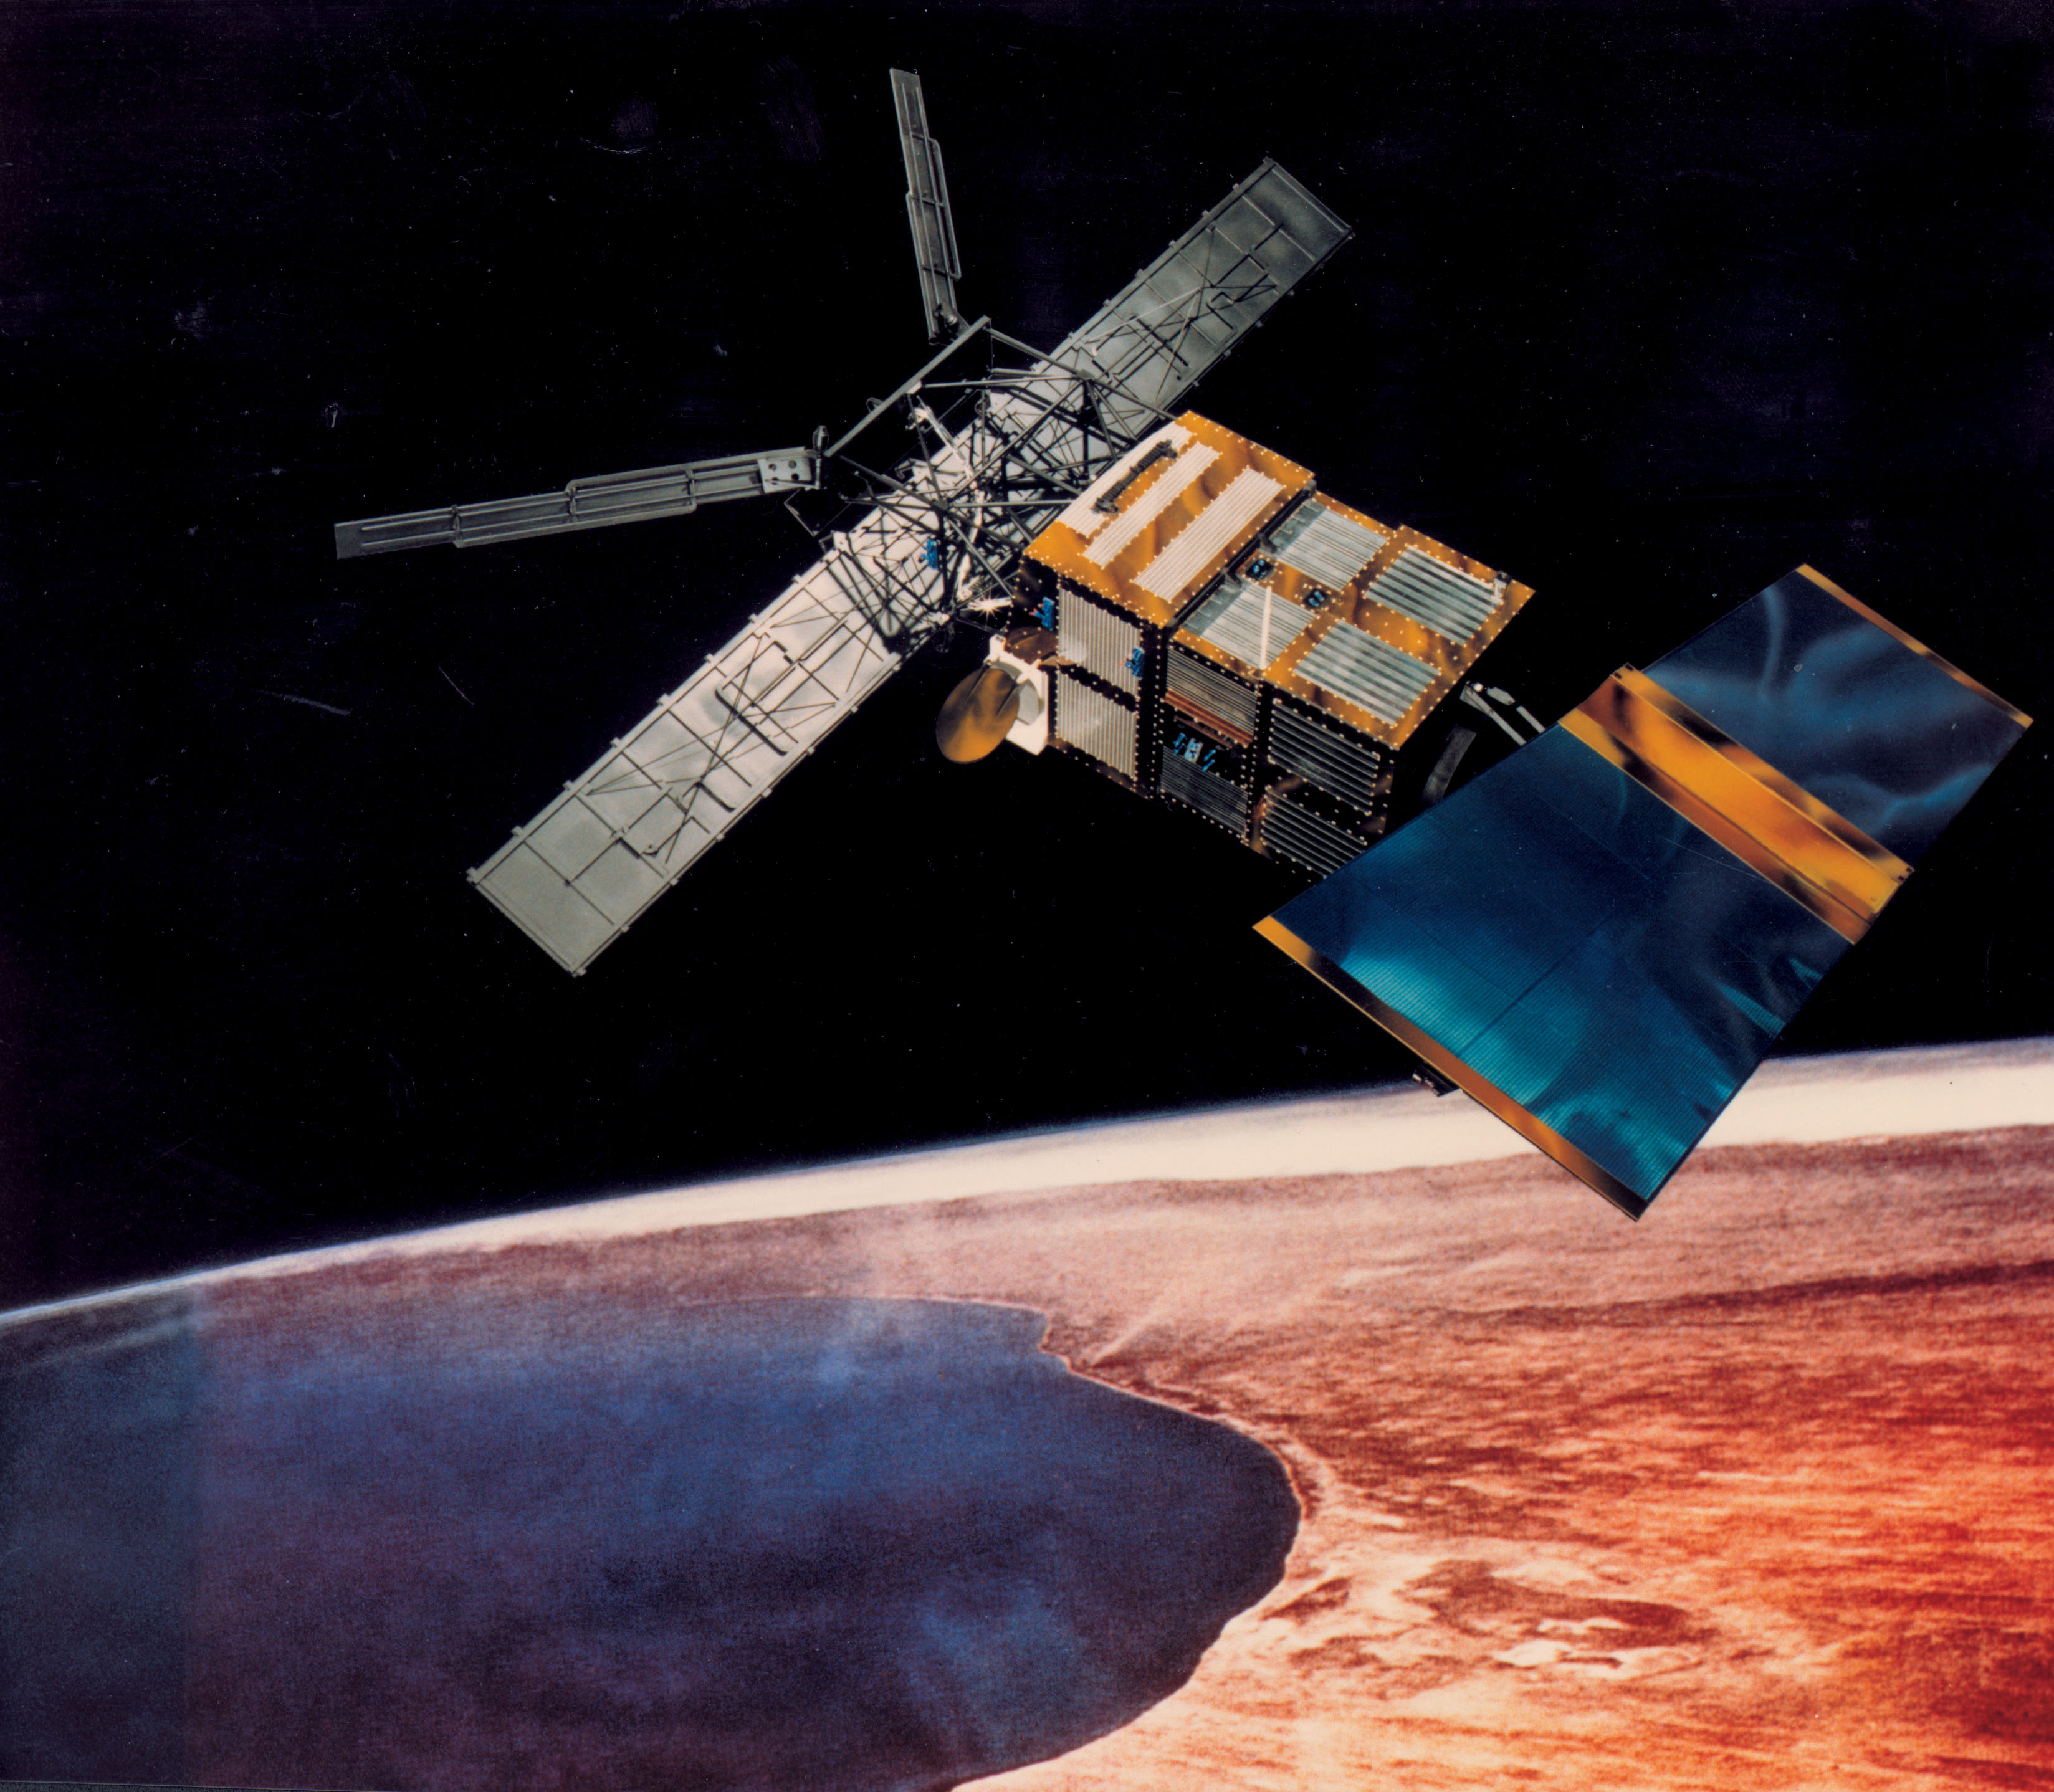
ERS-1/2 Radar Altimeter REAPER METEO Product - [ERS_ALT_2M]
This is a RA Meteo product containing only the 1 Hz parameters for altimeter (surface range, satellite altitude, wind speed and significant wave height at nadir) and ATSR/MWR data (brightness temperature at 23.8 GHz and 36.5 GHz, water vapour content, liquid water content) used to correct altimeter measurements. It also contains the full geophysical corrections. This product corresponds to a subset of the REAPER GDR product (ERS_ALT_2_). The REAPER (REprocessing of Altimeter Products for ERS) product is generated by applying a similar processing as for Envisat RA-2 on the Level 1b consolidated waveforms using 4 different re-trackers, RA calibration improvement, new precise orbit solution (POD), new ionospheric corrections (NICO09 until 1998 and GIM up to 2003), ECMWF ERA-interim model and updated SSB tables. This product contains only the low rate of 1 Hz data. The REAPER Meteo (ERS_ALT_2M) is a global product including data over ocean, ice and land. It should be noted that this product differs from the Envisat RA2 in the following ways: The product format; which is NetCDF (more details can be found in the Product Handbook), and not PDS The product is delivered based on orbit acquisition and not per pass (pole-to-pole). This product is extended through Envisat RA-2 data.
Data - Fast Registration with immediate access (Open)
ERS-1/2 Radar Altimeter REAPER Geophysical Data Record - GDR [ERS_ALT_2]
This is a RA Geophysical Data Record (GDR) product containing radar range, orbital altitude, wind speed, wave height and water vapour from the ATSR/MWR as well as geophysical corrections. The REAPER (REprocessing of Altimeter Products for ERS) product is generated by applying a similar processing as for Envisat RA-2 on the Level 1b consolidated waveforms using 4 different re-trackers, RA calibration improvement, new precise orbit solution (POD), new ionospheric corrections (NICO09 until 1998 and GIM up to 2003), ECMWF ERA-interim model and updated SSB tables. This product contains two data rates: a low rate of 1 Hz and a high rate of 20 Hz. Most 1 Hz data is also represented at 20 Hz, while microwave radiometer (ATSR/MWR) data and the atmospheric and geophysical corrections are only given at 1 Hz. The REAPER GDR (ERS_ALT_2_) is a global product including data over ocean, ice and land. It should be noted that this product differs from the Envisat RA2 in the following ways: The product format; which is NetCDF (more details can be found in the Product Handbook, and not PDS The product is delivered based on orbit acquisition and not per pass (pole-to-pole). This product is extended through Envisat RA-2 data.
Data - Fast Registration with immediate access (Open)
ERS-1/2 Radar Altimeter REAPER Sensor Geophysical Data Record - SGDR [ERS_ALT_2S]
This is a RA Geophysical Data Record (GDR) product containing radar range, orbital altitude, wind speed, wave height and water vapour from the ATSR/MWR as well as geophysical corrections. The REAPER (REprocessing of Altimeter Products for ERS) product is generated by applying a similar processing as for Envisat RA-2 on the Level 1b consolidated waveforms using 4 different re-trackers, RA calibration improvement, new precise orbit solution (POD), new ionospheric corrections (NICO09 until 1998 and GIM up to 2003), ECMWF ERA-interim model and updated SSB tables. This product contains two data rates: a low rate of 1 Hz and a high rate of 20 Hz. Most 1 Hz data is also represented at 20 Hz, while microwave radiometer (ATSR/MWR) data and the atmospheric and geophysical corrections are only given at 1 Hz. The REAPER GDR (ERS_ALT_2_) is a global product including data over ocean, ice and land. It should be noted that this product differs from the Envisat RA2 in the following ways: The product format; which is NetCDF (more details can be found in the Product Handbook, and not PDS The product is delivered based on orbit acquisition and not per pass (pole-to-pole). This product is extended through Envisat RA-2 data.
Data - Fast Registration with immediate access (Open)
GOME Total Column Water Vapour Climate product
The GOME Total Column Water Vapour (TCWV) Climate product was generated by the Max Planck Institute for Chemistry (MPIC), and the German Aerospace Center (DLR) within the ESA GOME-Evolution project. It is a Level 3 type product containing homogenized time-series of the global distribution of TCWV spanning over more than two decades (1995-2015). The data is provided as single netCDF file, containing monthly mean TCWV (units kg/m2) with 1-degree resolution, and is based on measurements from the satellite instruments ERS-2 GOME, Envisat SCIAMACHY, and MetOp-A GOME-2. Details are available in the paper by Beirle et al, 2018. Please also consult the GOME TCWV Product Quality Readme file before using the data.
Data - Fast Registration with immediate access (Open)
ERS-2 SCATTEROMETER Surface Soil Moisture Time Series and Orbit product in High and Nominal Resolution [SSM.H/N.TS - SSM.H/N]
Surface soil moisture records are derived from the backscatter coefficient measured by the Scatterometer on-board the European Remote Sensing satellite (ERS-2) using the Technische Universität (TU) Wien soil moisture retrieval algorithm called WARP (WAter Retrieval Package). In the WARP algorithm, the relative surface soil moisture estimates, given in degree of saturation Sd, range between 0% and 100% are derived by scaling the normalized backscatter between the lowest/highest backscatter values corresponding to the driest/wettest soil conditions. Surface Soil Moisture - Time Series product: The products generated are the surface soil moisture time series, where for each grid point defined in a DGG (Discrete Global Grid) is stored the time series of soil moisture and its noise, the surface state flag, the geolocation and the satellite parameters. The spatial resolution of the products is about 25 km x 25 km (high resolution) or 50 km x 50 km (nominal resolution) geo-referenced on the WARP grid. The location of the points can be viewed interactively with the tool DGG Point Locator. Surface Soil Moisture - Orbit product: In addition to WARP, a second software package, referred to as WARP orbit, was developed in response to the strong demand of soil moisture estimates in satellite orbit geometry. The Level 2 soil moisture orbit product contains a series of Level 1 data information, such as the backscatter, the incidence angle and the azimuth angle for each triplet together with the surface soil moisture and its noise, normalized backscatter at 40° incidence angle, parameters useful for soil moisture, the geolocation and the satellite parameters. The soil moisture orbit product is available in two spatial resolutions with different spatial sampling distances: Spatial sampling on a regular 12.5 km grid in orbit geometry with a spatial resolution of about 25 km x 25 km (High resolution) Spatial sampling on a regular 25 km grid in orbit geometry with a spatial resolution of about 50 km x 50 km (Nominal resolution). The spatial resolution is defined by the Hamming window function, which is used for re-sample of raw backscatter measurements to the orbit grid in the Level-1 ground processor. Please consult the Product Quality Readme file before using the ERS-2 Surface Soil Moisture data.
Data - Fast Registration with immediate access (Open)
ERS-1/2 SCATTEROMETER Ocean Wind field and Sea Ice probability [ASPS20.H/ASPS20.N]
The ASPS Level 2 products contain, for each node: the radar backscattering sigma nought for the three beams of the instrument, the four aliased wind solutions (Rank 1-4 wind vector) and the de-aliased wind vector flag, the sea-ice probability and sea-ice flag, the YAW quality flag. The wind retrieval is performed with the CMOD5N geophysical model function derived by ECMWF to compute the neutral winds rather than 10 m winds. ASPS L2.0 High resolution products are provided with a spatial resolution of 25x25 km and a grid spacing of 12.5 km. ASPS L2.0 Nominal resolution products are provided with a spatial resolution of 50x50 km and a grid spacing of 25 km. One product covers one orbit from ascending node crossing. Please consult the Product Quality Readme file before using the ERS ASPS data.
Data - Fast Registration with immediate access (Open)
ERS-2 GOME Total Column Amount of Trace Gases Product
GOME Level 2 products were generated by DLR on behalf of the European Space Agency, and are the end result of the Level 1 to 2 reprocessing campaign of GOME Level 1 version 4 data with Level 2 GOME Data Processor (GDP) version 5.0 (HDF-5 format). The GOME Level 2 data product comprises the product header, total column densities of ozone and nitrogen dioxide and their associated errors, cloud properties and selected geo-location information, diagnostics from the Level 1 to 2 algorithms and a small amount of statistical information.
Data - Fast Registration with immediate access (Open)
ERS-1/2 SCATTEROMETER Nominal Resolution back-scattering measurements, Ocean Wind field [UWI]
The ERS data reprocessed with the ASPS facility is also available in the UWI format to maintain the compatibility with the FD (Fast Delivery) products. The ASPS UWI product is organised in frames of 500 x 500 km providing the radar backscattering sigma nought for the three beams of the instrument plus the wind speed and direction. The wind retrieval is performed with the CMOD5N geophysical model function derived by ECMWF to compute the neutral winds rather than 10m winds. ASPS UWI products are provided with a spatial resolution of 50 x 50 km and a grid spacing of 25 km. One product covers one orbit from ascending node crossing. Please consult the Product Quality Readme file before using the ERS ASPS data.
Data - Fast Registration with immediate access (Open)
ERS-2 GOME Spectral Product L1
GOME Level 1 products contain Earthshine radiance at the Top of the Atmosphere and solar irradiance spectra. They were generated by DLR on behalf of the European Space Agency with Level 1 GOME Data Processor (GDP-L1) starting from the Extracted GOME Calibration (EGOC) Level 0 data files. Originally raw detector signals (binary Analog to Digital Converted units) of the science measurements plus calibration constants were provided (dataset version 4 and lower), but following the end of the operational phase of the ERS-2 mission (2 July 2011), as part of ESA's post-operational algorithm improvement activities (Coldewey-Egbers et al., 2018), the GOME Level 1 data type was entirely revised and a dataset of fully calibrated and ready to use data was generated with GOME processor version 5.1. The version 5.1 data bring relevant quality improvements for the revised calibration approach, compensating aging and instrument degradation, and provide enhanced accessibility. The version 5.1 data are in NetCDF format and differ fundamentally from the previous GOME Level 1 data, having the Envisat proprietary format and basically containing Level 1a data where a dedicated extraction software tool had to be applied by end user to obtain spectrally and radiometrically calibrated radiances (including the correction for polarisation, leakage current and stray light). Such calibrations are now applied to the version 5.1 L1b data product in the standard processing. Users of GOME Level 1 products are strongly recommended to migrate to the latest reprocessed dataset. Please consult the GOME Product Quality Readme file before using the data.
Data - Fast Registration with approval (Restrained)
ERS-1/2 ATSR Averaged Surface Temperature [AT1/AT2_AR__2P]
The Averaged Surface Temperature Product (AST) contains averaged geophysical data at two different resolutions, and with respect to two different averaging schemes: measurement data sets at resolutions of 0.5 by 0.5 degrees and 10 by 10 arcmin with respect to a latitude/longitude grid; other data sets contain data averaged over equal area cells of 50 by 50 km and 17 by 17 km aligned with the satellite ground track. Both top-of-atmosphere and surface data sets are provided. The surface temperature data sets provide, for sea cells, nadir and dual view sea surface temperatures, and for land cells, land surface temperature (currently 11 micron BT) and NDVI. Cloud data is also included. No ADS are included in the AST product; auxiliary data is contained within the MDS. The data sets of the AST product are arranged by surface type and resolution. The 3rd reprocessing of ATSR data was performed in 2013; the processing updates that have been put in place and the scientific improvements are outlined in full in the User Summary Note for the Third ERS ATSR Reprocessing.
Data - Fast Registration with approval (Restrained)
ERS-1/2 ATSR Gridded Surface Temperature [AT1/AT2_NR__2P]
The Gridded Surface Temperature (GST) Product is the Level 2 full resolution geophysical product. The product contains gridded sea-surface temperature images using both nadir and dual view retrieval algorithms. The product includes pixel latitude/longitude positions, X/Y offset and the results of the cloud-clearing/land-flagging. It contains a single measurement data set the content of which is switchable, that is to say, the content of each pixel field will depend on the surface type. Specifically, the contents of the data fields will depend on the setting of the forward and nadir cloud flags and the land flag. The 3rd reprocessing of ATSR data was performed in 2013; the processing updates that have been put in place and the scientific improvements are outlined in full in the User Summary Note for the Third ERS ATSR Reprocessing.
Data - Fast Registration with approval (Restrained)
ERS-1/2 ATSR Gridded Brightness Temperature/Reflectance [AT1/AT2_TOA_1P]
The Gridded Brightness Temperature/Reflectance (GBTR) product contains top of atmosphere (TOA) brightness temperature (BT) values for the infra-red channels and reflectance values for the visible channels. Values for each channel and for the nadir and forward views occupy separate measurement data sets. Additional MDS contain cloud and land/sea flags and confidence flags for each image pixel. The 3rd reprocessing of ATSR data was performed in 2013; the processing updates that have been put in place and the scientific improvements are outlined in full in the User Summary Note for the Third ERS ATSR Reprocessing.
Data - Campaigns (Open)
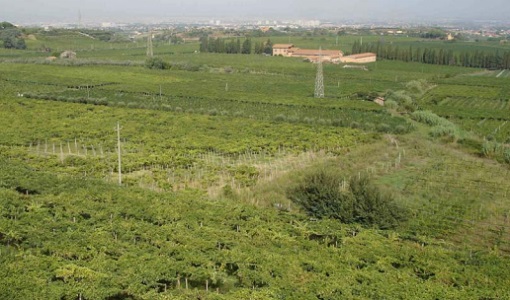
BACCHUS-DOC
The BACCHUS-DOC Radar and Optical Campaign was an area mapping project of vineyards near Frascati (Italy). ESA required high resolution geo-referenced airborne SAR data of different wavelength and polarisation (preferably polarimetric).