- All Categories (592)
- Data (10)
- News (10)
- Missions (3)
- Events (8)
- Tools (3)
- Activities (4)
- Campaigns (7)
- Documents (547)
DATA
Discover and download the Earth observation data you need from the broad catalogue of missions the European Space Agency operate and support.
Data - Project Proposal (Restrained)

Spire live and historical data
The data collected by Spire from it's 110 satellites launched into Low Earth Orbit (LEO) has a diverse range of applications, from analysis of global trade patterns and commodity flows to aircraft routing to weather forecasting. The data also provides interesting research opportunities on topics as varied as ocean currents and GNSS-based planetary boundary layer height. The following products can be requested: ADS-B Data Stream Global ADS-B satellite data observed by Spire satellites and processed through the ground stations network. Historical ADS-B data older than 6 months can be delivered as data cuts containing CSV file(s) accessible through a Web Service or Cloud storage solutions. Live ADS-B data is available through a streaming API, and recent historical data can be accessed through a REST API. Data is distributed as a monthly subscription: historical data can be requested starting from 3 December 2008, the time period for live data starts from a user-defined date and continues for 30 days AIS AIS messages include satellite AIS (S-AIS) as observed by Spire satellites and terrestrial AIS (T-AIS) from third party sensor stations (up to 40 million messages per day). Historical AIS data are delivered as a cvs file with availability back to June 2016 or via Historical API from December 2018; live AIS data are pushed to end users via TCP or through Messages API. Data is distributed as a monthly subscription, from a user-defined date and continues for a 30 day period. GNSS-Radio Occultation GNSS Radio Occultation (GNSS-RO) measurements are collected globally on a continuous basis, generating profiles of the Earth’s atmosphere. Derived Level 1 and Level 2 products include both atmospheric and ionospheric products. Historical data for most of the GNSS-RO products are available from December 2018 to the present. Near real-time (within 90 minutes or less latency from collection to delivery) GNSS-RO profiles are also available upon request. GNSS Reflectometry GNSS Reflectometry (GNSS-R) is a technique to measure Earth’s surface properties using reflections of GNSS signals in the form of a bistatic radar. Spire collects two types of GNSS-R data: conventional, near-nadir incidence LHCP reflections collected by the Spire GNSS-R satellites (e.g., Spire GNSS-R “Batch-1” satellites) and grazing angle (i.e., low elevation angle) RHCP reflections collected by the Spire GNSS-RO satellites. Derived Level 1 and Level 2 products are available, as well as some special Level 0 raw intermediate frequency (IF) data. Historical grazing angle GNSS-R data are available from May 2019 to the present, while conventional GNSS-R data are available from December 2020 to the present. In addition, also Polarimetric Radio Occultation (PRO) measurements are available Name Description Data format and content Application Automatic Identification System (AIS) The automatic identification system (AIS) is an automatic tracking system that uses transponders on ships and is used by vessel traffic services. Spire data includes satellite AIS (S-AIS) as observed by Spire satellites and terrestrial AIS (T-AIS) from third party sensor stations. .parquet.gz files The AIS files contain time-series data on received AIS messages, both the raw NMEA message and added post-processing data for each message. Supply chain analysis, commodity trading, identification of illegal fishing or dark targets, ship route and fuel use optimization, analysis of global trade patterns, anti-piracy, autonomous vessel software, ocean currents Automatic Dependent Surveillance-Broadcast (ADS-B) Spire AirSafe ADS-B products give access to satellite and terrestrial ADS-B data from captured aircrafts. .csv.gz files The decompressed csv file contains a list of hexadecimal representations of ADS-B messages associated with the timestamp they were received on the satellite. Fleet management, ICAO regulatory compliance, route optimization, predictive maintenance, global airspace, domain awareness Global Navigation Satellite System Radio Occultation (GNSS-RO) GNSS atmospheric radio occultation (GNSS-RO) relies on the detection of a change in a radio signal as it passes through a planet's atmosphere, i.e. as it is refracted by the atmosphere. This data set contains precise orbit determination (POD) solutions, satellite attitude information, high-rate occultation observations, excess phase, and derived atmospheric dry temperature profiles. podObs*.rnx This file contains raw pseudorange, carrier phase, Doppler frequency, and signal-to-noise measurements for each observed GPS signal from a single Spire satellite which allow to estimate the positions and velocities of each Spire satellite and also used to derive ionospheric total electron content data. leoOrb*.sp3 This file contains the estimated position, velocity and receiver clock error of a given Spire satellite after processing of the POD observation file leoAtt*.log It contains 1 Hz rate quaternion information measured from a single Spire satellite describing the satellite orientation. opnGns*ro.bin, opnGns*rst.bin these files contain raw measurements from the occulting GNSS satellite (one for each signal frequency) and raw phase data from one or more reference GNSS satellites. atmPhs* The file contains occultation excess phase delay. Also contains SNR values, ransmitter and receiver positions and open loop model information atmPrf*.nc The file contains profiles of atmospheric dry pressure, dry temperature and neutral refractivity as a function of altitude produced from full processing of one occultation event. bfrPrf*.bufr The file contains derived profiles of dry pressure, dry temperature, refractivity and bending angle for each occultation. Atmospheric profiles of pressure, dry temperature, bending angle, and refractivity used in numerical weather prediction data assimilation and climate change studies. Raw IF samples from GNSS-RO satellites Raw intermediate frequency (IF) sampled data (I/Q) from the GNSS receiver front-end of GNSS-RO satellites. rocRIF*.zip Binary raw IF data and associated ancillary data (e.g., POD data) in a zip archive per collection event. GNSS-RO studies, GNSS RFI and jamming monitoring, research. Raw IF samples from GNSS-R satellites Raw intermediate frequency (IF) sampled data (I/Q) from the GNSS receiver front-end of conventional GNSS-R satellites. gbrRIF*.zip Binary raw IF data and associated ancillary data (e.g., POD data) in a zip archive per collection event. GNSS-R studies, GNSS RFI and jamming monitoring, research, etc. Grazing angle GNSS-R observations During grazing angle GNSS-R events, signal reflection at two frequencies is observed through the limb-facing antenna and is trackedusing an open-loop tracking technique thatrelies on a model topredict the propagationdelay and Doppler of thereflected signal. Simultaneous open-looptracking of the signaldirectly along theline-of-sight from thetransmitter to thereceiver is alsoperformed to provideadditional data that maybenecessary for signalcalibration. The mainoutput of the open-looptracking are in-phase (I)and quadrature (Q)accumulation samples(nominally at 50 Hz),which represent the residual Doppler (phase) from the model. grzObs*.nc L1A filecontains rawopen loopcarrier phasemeasurementsat 50 Hzsampling forgrazingangleGNSS-Rreflectionscaptured in the GNSS-RO RHC Pantennas, (bothdirect andreflectedsignals) on GNSS-RO satellites. Sea surface and sea ice height extent, and classification Georeferenced grazing angle GNSS-R observations The low-levelobservations of the high-rate grazing angle GNSS-R observationsbut withthegeoreferenced bistatic radar parameters of the satellite receiver,specular reflection, and GNSS transmitter included. grzRfl*.nc L1B file contains the georeferenced grazing angle GNSS-R data collected by Spire GNSS-RO satellites, including the low-level observables and bistatic radar geometries (e.g., receiver, specular reflection, and the transmitter locations). Sea surface and sea ice height extent, and classification GNSS-R calibrated bistatic radar reflectivities Higher level product used to derive land-surface reflectivity. gbrRfl*.nc L1A along-track calibrated relative power between reflected and direct signals (e.g., bistatic radar reflectivities) measured by Spire conventional GNSS-R satellites. GNSS-R studies, soil moisture, ocean wind, and sea ice applications GNSS-R calibrated bistatic radar cross-sections Higher level product used to derive ocean surface roughness products. gbrRCS*.nc L1B along-track calibrated and normalized bistatic radar cross-sections measured by Spire conventional GNSS-R satellites. GNSS-R studies, ocean wind and sea ice applications Combined Surface Soil Moisture Combined CYGNSS and SMAP soil moisture data are provided as a combined surface soil moisture (COMB-SSM) product in two data level formats: L2U1 and L3U1. 6 x 6 km grid cell. L-band measurements of surface soil moisture benefit from better vegetation penetration in comparison to traditional C-band measurements. COMB-SSM.nc This file contains the combined data product containing measurements from both CYGNSS and SMAP reported on a 6 km global Equi7Grid grid. Agriculture, crop insurance, farming solutions, climatology, terrain awareness, peatlands and wetlands monitoring etc Ionosphere total electron content Spire routinely collects and processes a large volume of total electron content (TEC) data, representing the line-of-sight integration of electron density between a Spire satellite and a GNSS satellite. Each file contains line-of-sight ionospheric total electron content (TEC) estimates derived for a ‘single viewing arc’ contained in the POD observation file. Viewing arcs are at least 10 minutes in duration. podTec*.nc This file contains the line-of-sight total electron content with associated orbital information. Space weather research, tsunamigenic earthquakes, weather applications, space situational awareness (SSA), autonomous vehicles etc Ionosphere scintillation The scintillation index for each GNSS frequency is computed onboard the spacecraft. This index provides a measure of the fluctuations of the GNSS signal over the course of 10 seconds caused by propagation of the radio signals through electron density irregularities in the ionosphere. After the raw indices are downlinked to the ground, they are packaged along with associated metadata such as orbit position to create the final scintillation data product. scnLv1*.nc This file contains on-board computed scintillation data (S4 only) with associated orbital information Space weather research, solar events, TIDs, weather applications positioning and navigation, communications etc Electron density profile Electron density profiles are retrieved as a function of altitude. Electron density profiles are processed from podTec netcdf files, which span a sufficient elevation angle range. A standard Abel inversion algorithm is applied to retrieve the profiles. ionPrf*.nc This file contains electron density profile retrieved from podTec files spanning appropriate elevation angle range Space weather research, solar events, TIDs, weather applications positioning and navigation, communications Polarimetric Radio Occultation (PRO) measurements PRO measurements observe the properties of GNSS signals as they pass through by Earth's atmosphere; the polarization state of the signals is recorded separately for H and V polarizations to provide information on the anisotropy of hydro-meteors along the propagation path. proObs Level 0 - Raw open loop carrier phase measurements at 50 Hz sampling for both linear polarization components (horizontal and vertical) of the occulted GNSS signal. leoOrb*.sp3 This file contains the estimated position, velocity and receiver clock error of a given Spire satellite after processing of the POD observation file h(v)(c)atmPhs Level 1B - Atmospheric excess phase delay computed for each individual linear polarization component (hatmPhs, vatmPhs) and for the combined (“H” + “V”) signal (catmPhs). Also contains values for signal-to-noise ratio, transmitter and receiver positions and open loop model information. polPhs Level 1C - Combines the information from the hatmPhs and vatmPhs files while removing phase continuities due to phase wrapping and navigation bit modulation. patmPrfLevel 2 - Bending angle, dry refractivity, and dry temperature as a function of mean sea level altitude and impact parameter derived from the “combined” excess phase delay (catmPhs) PRO measurements add a sensitivity to ice and precipitation content alongside the traditional RO measurements of the atmospheric temperature, pressure, and water vapor. The products are available as part of the Spire provision with worldwide coverage. All details about the data provision, data access conditions and quota assignment procedure are described in the Terms of Applicability.
Data - Announcement of Opportunity (Restrained)
CLOSED - Announcement of Opportunity for Spire data
An opportunity for scientists and researchers to access Spire data.
Data - Fast Registration with immediate access (Open)
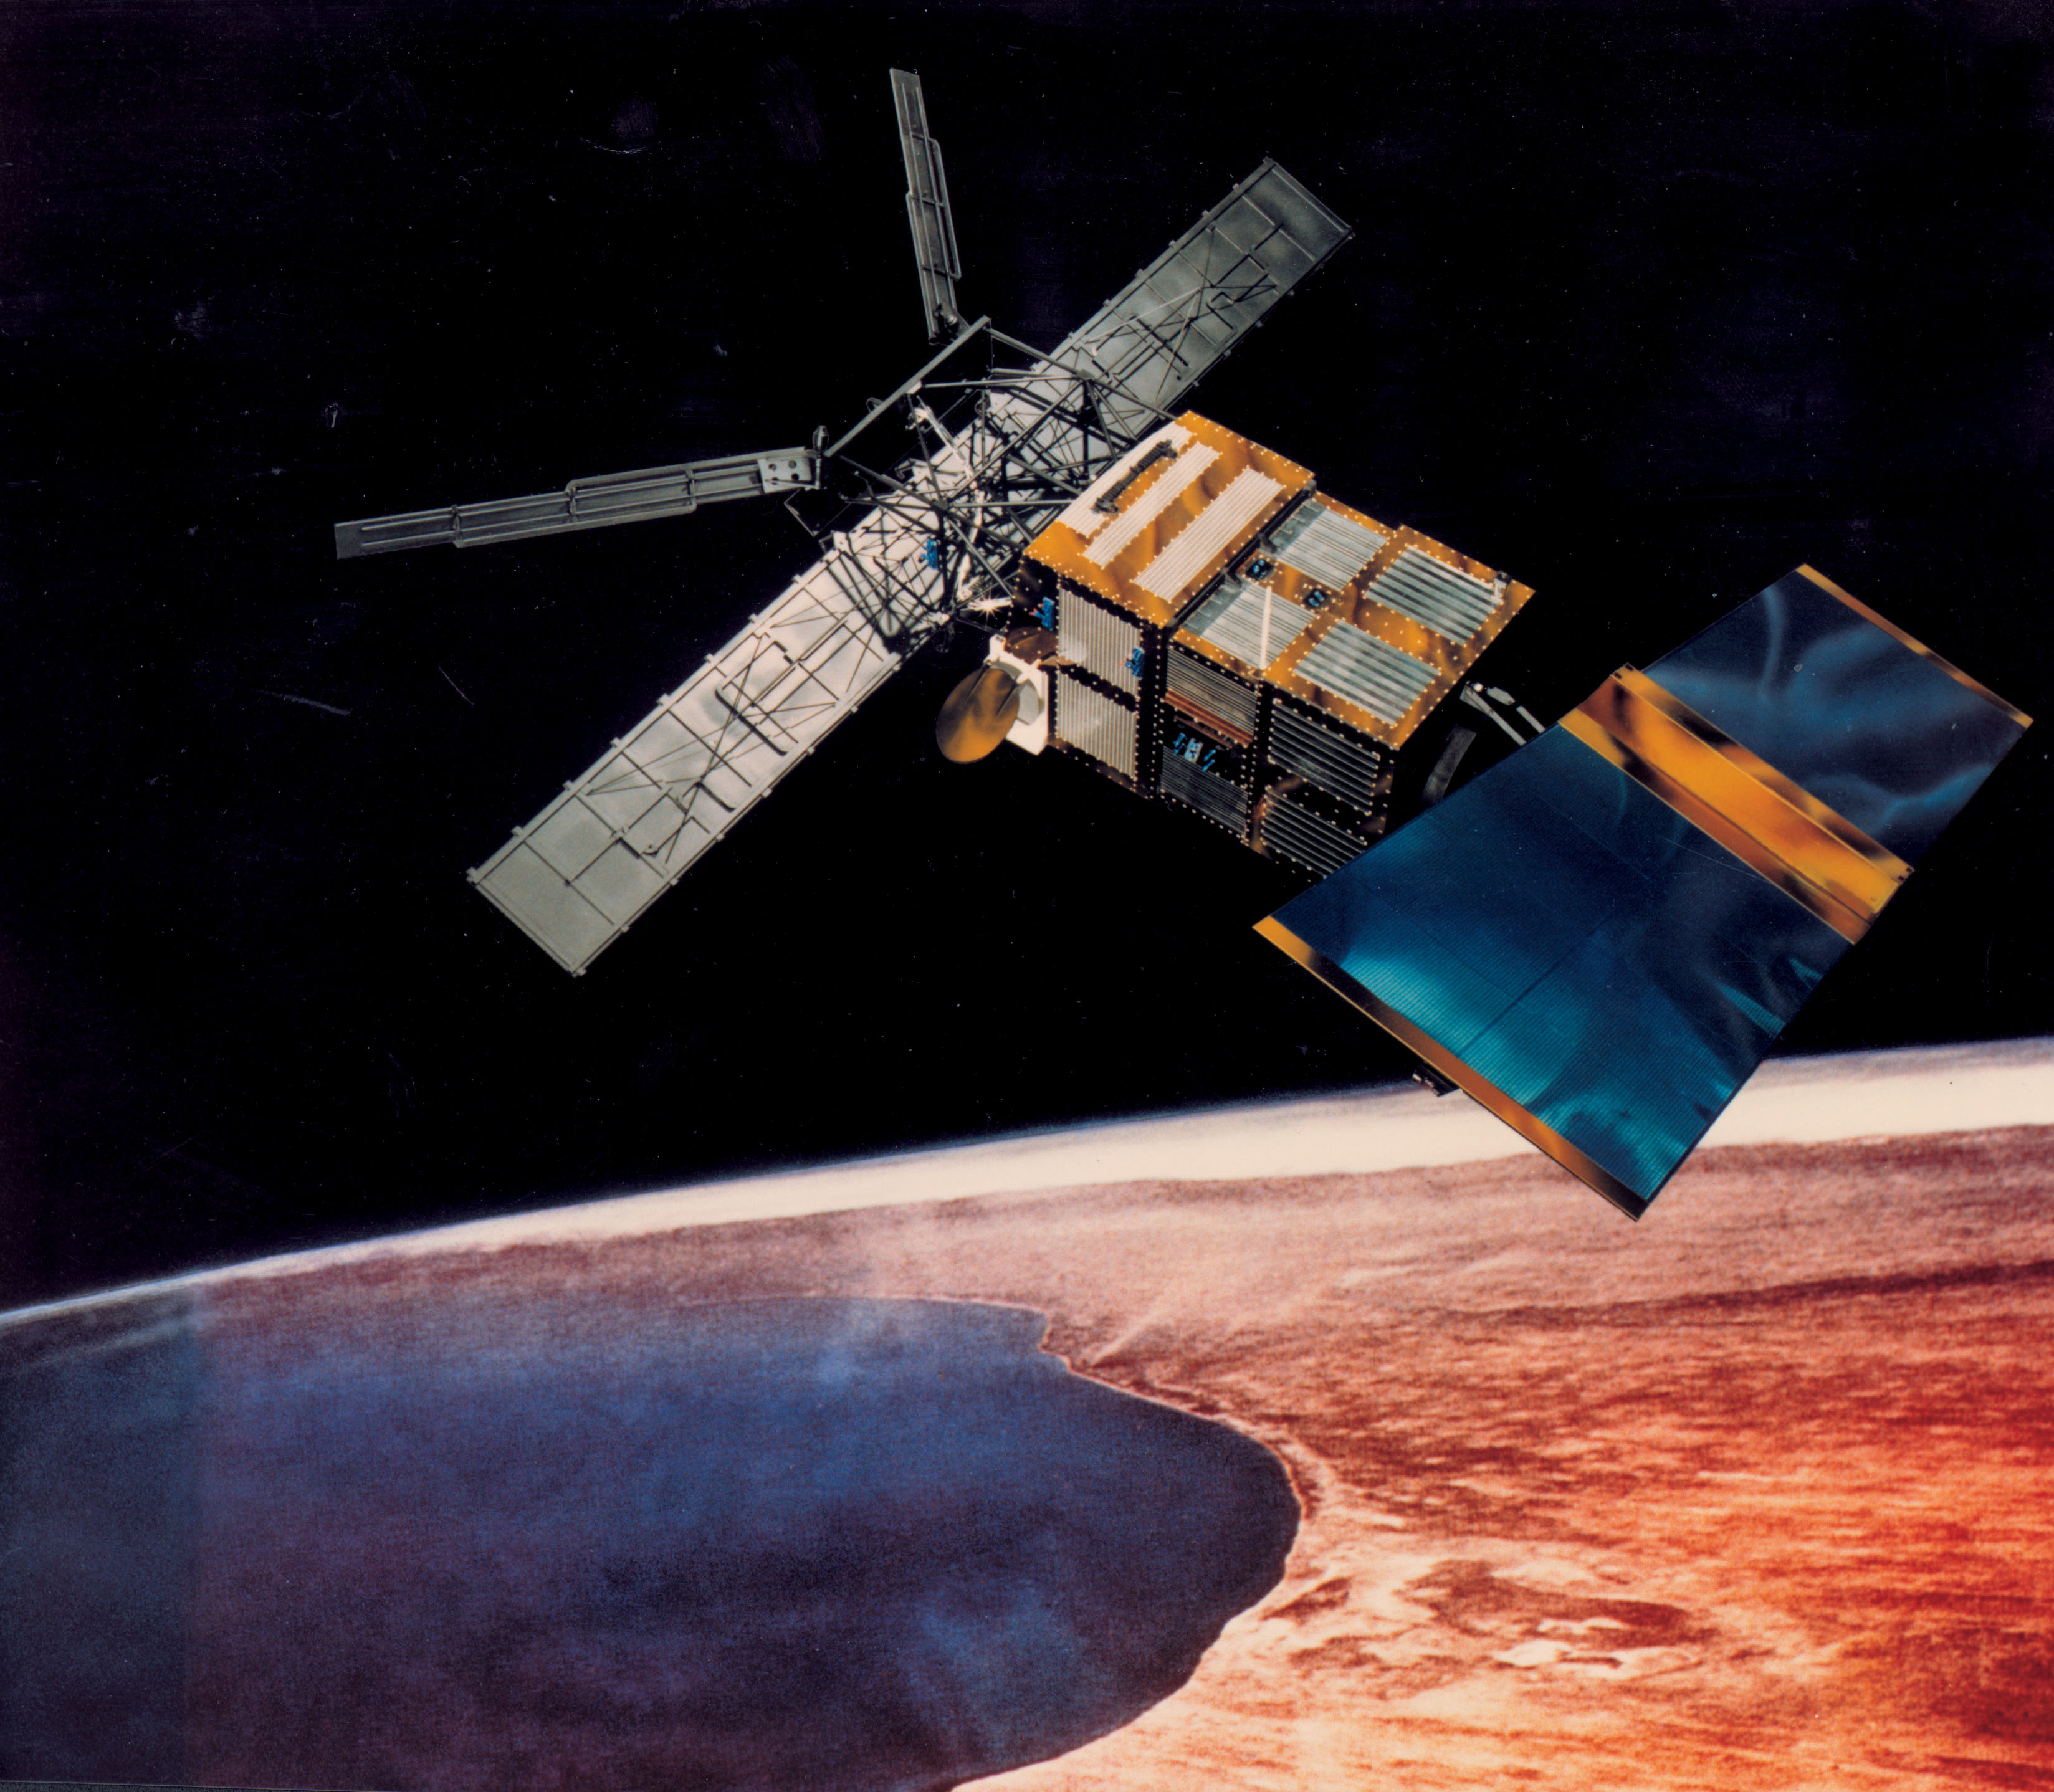
ERS-2 SCATTEROMETER Surface Soil Moisture Time Series and Orbit product in High and Nominal Resolution [SSM.H/N.TS - SSM.H/N]
Surface soil moisture records are derived from the backscatter coefficient measured by the Scatterometer on-board the European Remote Sensing satellite (ERS-2) using the Technische Universität (TU) Wien soil moisture retrieval algorithm called WARP (WAter Retrieval Package). In the WARP algorithm, the relative surface soil moisture estimates, given in degree of saturation Sd, range between 0% and 100% are derived by scaling the normalized backscatter between the lowest/highest backscatter values corresponding to the driest/wettest soil conditions. Surface Soil Moisture - Time Series product: The products generated are the surface soil moisture time series, where for each grid point defined in a DGG (Discrete Global Grid) is stored the time series of soil moisture and its noise, the surface state flag, the geolocation and the satellite parameters. The spatial resolution of the products is about 25 km x 25 km (high resolution) or 50 km x 50 km (nominal resolution) geo-referenced on the WARP grid. The location of the points can be viewed interactively with the tool DGG Point Locator. Surface Soil Moisture - Orbit product: In addition to WARP, a second software package, referred to as WARP orbit, was developed in response to the strong demand of soil moisture estimates in satellite orbit geometry. The Level 2 soil moisture orbit product contains a series of Level 1 data information, such as the backscatter, the incidence angle and the azimuth angle for each triplet together with the surface soil moisture and its noise, normalized backscatter at 40° incidence angle, parameters useful for soil moisture, the geolocation and the satellite parameters. The soil moisture orbit product is available in two spatial resolutions with different spatial sampling distances: Spatial sampling on a regular 12.5 km grid in orbit geometry with a spatial resolution of about 25 km x 25 km (High resolution) Spatial sampling on a regular 25 km grid in orbit geometry with a spatial resolution of about 50 km x 50 km (Nominal resolution). The spatial resolution is defined by the Hamming window function, which is used for re-sample of raw backscatter measurements to the orbit grid in the Level-1 ground processor. Please consult the Product Quality Readme file before using the ERS-2 Surface Soil Moisture data.
Data - Fast Registration with immediate access (Open)
ERS-1/2 SCATTEROMETER Ocean Wind field and Sea Ice probability [ASPS20.H/ASPS20.N]
The ASPS Level 2 products contain, for each node: the radar backscattering sigma nought for the three beams of the instrument, the four aliased wind solutions (Rank 1-4 wind vector) and the de-aliased wind vector flag, the sea-ice probability and sea-ice flag, the YAW quality flag. The wind retrieval is performed with the CMOD5N geophysical model function derived by ECMWF to compute the neutral winds rather than 10 m winds. ASPS L2.0 High resolution products are provided with a spatial resolution of 25x25 km and a grid spacing of 12.5 km. ASPS L2.0 Nominal resolution products are provided with a spatial resolution of 50x50 km and a grid spacing of 25 km. One product covers one orbit from ascending node crossing. Please consult the Product Quality Readme file before using the ERS ASPS data.
Data - Fast Registration with immediate access (Open)
ERS-1/2 SCATTEROMETER Nominal Resolution back-scattering measurements, Ocean Wind field [UWI]
The ERS data reprocessed with the ASPS facility is also available in the UWI format to maintain the compatibility with the FD (Fast Delivery) products. The ASPS UWI product is organised in frames of 500 x 500 km providing the radar backscattering sigma nought for the three beams of the instrument plus the wind speed and direction. The wind retrieval is performed with the CMOD5N geophysical model function derived by ECMWF to compute the neutral winds rather than 10m winds. ASPS UWI products are provided with a spatial resolution of 50 x 50 km and a grid spacing of 25 km. One product covers one orbit from ascending node crossing. Please consult the Product Quality Readme file before using the ERS ASPS data.
Data - External Data (Restrained)

ADAM Surface Reflectance Database v4.0
ADAM enables generating typical monthly variations of the global Earth surface reflectance at 0.1° spatial resolution (Plate Carree projection) and over the spectral range 240-4000 nm. The ADAM product is made of gridded monthly mean climatologies over land and ocean surfaces, and of a companion API toolkit that enables the calculation of hyperspectral (at 1 nm resolution over the whole 240-4000 nm spectral range) and multidirectional reflectances (i.e. in any illumination/viewing geometry) depending on user choices. The ADAM climatologies that feed the ADAM calculation tools are: For ocean: Monthly chlorophyll concentration derived from SeaWiFS-OrbView-2 (1999-2009); it is used to compute the water column reflectance (which shows large spectral variations in the visible, but is insignificant in the near and mid infrared). Monthly wind speed derived from SeaWinds-QuikSCAT-(1999-2009); it is used to calculate the ocean glint reflectance. For land: Monthly normalized surface reflectances in the 7 MODIS narrow spectral bands derived from FondsdeSol processing chain of MOD09A1 products (derived from Aqua and Terra observations), on which relies the modelling of the hyperspectral/multidirectional surface (soil/vegetation/snow) reflectance. Uncertainty variance-covariance matrix for the 7 spectral bands associated to the normalized surface reflectance. For sea-ice: Sea ice pixels (masked in the original MOD09A1 products) have been accounted for by a gap-filling approach relying on the spatial-temporal distribution of sea ice coverage provided by the CryoClim climatology for year 2005.
Data - Campaigns (Open)
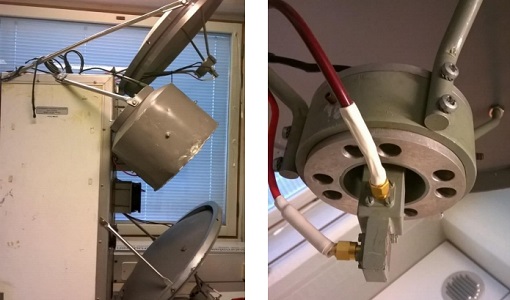
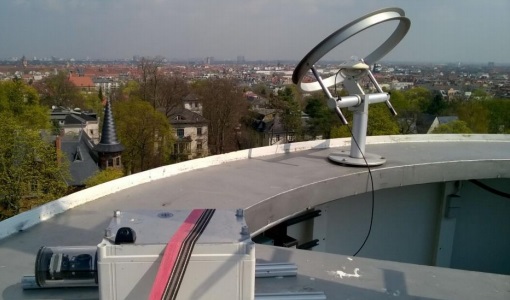
AirScatterGNSS
In this project an Airborne Wind Vector Scatterometer (AWVS) system was designed and built for measurements of sea surface backscattering from an aircraft.
Data - Campaigns (Open)

AfriScat
AfriScat campaign, a follow on to TropiSCAT campaign, was to acquire long-term P-Band radar data in an African tropical forest.
Data - Campaigns (Open)
AROMAT-II
This campaign covers the fields of atmospheric composition: NO2, SO2, aerosols, over Romania (Bucharest and Turceni) and Germany (Berlin).
Data - Campaigns (Open)

AROMAT-I
The main objective of this AROMAT-I campaign was to test newly developed airborne sensors and to evaluate their capabilities as validation tools for future air quality space borne sensors, in particular TROPOMI.