- All Categories (9347)
- Data (13)
- News (21)
- Missions (3)
- Events (23)
- Tools (4)
- Activities (6)
- Campaigns (7)
- Documents (9270)
DATA
Discover and download the Earth observation data you need from the broad catalogue of missions the European Space Agency operate and support.
Data - Announcement of Opportunity (Restrained)

Announcement of Opportunity for G-POD
ESA is offering all scientists the possibility to perform bulk processing and/or validation of their own algorithms exploiting the large ESA Earth-observation archive.
Data - EO Sign In Authentication (Open)
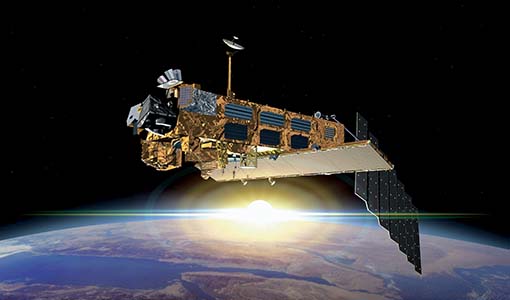
Envisat MIPAS L1 - Geo-located and calibrated atmospheric spectra [MIP_NL__1P]
This MIPAS Level 1 data product covers the geo-located, spectrally and radiometrically calibrated limb emission spectra in the 685-2410 cm-1 wave number range. It comprises 5 bands: 685-980 cm-1, 1010-1180 cm-1, 1205-1510 cm-1, 1560-1760 cm-1, 1810-2410 cm-1 and covers the following spatial ranges: Tangent height range: 5 to 170 km Pointing range: (azimuth pointing range relative to satellite velocity vector): 160° - 195° (rearward anti-flight direction); 80° - 110° (sideward anti-Sun direction). The instantaneous field of view (IFOV) is 0.05230 (elevation) x 0.5230 (azimuth)°. The length of measurement cell for an individual height step is approximately 300-500 km (dependent on tangent height and optical properties of the atmosphere). The spectral resolution spans from 0.030 to 0.035 cm-1, with a radiometric sensitivity of 4.2 to 50 nW / cm-1 / sr / cm2. The resolution range of the dataset is: 3 km (vertical) x 30 km (horizontal) at the tangent point. Please consult the Product Quality Readme file for MIPAS Level 1b IPF 8.03 before using the data.
Data - EO Sign In Authentication (Open)
Envisat MIPAS L2 - Temperature, pressure and atmospheric constituents profiles [MIPAS_2PS/2PE]
This MIPAS Level 2 data product describes localised vertical profiles of pressure, temperature and 21 target species (H2O, O3, HNO3, CH4, N2O, NO2, CFC-11, ClONO2, N2O5, CFC-12, COF2, CCL4, HCN, CFC-14, HCFC-22, C2H2, C2H6, COCl2, CH3Cl, OCS and HDO). It has a global coverage of Earth's stratosphere and mesosphere at all latitudes and longitudes. The vertical resolution of p, T and VMR profiles varies from 3 to 4 km, whereas the horizontal resolution is approximately 300 km to 500 km along track. This depends on the tangent height range and optical properties of the atmosphere. Auxiliary data include spectroscopic data, microwindows data, validation data, initial guess p, T and trace gas VMR profiles. The resolution range of the dataset is: 3 km (vertical) x 30 km (horizontal) at the tangent point. The latest reprocessed MIPAS Level 2 data (v8.22) is available as Standard products (MIPAS_2PS): A complete product containing 22 MIPAS L2 chemical species covering a single orbit and single species providing information generally needed by data users. Extended products (MIPAS_2PE): A complete product containing 22 MIPAS L2 chemical species covering a single orbit and single species intended for diagnostics and expert users who need complete information about the retrieval process. Both products are available in NetCDF format. Please refer to the MIPAS L2 v8.22 Product Quality Readme file for further details.
Data - Fast Registration with immediate access (Open)
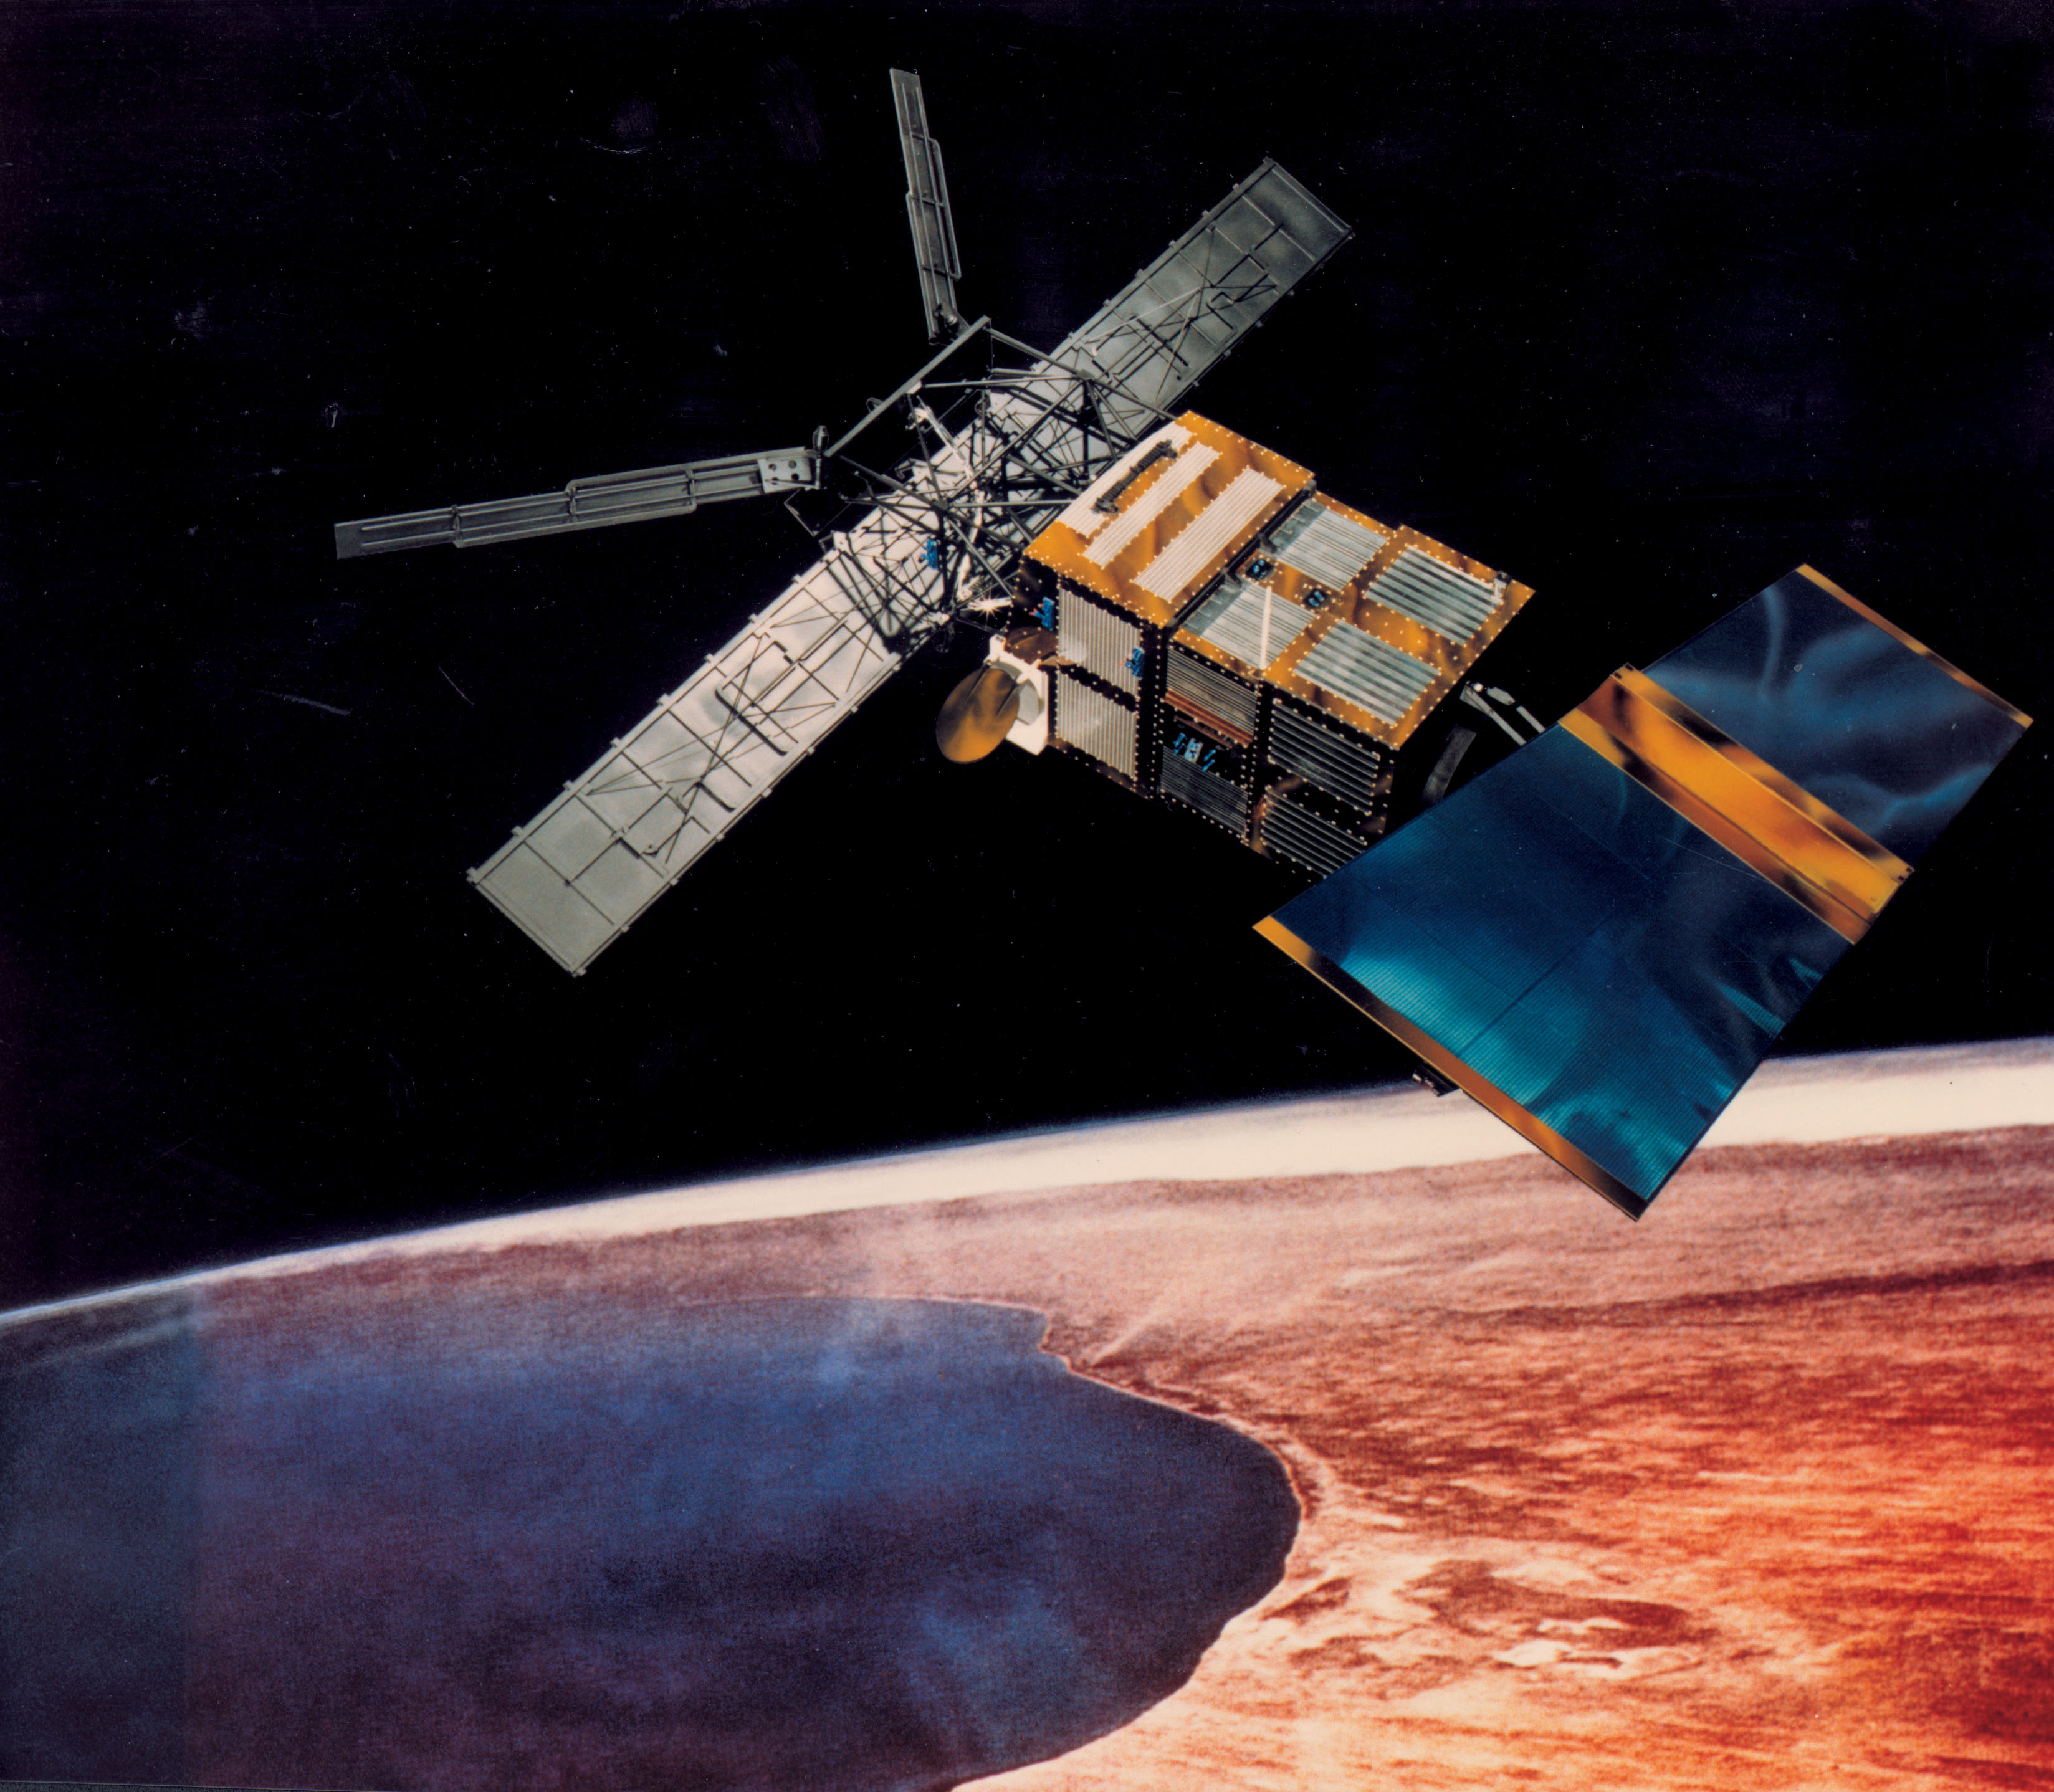
ERS-2 SCATTEROMETER Surface Soil Moisture Time Series and Orbit product in High and Nominal Resolution [SSM.H/N.TS - SSM.H/N]
Surface soil moisture records are derived from the backscatter coefficient measured by the Scatterometer on-board the European Remote Sensing satellite (ERS-2) using the Technische Universität (TU) Wien soil moisture retrieval algorithm called WARP (WAter Retrieval Package). In the WARP algorithm, the relative surface soil moisture estimates, given in degree of saturation Sd, range between 0% and 100% are derived by scaling the normalized backscatter between the lowest/highest backscatter values corresponding to the driest/wettest soil conditions. Surface Soil Moisture - Time Series product: The products generated are the surface soil moisture time series, where for each grid point defined in a DGG (Discrete Global Grid) is stored the time series of soil moisture and its noise, the surface state flag, the geolocation and the satellite parameters. The spatial resolution of the products is about 25 km x 25 km (high resolution) or 50 km x 50 km (nominal resolution) geo-referenced on the WARP grid. The location of the points can be viewed interactively with the tool DGG Point Locator. Surface Soil Moisture - Orbit product: In addition to WARP, a second software package, referred to as WARP orbit, was developed in response to the strong demand of soil moisture estimates in satellite orbit geometry. The Level 2 soil moisture orbit product contains a series of Level 1 data information, such as the backscatter, the incidence angle and the azimuth angle for each triplet together with the surface soil moisture and its noise, normalized backscatter at 40° incidence angle, parameters useful for soil moisture, the geolocation and the satellite parameters. The soil moisture orbit product is available in two spatial resolutions with different spatial sampling distances: Spatial sampling on a regular 12.5 km grid in orbit geometry with a spatial resolution of about 25 km x 25 km (High resolution) Spatial sampling on a regular 25 km grid in orbit geometry with a spatial resolution of about 50 km x 50 km (Nominal resolution). The spatial resolution is defined by the Hamming window function, which is used for re-sample of raw backscatter measurements to the orbit grid in the Level-1 ground processor. Please consult the Product Quality Readme file before using the ERS-2 Surface Soil Moisture data.
Data - Fast Registration with immediate access (Open)
ERS-1/2 SCATTEROMETER Ocean Wind field and Sea Ice probability [ASPS20.H/ASPS20.N]
The ASPS Level 2 products contain, for each node: the radar backscattering sigma nought for the three beams of the instrument, the four aliased wind solutions (Rank 1-4 wind vector) and the de-aliased wind vector flag, the sea-ice probability and sea-ice flag, the YAW quality flag. The wind retrieval is performed with the CMOD5N geophysical model function derived by ECMWF to compute the neutral winds rather than 10 m winds. ASPS L2.0 High resolution products are provided with a spatial resolution of 25x25 km and a grid spacing of 12.5 km. ASPS L2.0 Nominal resolution products are provided with a spatial resolution of 50x50 km and a grid spacing of 25 km. One product covers one orbit from ascending node crossing. Please consult the Product Quality Readme file before using the ERS ASPS data.
Data - Fast Registration with immediate access (Open)
ERS-1/2 SCATTEROMETER Nominal Resolution back-scattering measurements, Ocean Wind field [UWI]
The ERS data reprocessed with the ASPS facility is also available in the UWI format to maintain the compatibility with the FD (Fast Delivery) products. The ASPS UWI product is organised in frames of 500 x 500 km providing the radar backscattering sigma nought for the three beams of the instrument plus the wind speed and direction. The wind retrieval is performed with the CMOD5N geophysical model function derived by ECMWF to compute the neutral winds rather than 10m winds. ASPS UWI products are provided with a spatial resolution of 50 x 50 km and a grid spacing of 25 km. One product covers one orbit from ascending node crossing. Please consult the Product Quality Readme file before using the ERS ASPS data.
Data - External Data (Restrained)

ADAM Surface Reflectance Database v4.0
ADAM enables generating typical monthly variations of the global Earth surface reflectance at 0.1° spatial resolution (Plate Carree projection) and over the spectral range 240-4000 nm. The ADAM product is made of gridded monthly mean climatologies over land and ocean surfaces, and of a companion API toolkit that enables the calculation of hyperspectral (at 1 nm resolution over the whole 240-4000 nm spectral range) and multidirectional reflectances (i.e. in any illumination/viewing geometry) depending on user choices. The ADAM climatologies that feed the ADAM calculation tools are: For ocean: Monthly chlorophyll concentration derived from SeaWiFS-OrbView-2 (1999-2009); it is used to compute the water column reflectance (which shows large spectral variations in the visible, but is insignificant in the near and mid infrared). Monthly wind speed derived from SeaWinds-QuikSCAT-(1999-2009); it is used to calculate the ocean glint reflectance. For land: Monthly normalized surface reflectances in the 7 MODIS narrow spectral bands derived from FondsdeSol processing chain of MOD09A1 products (derived from Aqua and Terra observations), on which relies the modelling of the hyperspectral/multidirectional surface (soil/vegetation/snow) reflectance. Uncertainty variance-covariance matrix for the 7 spectral bands associated to the normalized surface reflectance. For sea-ice: Sea ice pixels (masked in the original MOD09A1 products) have been accounted for by a gap-filling approach relying on the spatial-temporal distribution of sea ice coverage provided by the CryoClim climatology for year 2005.
Data - Campaigns (Open)
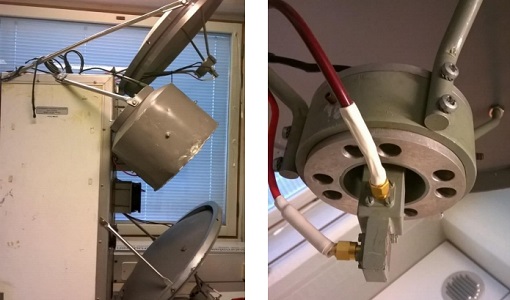
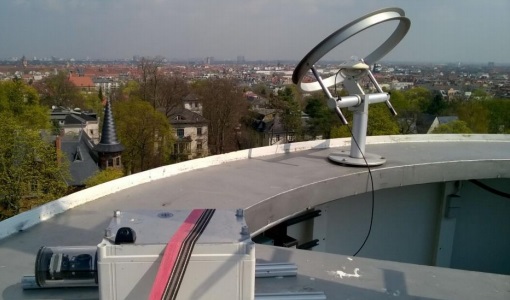
AirScatterGNSS
In this project an Airborne Wind Vector Scatterometer (AWVS) system was designed and built for measurements of sea surface backscattering from an aircraft.
Data - Campaigns (Open)

AfriScat
AfriScat campaign, a follow on to TropiSCAT campaign, was to acquire long-term P-Band radar data in an African tropical forest.
Data - Campaigns (Open)
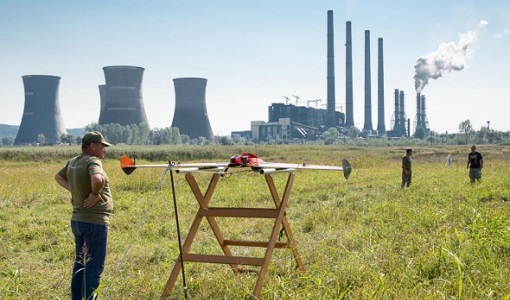
AROMAT-II
This campaign covers the fields of atmospheric composition: NO2, SO2, aerosols, over Romania (Bucharest and Turceni) and Germany (Berlin).
Data - Campaigns (Open)
AROMAT-I
The main objective of this AROMAT-I campaign was to test newly developed airborne sensors and to evaluate their capabilities as validation tools for future air quality space borne sensors, in particular TROPOMI.
Data - Campaigns (Open)
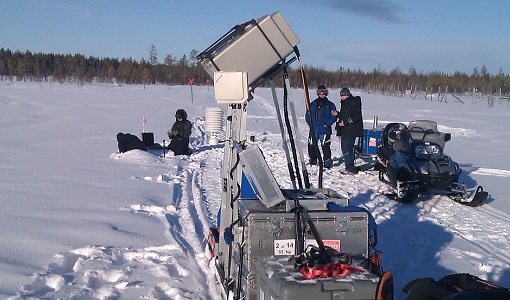
NoSREx-I -II and -III
The Nordic Snow Radar Experiment (NoSREx) took place between November 2009 and May 2010. The objective of the campaign was to provide a continuous time series of active and passive microwave observations of snow cover in a representative location.
Data - Campaigns (Open)
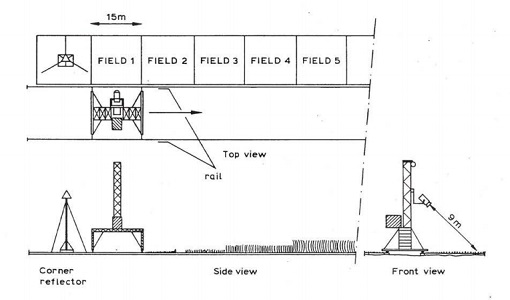
ROVE (1975-1981)
The Dutch research team ROVE (Radar Observation on Vegetation), funded by the remote sensing organization NIWARS, started in 1974 to investigate the scattering of microwaves by crops and soils, in order to help interpretation of radar imagery.