- All Categories (19368)
- Data (144)
- News (169)
- Missions (64)
- Events (85)
- Tools (12)
- Activities (16)
- Campaigns (61)
- Documents (18817)
DATA
Discover and download the Earth observation data you need from the broad catalogue of missions the European Space Agency operate and support.
Data - Campaigns (Open)
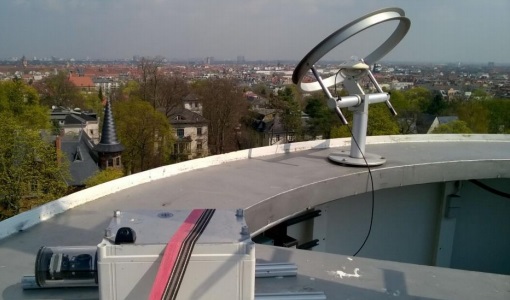
AROMAT-II
This campaign covers the fields of atmospheric composition: NO2, SO2, aerosols, over Romania (Bucharest and Turceni) and Germany (Berlin).
Data - Campaigns (Open)
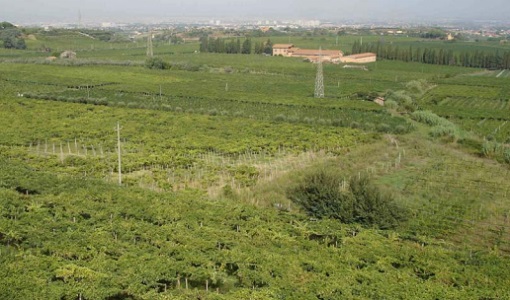
BACCHUS-DOC
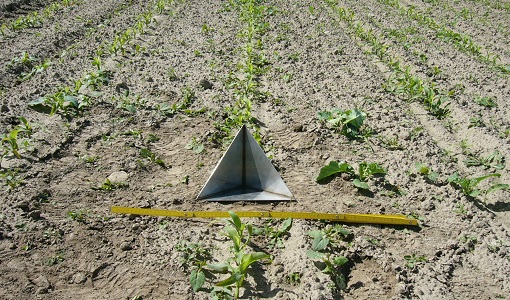
The BACCHUS-DOC Radar and Optical Campaign was an area mapping project of vineyards near Frascati (Italy). ESA required high resolution geo-referenced airborne SAR data of different wavelength and polarisation (preferably polarimetric).
Data - Campaigns (Open)
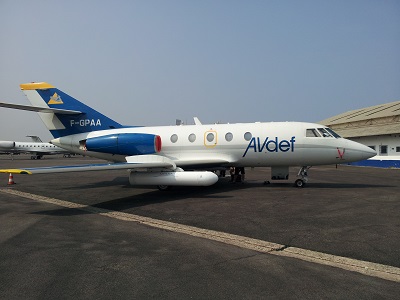
AfriSAR 2015
During the AfriSAR 2015 campaign, shared between ONERA (dry season, July 2015) and DLR (wet season 2016), Pol-InSAR and TomoSAR airborne data set were collected over four test sites over Africa, therefore covering different forest structures.
Data - Campaigns (Open)

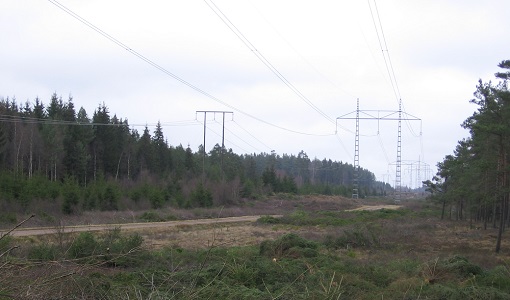
BelSAR 2018
The BelSAR project intended to carry out an airborne campaign for SAR bistatic interferometric measurements at L-band and full polarisation, over a test site in Belgium.
Data - Campaigns (Open)
BioSAR 2007
The BioSAR campaign aimed to support geophysical algorithm development, calibration/validation and the simulation of future spaceborne Earth Observation missions.
Data - Campaigns (Open)
WISE
The objective of WInd and Salinity Experiment 2001 (WISE 2001) was to get more data points and better wind speed (WS) measurements so as to reduce the sensitivity to WS uncertainty.
Data - Campaigns (Open)
BioSAR 2008
The main objective of BioSAR-2 (BioSAR 2008) campaign was to record SAR data over boreal forests with topographic effects to investigate the effect on biomass retrieval.
Data - Campaigns (Open)
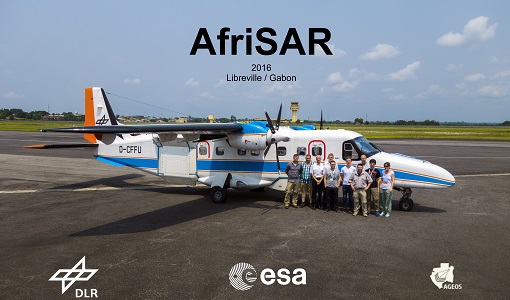
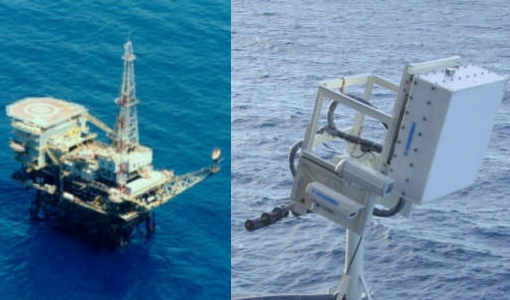
AfriSAR 2016
In order to further support the BIOMASS mission development, especially concerning the mission concept verification and the development of geophysical algorithms, ESA funded the AfriSAR campaign.
Data - Campaigns (Open)
AfriScat
AfriScat campaign, a follow on to TropiSCAT campaign, was to acquire long-term P-Band radar data in an African tropical forest.
Data - Campaigns (Open)
AGRISAR 2006
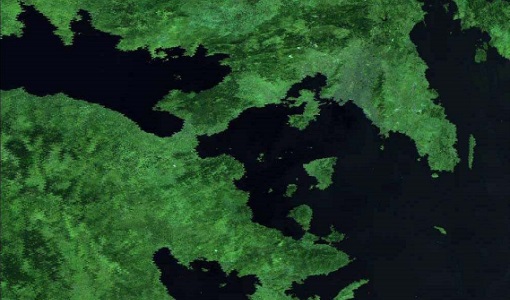
The AGRISAR 2006 campaign, carried out between 18 April and 2 August 2006, was established to address important specific programmatic needs of Sentinel-1 and -2.
Data - Campaigns (Open)
AgriSAR 2009
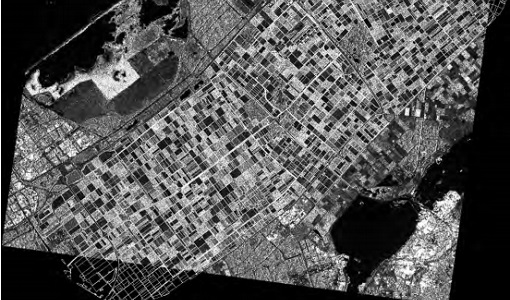
The AgriSAR 2009 campaign was defined to leverage the RADARSAT-2 mission to better understand and demonstrate the potential for GMES land monitoring user services, particularly in agriculture.
Data - Campaigns (Open)
THERMOPOLIS
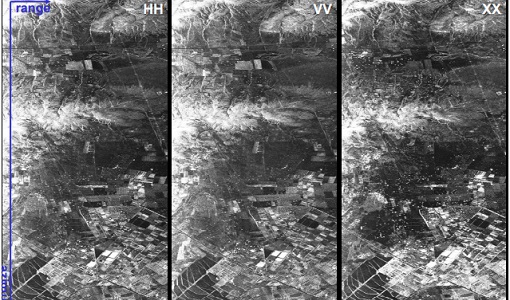
The THERMOPOLIS 2009 campaign mainly served the DUE “Urban Heat islands (UHI) and Urban Thermography (UT) Project”
Data - Campaigns (Open)

AIRFIRE
The fires observational campaign was performed during summer 2006 and dedicated to the study of fire emission in the spectral region VNIR-SWIR.
Data - Campaigns (Open)
AquiferEx
The AquiferEx Optical and Radar Campaign was in support of information product generation based on satellite data, harmonisation of satellite data acquisition performed among Aquifer and AquiferEx project partners.
Data - Campaigns (Open)
SPARC
ESA's SPectra bARrax Campaign (SPARC) activity was part of the preparatory study for a proposed ESA Earth Explorer mission called SPECTRA. The objective was to collect a CHRIS/PROBA reference dataset for SPECTRA-related studies.
Data - Campaigns (Open)
SoyFLEX 2015
SoyFLEX 2015 took place over the agricultural area around Jülich, Germany and Rzecin wetland site, Poland
Data
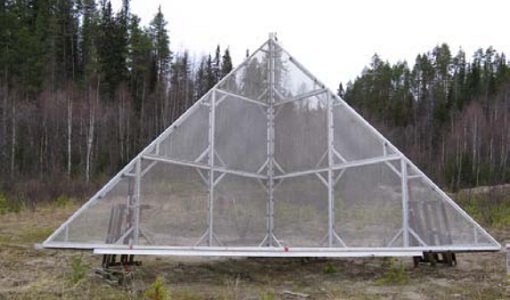
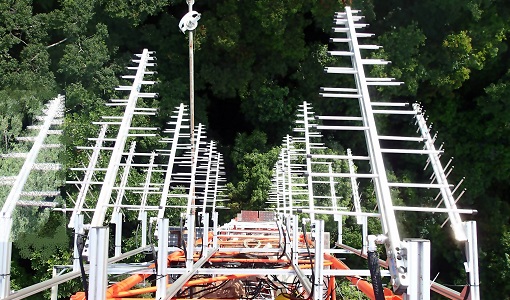
BorealScat
The main objective of “BorealScat – Technical Assistance for the Deployment of a Tower-based Radar and Geophysical Measurements during the BorealScat Experiment” was to characterise and quantify the temporal variations of radar observations of a forest stand over timescales ranging from seconds to years and to investigate the effects of environmental variables.
Data - Campaigns (Open)
CEFLES2
The objective of the CEFLES2 campaigns was to provide key reference data and background knowledge for the preparatory phases of the Sentinel‐2 and FLEX missions.
Data - Fast Registration with approval (Restrained)
ERS-1/2 ATSR Averaged Surface Temperature [AT1/AT2_AR__2P]
The Averaged Surface Temperature Product (AST) contains averaged geophysical data at two different resolutions, and with respect to two different averaging schemes: measurement data sets at resolutions of 0.5 by 0.5 degrees and 10 by 10 arcmin with respect to a latitude/longitude grid; other data sets contain data averaged over equal area cells of 50 by 50 km and 17 by 17 km aligned with the satellite ground track. Both top-of-atmosphere and surface data sets are provided. The surface temperature data sets provide, for sea cells, nadir and dual view sea surface temperatures, and for land cells, land surface temperature (currently 11 micron BT) and NDVI. Cloud data is also included. No ADS are included in the AST product; auxiliary data is contained within the MDS. The data sets of the AST product are arranged by surface type and resolution. The 3rd reprocessing of ATSR data was performed in 2013; the processing updates that have been put in place and the scientific improvements are outlined in full in the User Summary Note for the Third ERS ATSR Reprocessing.
Data - External Data (Restrained)

ADAM Surface Reflectance Database v4.0
ADAM enables generating typical monthly variations of the global Earth surface reflectance at 0.1° spatial resolution (Plate Carree projection) and over the spectral range 240-4000 nm. The ADAM product is made of gridded monthly mean climatologies over land and ocean surfaces, and of a companion API toolkit that enables the calculation of hyperspectral (at 1 nm resolution over the whole 240-4000 nm spectral range) and multidirectional reflectances (i.e. in any illumination/viewing geometry) depending on user choices. The ADAM climatologies that feed the ADAM calculation tools are: For ocean: Monthly chlorophyll concentration derived from SeaWiFS-OrbView-2 (1999-2009); it is used to compute the water column reflectance (which shows large spectral variations in the visible, but is insignificant in the near and mid infrared). Monthly wind speed derived from SeaWinds-QuikSCAT-(1999-2009); it is used to calculate the ocean glint reflectance. For land: Monthly normalized surface reflectances in the 7 MODIS narrow spectral bands derived from FondsdeSol processing chain of MOD09A1 products (derived from Aqua and Terra observations), on which relies the modelling of the hyperspectral/multidirectional surface (soil/vegetation/snow) reflectance. Uncertainty variance-covariance matrix for the 7 spectral bands associated to the normalized surface reflectance. For sea-ice: Sea ice pixels (masked in the original MOD09A1 products) have been accounted for by a gap-filling approach relying on the spatial-temporal distribution of sea ice coverage provided by the CryoClim climatology for year 2005.