- All Categories (292)
- Data (8)
- News (19)
- Missions (2)
- Events (17)
- Tools (8)
- Activities (4)
- Campaigns (2)
- Documents (232)
DATA
Discover and download the Earth observation data you need from the broad catalogue of missions the European Space Agency operate and support.
Data - Project Proposal (Restrained)

Spire live and historical data
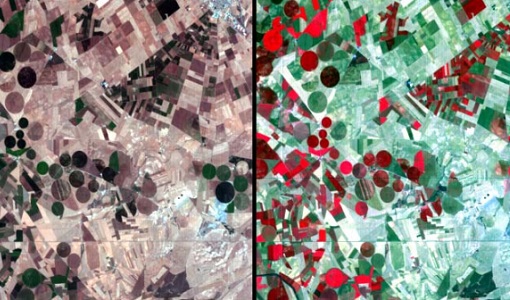
The data collected by Spire from it's 110 satellites launched into Low Earth Orbit (LEO) has a diverse range of applications, from analysis of global trade patterns and commodity flows to aircraft routing to weather forecasting. The data also provides interesting research opportunities on topics as varied as ocean currents and GNSS-based planetary boundary layer height. The following products can be requested: ADS-B Data Stream Global ADS-B satellite data observed by Spire satellites and processed through the ground stations network. Historical ADS-B data older than 6 months can be delivered as data cuts containing CSV file(s) accessible through a Web Service or Cloud storage solutions. Live ADS-B data is available through a streaming API, and recent historical data can be accessed through a REST API. Data is distributed as a monthly subscription: historical data can be requested starting from 3 December 2008, the time period for live data starts from a user-defined date and continues for 30 days AIS AIS messages include satellite AIS (S-AIS) as observed by Spire satellites and terrestrial AIS (T-AIS) from third party sensor stations (up to 40 million messages per day). Historical AIS data are delivered as a cvs file with availability back to June 2016 or via Historical API from December 2018; live AIS data are pushed to end users via TCP or through Messages API. Data is distributed as a monthly subscription, from a user-defined date and continues for a 30 day period. GNSS-Radio Occultation GNSS Radio Occultation (GNSS-RO) measurements are collected globally on a continuous basis, generating profiles of the Earth’s atmosphere. Derived Level 1 and Level 2 products include both atmospheric and ionospheric products. Historical data for most of the GNSS-RO products are available from December 2018 to the present. Near real-time (within 90 minutes or less latency from collection to delivery) GNSS-RO profiles are also available upon request. GNSS Reflectometry GNSS Reflectometry (GNSS-R) is a technique to measure Earth’s surface properties using reflections of GNSS signals in the form of a bistatic radar. Spire collects two types of GNSS-R data: conventional, near-nadir incidence LHCP reflections collected by the Spire GNSS-R satellites (e.g., Spire GNSS-R “Batch-1” satellites) and grazing angle (i.e., low elevation angle) RHCP reflections collected by the Spire GNSS-RO satellites. Derived Level 1 and Level 2 products are available, as well as some special Level 0 raw intermediate frequency (IF) data. Historical grazing angle GNSS-R data are available from May 2019 to the present, while conventional GNSS-R data are available from December 2020 to the present. Name Description Data format and content Application Automatic Identification System (AIS) The automatic identification system (AIS) is an automatic tracking system that uses transponders on ships and is used by vessel traffic services. Spire data includes satellite AIS (S-AIS) as observed by Spire satellites and terrestrial AIS (T-AIS) from third party sensor stations. .parquet.gz files The AIS files contain time-series data on received AIS messages, both the raw NMEA message and added post-processing data for each message. Supply chain analysis, commodity trading, identification of illegal fishing or dark targets, ship route and fuel use optimization, analysis of global trade patterns, anti-piracy, autonomous vessel software, ocean currents Automatic Dependent Surveillance-Broadcast (ADS-B) Spire AirSafe ADS-B products give access to satellite and terrestrial ADS-B data from captured aircrafts. .csv.gz files The decompressed csv file contains a list of hexadecimal representations of ADS-B messages associated with the timestamp they were received on the satellite. Fleet management, ICAO regulatory compliance, route optimization, predictive maintenance, global airspace, domain awareness Global Navigation Satellite System Radio Occultation (GNSS-RO) GNSS atmospheric radio occultation (GNSS-RO) relies on the detection of a change in a radio signal as it passes through a planet's atmosphere, i.e. as it is refracted by the atmosphere. This data set contains precise orbit determination (POD) solutions, satellite attitude information, high-rate occultation observations, excess phase, and derived atmospheric dry temperature profiles. podObs*.rnx This file contains raw pseudorange, carrier phase, Doppler frequency, and signal-to-noise measurements for each observed GPS signal from a single Spire satellite which allow to estimate the positions and velocities of each Spire satellite and also used to derive ionospheric total electron content data. leoOrb*.sp3 This file contains the estimated position, velocity and receiver clock error of a given Spire satellite after processing of the POD observation file leoAtt*.log It contains 1 Hz rate quaternion information measured from a single Spire satellite describing the satellite orientation. opnGns*ro.bin, opnGns*rst.bin these files contain raw measurements from the occulting GNSS satellite (one for each signal frequency) and raw phase data from one or more reference GNSS satellites. atmPhs* The file contains occultation excess phase delay. Also contains SNR values, ransmitter and receiver positions and open loop model information atmPrf*.nc The file contains profiles of atmospheric dry pressure, dry temperature and neutral refractivity as a function of altitude produced from full processing of one occultation event. bfrPrf*.bufr The file contains derived profiles of dry pressure, dry temperature, refractivity and bending angle for each occultation. Atmospheric profiles of pressure, dry temperature, bending angle, and refractivity used in numerical weather prediction data assimilation and climate change studies. Raw IF samples from GNSS-RO satellites Raw intermediate frequency (IF) sampled data (I/Q) from the GNSS receiver front-end of GNSS-RO satellites. rocRIF*.zip Binary raw IF data and associated ancillary data (e.g., POD data) in a zip archive per collection event. GNSS-RO studies, GNSS RFI and jamming monitoring, research. Raw IF samples from GNSS-R satellites Raw intermediate frequency (IF) sampled data (I/Q) from the GNSS receiver front-end of conventional GNSS-R satellites. gbrRIF*.zip Binary raw IF data and associated ancillary data (e.g., POD data) in a zip archive per collection event. GNSS-R studies, GNSS RFI and jamming monitoring, research, etc. Grazing angle GNSS-R observations During grazing angle GNSS-R events, signal reflection at two frequencies is observed through the limb-facing antenna and is trackedusing an open-loop tracking technique thatrelies on a model topredict the propagationdelay and Doppler of thereflected signal. Simultaneous open-looptracking of the signaldirectly along theline-of-sight from thetransmitter to thereceiver is alsoperformed to provideadditional data that maybenecessary for signalcalibration. The mainoutput of the open-looptracking are in-phase (I)and quadrature (Q)accumulation samples(nominally at 50 Hz),which represent the residual Doppler (phase) from the model. grzObs*.nc L1A filecontains rawopen loopcarrier phasemeasurementsat 50 Hzsampling forgrazingangleGNSS-Rreflectionscaptured in the GNSS-RO RHC Pantennas, (bothdirect andreflectedsignals) on GNSS-RO satellites. Sea surface and sea ice height extent, and classification Georeferenced grazing angle GNSS-R observations The low-levelobservations of the high-rate grazing angle GNSS-R observationsbut withthegeoreferenced bistatic radar parameters of the satellite receiver,specular reflection, and GNSS transmitter included. grzRfl*.nc L1B file contains the georeferenced grazing angle GNSS-R data collected by Spire GNSS-RO satellites, including the low-level observables and bistatic radar geometries (e.g., receiver, specular reflection, and the transmitter locations). Sea surface and sea ice height extent, and classification GNSS-R calibrated bistatic radar reflectivities Higher level product used to derive land-surface reflectivity. gbrRfl*.nc L1A along-track calibrated relative power between reflected and direct signals (e.g., bistatic radar reflectivities) measured by Spire conventional GNSS-R satellites. GNSS-R studies, soil moisture, ocean wind, and sea ice applications GNSS-R calibrated bistatic radar cross-sections Higher level product used to derive ocean surface roughness products. gbrRCS*.nc L1B along-track calibrated and normalized bistatic radar cross-sections measured by Spire conventional GNSS-R satellites. GNSS-R studies, ocean wind and sea ice applications Combined Surface Soil Moisture Combined CYGNSS and SMAP soil moisture data are provided as a combined surface soil moisture (COMB-SSM) product in two data level formats: L2U1 and L3U1. 6 x 6 km grid cell. L-band measurements of surface soil moisture benefit from better vegetation penetration in comparison to traditional C-band measurements. COMB-SSM.nc This file contains the combined data product containing measurements from both CYGNSS and SMAP reported on a 6 km global Equi7Grid grid. Agriculture, crop insurance, farming solutions, climatology, terrain awareness, peatlands and wetlands monitoring etc Ionosphere total electron content Spire routinely collects and processes a large volume of total electron content (TEC) data, representing the line-of-sight integration of electron density between a Spire satellite and a GNSS satellite. Each file contains line-of-sight ionospheric total electron content (TEC) estimates derived for a ‘single viewing arc’ contained in the POD observation file. Viewing arcs are at least 10 minutes in duration. podTec*.nc This file contains the line-of-sight total electron content with associated orbital information. Space weather research, tsunamigenic earthquakes, weather applications, space situational awareness (SSA), autonomous vehicles etc Ionosphere scintillation The scintillation index for each GNSS frequency is computed onboard the spacecraft. This index provides a measure of the fluctuations of the GNSS signal over the course of 10 seconds caused by propagation of the radio signals through electron density irregularities in the ionosphere. After the raw indices are downlinked to the ground, they are packaged along with associated metadata such as orbit position to create the final scintillation data product. scnLv1*.nc This file contains on-board computed scintillation data (S4 only) with associated orbital information Space weather research, solar events, TIDs, weather applications positioning and navigation, communications etc Electron density profile Electron density profiles are retrieved as a function of altitude. Electron density profiles are processed from podTec netcdf files, which span a sufficient elevation angle range. A standard Abel inversion algorithm is applied to retrieve the profiles. ionPrf*.nc This file contains electron density profile retrieved from podTec files spanning appropriate elevation angle range Space weather research, solar events, TIDs, weather applications positioning and navigation, communications The products are available as part of the Spire provision with worldwide coverage. All details about the data provision, data access conditions and quota assignment procedure are described in the Terms of Applicability.
Data - Announcement of Opportunity (Restrained)

Announcement of Opportunity for G-POD
ESA is offering all scientists the possibility to perform bulk processing and/or validation of their own algorithms exploiting the large ESA Earth-observation archive.
Data - Announcement of Opportunity (Restrained)
CLOSED - Announcement of Opportunity for Spire data
An opportunity for scientists and researchers to access Spire data.
Data - EO Sign In Authentication (Open)
Envisat MERIS Full Resolution - Level 1 [MER_FRS_1P/ME_1_FRG]
The MERIS Level 1 Full Resolution (FR) product contains the Top of Atmosphere (TOA) upwelling spectral radiance measurements. The in-band reference irradiances for the 15 MERIS bands are computed by averaging the in-band solar irradiance of each pixel. The in-band solar irradiance of each pixel is computed by integrating the reference solar spectrum with the band-pass of each pixel. The MERIS FR Level 1 product has Sentinel 3-like format starting from the 4th reprocessing data released to users in July 2020. Each measurement and annotation data file is in NetCDF 4. The Level 1 product is composed of 22 data files: 15 files containing radiances at each band (one band per file), accompanied by the associated error estimates, and 7 annotation data files. The 15 sun spectral flux values provided in the instrument data file of the Level 1 products are the in-band reference irradiances adjusted for the Earth-sun distance at the time of measurement. The band-pass of each pixel is derived from on-ground and in-flight characterisation via an instrument model. The values "Band wavelength" and "Bandwidth" provided in the Manifest file of the Level 1b products are the averaged band-pass of each pixel over the instrument field of view. Auxiliary data are also listed in the Manifest file associated to each product. The Level 1 FR product covers the complete instrument swath. The product duration is not fixed and it can span up to the time interval of the input Level 0 (for a maximum of 20 minutes). Thus the estimated size of the Level 1 FR is dependent on the start/stop time of the acquired segment. During the Envisat mission, acquisition of MERIS Full Resolution data was subject to dedicated planning based on on-demand ordering and coverage of specific areas according to operational recommendations and considerations. See yearly and global density maps to get a better overview of the MERIS FR coverage.
Data - EO Sign In Authentication (Open)
Envisat MERIS Full Resolution - Level 2 [MER_FRS_2P/ME_2_FRG]
MERIS FR Level 2 is a Full-Resolution Geophysical product for Ocean, Land and Atmosphere. Each MERIS Level 2 geophysical product is derived from a MERIS Level 1 product and auxiliary parameter files specific to the MERIS Level 2 processing. The MERIS FR Level 2 product has Sentinel 3-like format starting from the 4th reprocessing data released to users in July 2020. The data package is composed of NetCDF 4 files containing instrumental and scientific measurements, and a Manifest file which contains metadata information related to the description of the product. A Level 2 product is composed of 64 measurement files containing: 13 files containing Water-leaving reflectance, 13 files containing Land surface reflectance and 13 files containing the TOA reflectance (for all bands except those dedicated to measurement of atmospheric gas - M11 and M15), and several files containing additional measurements on Ocean, Land and Atmospheric parameters and annotation. The Auxiliary data used are listed in the Manifest file associated to each product. The Level 2 FR product covers the complete instrument swath. The product duration is not fixed and it can span up to the time interval of the input Level 0/Level 1. Thus the estimated size of the Level 2 FR is dependent on the start/stop time of the acquired segment. During the Envisat mission, acquisition of MERIS Full Resolution data was subject to dedicated planning based on on-demand ordering and coverage of specific areas according to operational recommendations and considerations. See yearly and global density maps to get a better overview of the MERIS FR coverage.
Data - EO Sign In Authentication (Open)
Envisat MERIS Reduced Resolution - Level 1 [MER_RR__1P/ME_1_RRG]
The MERIS Level 1 Reduced Resolution (RR) product contains the Top of Atmosphere (TOA) upwelling spectral radiance measurements at reduced resolution. The in-band reference irradiances for the 15 MERIS bands are computed by averaging the in-band solar irradiance of each pixel. The in-band solar irradiance of each pixel is computed by integrating the reference solar spectrum with the band-pass of each pixel. The MERIS RR Level 1 product has Sentinel 3-like format starting from the 4th reprocessing data released to users in July 2020. Each measurement and annotation data file is in NetCDF 4. The Level 1 product is composed of 22 measurements data files, 15 files containing radiances at each band (one band per file), accompanied by the associated error estimates, and 7 annotation data files. The band-pass of each pixel is derived from on-ground and in-flight characterisation via an instrument model. The values "Band wavelength" and "Bandwidth" provided in the Manifest file of the Level 1 products are the averaged band-pass of each pixel over the instrument field of view. The Auxiliary data used are listed in the Manifest file associated to each product. MERIS was operating continuously on the day side of the Envisat orbit (descending track). RR data was acquired over 43.5 minutes in each orbit, i.e. 80% of the descending track.
Data - EO Sign In Authentication (Open)
Envisat MERIS Reduced Resolution - Level 2 [MER_RR__2P/ME_2_RRG]
MERIS RR Level 2 is a Reduced Resolution (RR) Geophysical product for Ocean, Land and Atmosphere. Each MERIS Level 2 geophysical product is derived from a MERIS Level 1 product and auxiliary parameter files specific to the MERIS Level 2 processing. The MERIS RR Level 2 product has a Sentinel 3-like format starting from the 4th reprocessing data released to users in July 2020. The data package is composed of NetCDF 4 files containing instrumental and scientific measurements, and a Manifest file, which contains metadata information related to the description of the product. A Level 2 product is composed of 64 measurement files containing mainly: 13 files containing Water-leaving reflectance, 13 files containing Land surface reflectance and 13 files containing the TOA reflectance (for all bands except those dedicated to measurement of atmospheric gas - M11 and M15), and several files containing additional measurement on Ocean, Land and Atmospheric parameters. The Auxiliary data used are listed in the Manifest file associated to each product. MERIS was operating continuously on the day side of the Envisat orbit (descending track). RR data was acquired over 43.5 minutes in each orbit, i.e. 80% of the descending track.
Data - Campaigns (Open)
SPARC
ESA's SPectra bARrax Campaign (SPARC) activity was part of the preparatory study for a proposed ESA Earth Explorer mission called SPECTRA. The objective was to collect a CHRIS/PROBA reference dataset for SPECTRA-related studies.