- All Categories (41)
- Data (3)
- News (3)
- Missions (1)
- Events (3)
- Tools (3)
- Activities (3)
- Campaigns (1)
- Documents (24)
News - Infographics
Key facts about Canada's ozone-studying SCISAT mission
Learn about the SCISAT mission in our new infographic.
News - Success Stories
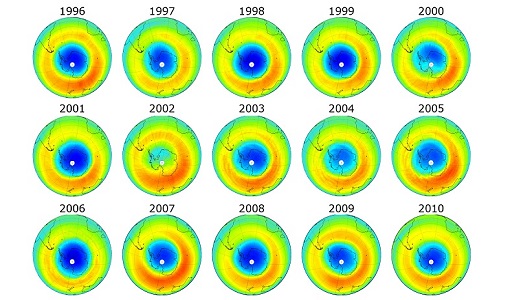
Satellites track the health of the ozone layer
ESA’s Earth observation activities are contributing to international efforts to monitor and preserve the layer of stratospheric ozone that blankets the planet.
Document - Proceedings

EO-Summer-School-2-Overview-of-land-surface-parameters-from-EO.pdf
Overview of land surface parameters from Earth Observation
Activity - General activities
MUltisource data package tools and SErvices (MUSE)
The MUSE project aims to develop and integrate a tool to simultaneously manipulate geospatial data products, satellite, model and in-situ data.
News - Thematic area articles
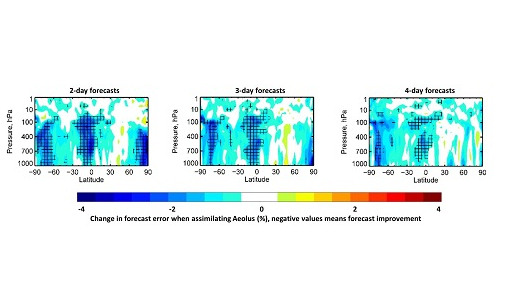
Space data help to unravel the complexities of Earth’s atmosphere
As the impacts of the climate crisis intensify, scientists are using ESA’s Earth observation archives to investigate atmospheric processes and their influences on the planet’s changing environment.
Event - Conference

Atmospheric Science Conference 2006
The 2006 conference was dedicated the theme atmosphere to provide scientists and data users with the opportunity to present first-hand and up-to-date results from their ongoing research activities ESA Mission instruments.
Event - Workshop

ESA/MERIS Workshop 2008
The ESA/MERIS Workshop 2008 covered the use of Envisat/MERIS data and the wider ESA-NASA-NOAA plans and collaboration.
Document - Publication - Paper

Atmospheric-Chemistry-Experiment-ACE-Mission-Overview.pdf
This paper was published in the GEOPHYSICAL RESEARCH LETTERS, Vol.32 (L15S01, doi:10.1029/2005GL022386, 2005) and presents an overview of the Canadian mission SCISAT-1 (also known as the Atmospheric Chemistry Experiment ACE) and some of its first scientific results.
Tools - Visualisation
EVDC Orbit Prediction Tool
The EVDC Orbit Prediction and Overpass Tool generates and visualises satellite's overpasses.
Data - External Data (Restrained)

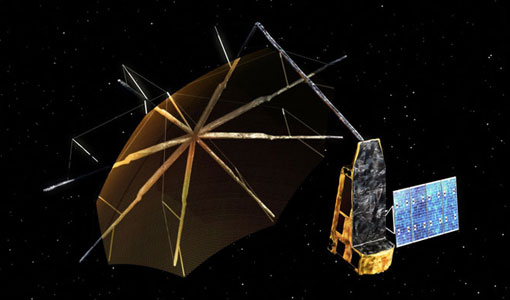
SciSat-1: ACE-FTS and MAESTRO
SCISAT-1 data aim at monitoring and analysing the chemical processes that control the distribution of ozone in the upper troposphere and stratosphere. It provides acquisitions from the two instruments MAESTRO and ACE-FTS. MAESTRO: Measurement of Aerosol Extinction in the Stratosphere and Troposphere Retrieved by Occultation. Dual-channel optical spectrometer in the spectral region of 285-1030 nm. The objective is to measure ozone, nitrogen dioxide and aerosol/cloud extinction (solar occultation measurements of atmospheric attenuation during satellite sunrise and sunset with the primary objective of assessing the stratospheric ozone budget). Solar occultation spectra are being used for retrieving vertical profiles of temperature and pressure, aerosols, and trace gases (O3, NO2, H2O, OClO, and BrO) involved in middle atmosphere ozone distribution. The use of two overlapping spectrometers (280 - 550 nm, 500 - 1030 nm) improves the stray-light performance. The spectral resolution is about 1-2 nm. ACE-FTS: Fourier Transform Spectrometer. The objective is to measure the vertical distribution of atmospheric trace gases, in particular of the regional polar O3 budget, as well as pressure and temperature (derived from CO2 lines). The instrument is an adapted version of the classical sweeping Michelson interferometer, using an optimised optical layout. The ACE-FTS measurements are recorded every 2 s. This corresponds to a measurement spacing of 2-6 km which decreases at lower altitudes due to refraction. The typical altitude spacing changes with the orbital beta angle. For historical reasons, the retrieved results are interpolated onto a 1 km "grid" using a piecewise quadratic method. For ACE-FTS version 1.0, the results were reported only on the interpolated grid (every 1 km from 0.5 to 149.5 km). For versions 2.2, both the "retrieval" grid and the "1 km" grid profiles are available. SCISAT-1 collection provides ACE-FTS and MAESTRO Level 2 Data. As of today, ACE-FTS products are available in version 4.1, while MAESTRO products are available in version 3.13.
Data - External Data (Restrained)
ADAM Surface Reflectance Database v4.0
ADAM enables generating typical monthly variations of the global Earth surface reflectance at 0.1° spatial resolution (Plate Carree projection) and over the spectral range 240-4000 nm. The ADAM product is made of gridded monthly mean climatologies over land and ocean surfaces, and of a companion API toolkit that enables the calculation of hyperspectral (at 1 nm resolution over the whole 240-4000 nm spectral range) and multidirectional reflectances (i.e. in any illumination/viewing geometry) depending on user choices. The ADAM climatologies that feed the ADAM calculation tools are: For ocean: Monthly chlorophyll concentration derived from SeaWiFS-OrbView-2 (1999-2009); it is used to compute the water column reflectance (which shows large spectral variations in the visible, but is insignificant in the near and mid infrared). Monthly wind speed derived from SeaWinds-QuikSCAT-(1999-2009); it is used to calculate the ocean glint reflectance. For land: Monthly normalized surface reflectances in the 7 MODIS narrow spectral bands derived from FondsdeSol processing chain of MOD09A1 products (derived from Aqua and Terra observations), on which relies the modelling of the hyperspectral/multidirectional surface (soil/vegetation/snow) reflectance. Uncertainty variance-covariance matrix for the 7 spectral bands associated to the normalized surface reflectance. For sea-ice: Sea ice pixels (masked in the original MOD09A1 products) have been accounted for by a gap-filling approach relying on the spatial-temporal distribution of sea ice coverage provided by the CryoClim climatology for year 2005.
Tools - Analysis
Sentinel-3 Toolbox
The Toolbox consists of a set of visualisation, analysis and processing tools for the exploitation of OLCI and SLSTR data.
Tools - Analysis
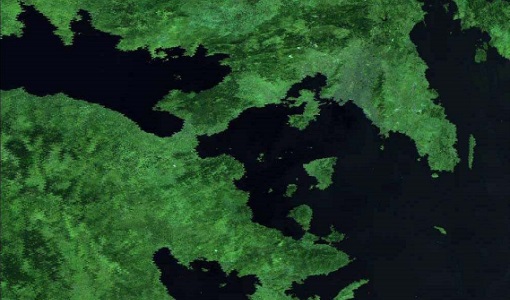
Sentinel-2 Toolbox
The Toolbox consists of a rich set of visualisation, analysis and processing tools for the exploitation of optical high-resolution products including the Sentinel-2 MSI sensor.
Data - Campaigns (Open)
THERMOPOLIS
The THERMOPOLIS 2009 campaign mainly served the DUE “Urban Heat islands (UHI) and Urban Thermography (UT) Project”
Campaign
THERMOPOLIS
The THERMOPOLIS 2009 campaign mainly served the DUE “Urban Heat islands (UHI) and Urban Thermography (UT) Project”
Document - Algorithms Theoretical Baseline Document

cawa-requirements-baseline.pdf
CAWA (Advanced Clouds, Aerosols and WAter vapour products for Sentinel-3/OLCI) requirements baseline document provides information about the physical background, technical structure and the functional principle of the CAWA total column water vapour retrieval as defined within the CAWA project, which aims to the development and improvement of advanced atmospheric retrieval algorithms for the Envisat/MERIS and Sentinel-3/OLCI mission.
Activity - Quality
SEOM CAWA
The Advanced Clouds, Aerosols and WAter vapour products for Sentinel-3/OLCI project aims to develop and improve the advanced atmospheric retrieval algorithms developed for MERIS and OLCI instruments.
Document - Product Specifications
ACE-FTS Atmospheric Chemistry Experiment - File format description for ACE-Imager level 2 data ---