- All Categories (2766)
- Data (3)
- News (15)
- Missions (2)
- Events (17)
- Tools (8)
- Activities (8)
- Campaigns (1)
- Documents (2712)
DATA
Discover and download the Earth observation data you need from the broad catalogue of missions the European Space Agency operate and support.
Data - EO Sign In Authentication (Open)
Envisat AATSR L1B Brightness Temperature/Radiance [ENV_AT_1_RBT]
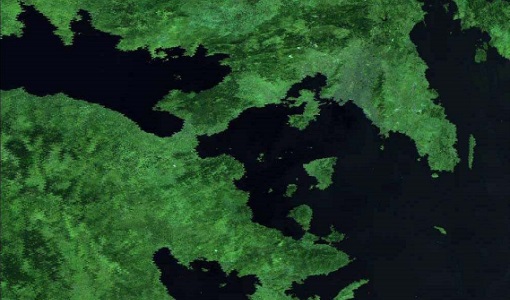
- AATSR Full Resolution land and ocean cover image of the Iberian Peninsula from 28 October 2006 AATSR Full Resolution land cover image of the Iberian Peninsula from 28 October 2006. The Envisat AATSR Level 1B Brightness Temperature/Radiance product (RBT) contains top of atmosphere (TOA) brightness temperature (BT) values for the infra-red channels and radiance values for the visible channels, on a 1-km pixel grid. Values for each channel and for the nadir and oblique views occupy separate NetCDF files within the Sentinel-SAFE format, along with associated uncertainty estimates. Additional files contain cloud flags, land and water masks, and confidence flags for each image pixel, as well as instrument and ancillary meteorological information. This AATSR product [ENV_AT_1_RBT] in NetCDF format stemming from the 4th AATSR reprocessing, is a continuation of ERS ATSR data and a precursor of Sentinel-3 SLSTR data. It has replaced the former L1B product [ATS_TOA_1P] in Envisat format from the 3rd reprocessing. Users with Envisat-format products are recommended to move to the new Sentinel-SAFE like/NetCDF format products. The 4th reprocessing of Envisat AATSR data was completed in 2022; the processing updates that have been put in place and the expected scientific improvements have been outlined in full in the User Documentation for (A)ATSR 4th Reprocessing Products.
Data - External Data (Restrained)

ADAM Surface Reflectance Database v4.0
ADAM enables generating typical monthly variations of the global Earth surface reflectance at 0.1° spatial resolution (Plate Carree projection) and over the spectral range 240-4000 nm. The ADAM product is made of gridded monthly mean climatologies over land and ocean surfaces, and of a companion API toolkit that enables the calculation of hyperspectral (at 1 nm resolution over the whole 240-4000 nm spectral range) and multidirectional reflectances (i.e. in any illumination/viewing geometry) depending on user choices. The ADAM climatologies that feed the ADAM calculation tools are: For ocean: Monthly chlorophyll concentration derived from SeaWiFS-OrbView-2 (1999-2009); it is used to compute the water column reflectance (which shows large spectral variations in the visible, but is insignificant in the near and mid infrared). Monthly wind speed derived from SeaWinds-QuikSCAT-(1999-2009); it is used to calculate the ocean glint reflectance. For land: Monthly normalized surface reflectances in the 7 MODIS narrow spectral bands derived from FondsdeSol processing chain of MOD09A1 products (derived from Aqua and Terra observations), on which relies the modelling of the hyperspectral/multidirectional surface (soil/vegetation/snow) reflectance. Uncertainty variance-covariance matrix for the 7 spectral bands associated to the normalized surface reflectance. For sea-ice: Sea ice pixels (masked in the original MOD09A1 products) have been accounted for by a gap-filling approach relying on the spatial-temporal distribution of sea ice coverage provided by the CryoClim climatology for year 2005.
Data - Campaigns (Open)
THERMOPOLIS
The THERMOPOLIS 2009 campaign mainly served the DUE “Urban Heat islands (UHI) and Urban Thermography (UT) Project”